About low-frequency injection -> klog34581
## Abstract
I injected 50.125 Hz sine signal to evaluate the non-linear coupling in DARM spectra about high-frequencies. The noise floor of the spectra of DARM and OMC trans. power seems to be not changed by the injection. However, the coupling between the injection and the 21.625 Hz and 18.5 Hz peaks were observed in both spectra. This indicates that the coupling between these peaks around 20 Hz and the peaks around 45 Hz are close to the current DARM spectra at the sum of these frequncies,
## What I did
I perfomred the non-linear coupling evalutation about high frequencies. I measured spectra of the calibrated DARM displacement (K1:CAL-CS_PROC_DISPLACEMENT_DQ) and the OMC trans. power (K1:OMC-TRANS_DC_SUM_OUT_DQ) by injecting sine signals from the error point of the DARM control (K1:LSC-DARM1_EXC). This time, the injection frequency was fixed 50.125 Hz and the injection amplitudes are used 1e-8, 2e-8, 3e-8, and 4e-8 cnts. I decreased the injection amplitude in this measurement so that the peak in OMC trans. power spectra at the injection frequency become the almost same height as the peak around 45 Hz.
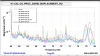
Figure 1 shows the measured spectra (excitation amplitude is written in the legend and blue lines are the spectrum without excitation for the reference). There seems to be no change in the floors of their spectra around 100 Hz. On the other hand, when the injection amplitude is over 3e-8 cnts, some peak around 70 Hz apeared.
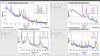
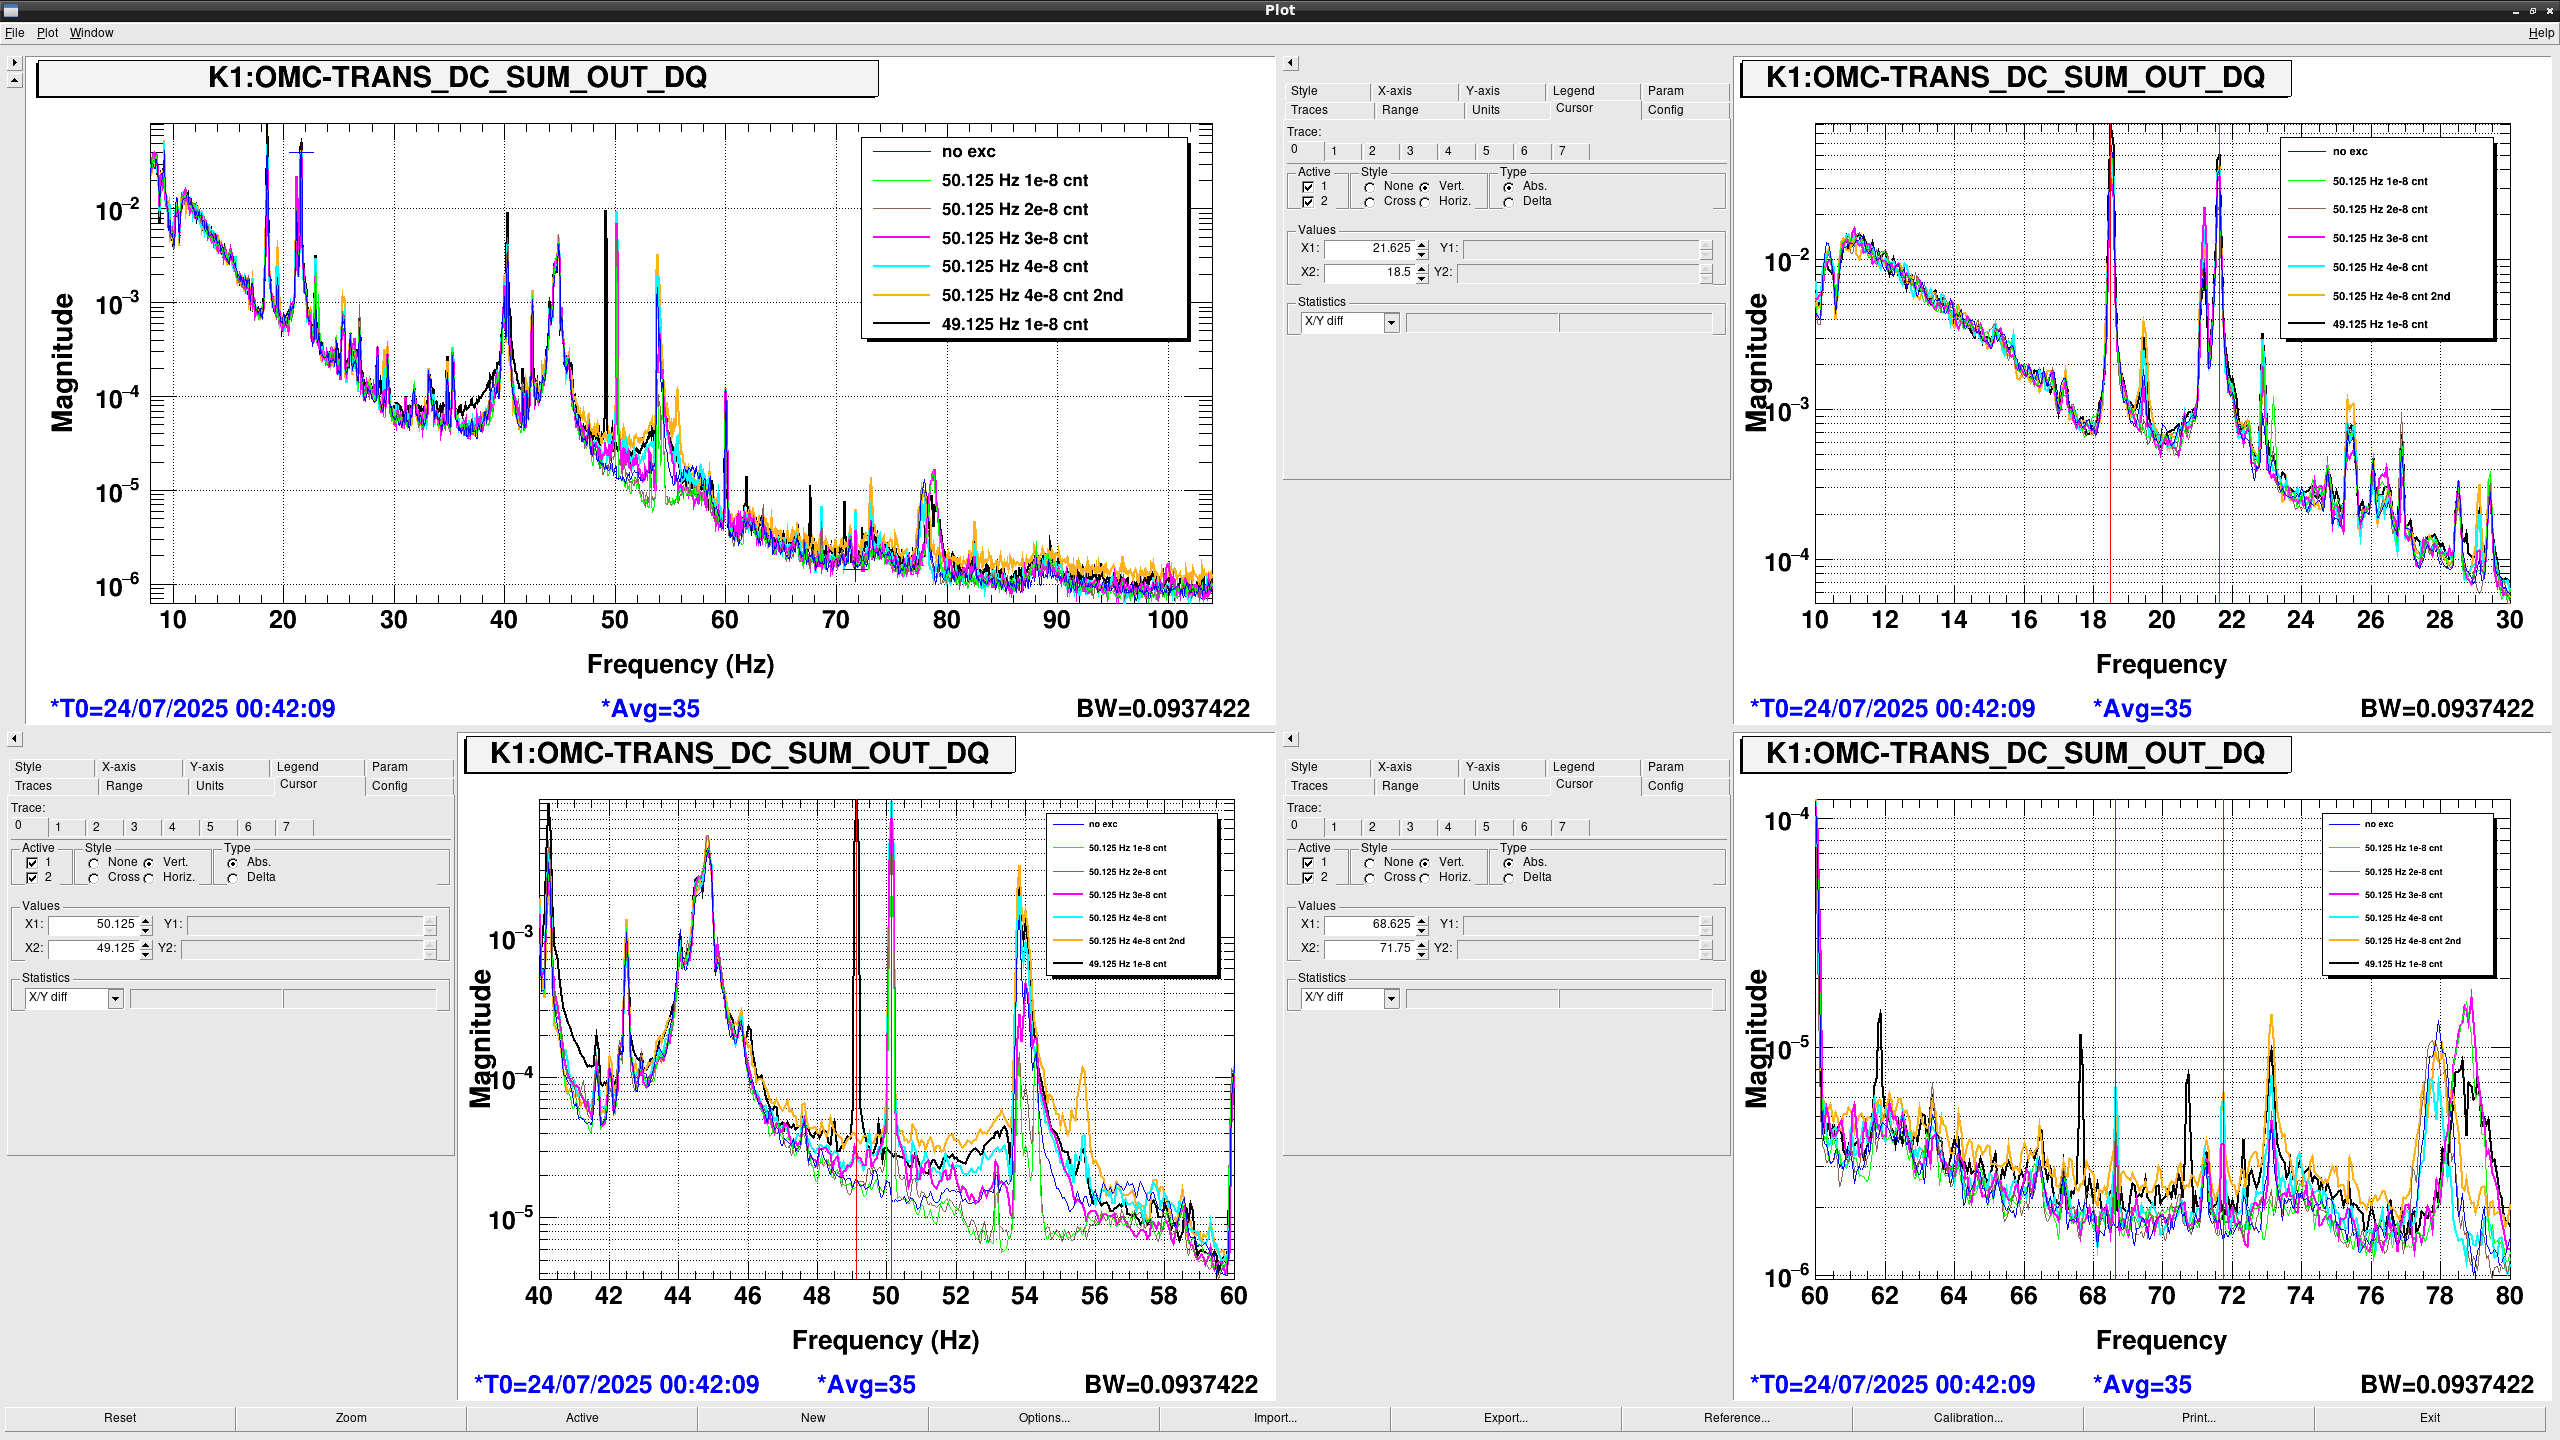
Fig. 2 shows the OMC trans. power spectra with various freq. ranges, the upper left shows the ones between 8 Hz and 100 Hz, the upper right shows the ones from 10 Hz to 30 Hz, the lower left shows the ones from 40 Hz to 60 Hz, and the lower right shows the ones from 60Hz to 80 Hz. (excitation amplitude is written in the legend and blue lines are the spectrum without excitation for the reference) According to the lower right panel, the peaks at 68.625 Hz and 71.75 Hz appeared when the amplitude are 3e-8 cnts (magenta curves) and 4e-8 cnts (cyan curves). Each frequency seems to be sum of the injection peak at 50.125 Hz and the 21.625 Hz, 18.5 Hz peaks, respectively. (That is, 71.75 = 50.125 + 21.625, 68.625 = 50.125 + 18.5) I turned off the excitation at once and turned it on again, Then, the peaks appeared again (orange curves). So these seem to be reproducible. Also, I shifted excitation frequency from 50.125 Hz to 49.125 Hz. then the peaks shifted (black curves). Therefore, their peaks came from the couple between 21.625 Hz and 18.5 Hz peaks and the injection.
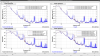
Fig.3 shows the DARM displacement spectra from 60 Hz to 80 Hz. (excitation amplitude is written in the legend and blue lines are the spectrum without excitation for the reference) The same phenomena was seen in the DARM spectrum as in the OMC trans. power spectrum.
Consequently, since the injectin peak height is almost the same as the peak height around 44.8 Hz, the coupling between 21.625 Hz (or 18.5 Hz) and 44.8 Hz (or 40.25 Hz) may be close to the current DARM spectrum at the sum of these frequencies normally. In this case, these peaks should be damped.