[This is yesterday work]
## Abstract
330 Hz and 360 Hz bumps seems to be originated from the periscope but we need more investigation. At least, 400 Hz bumps seems to be originated from the horizontal motion of the periscope judging from the coherences between the accelarometer on the periscope and IMC REFL DC QPD Yaw when IMC was down.
As for a 372 Hz peak, it may be originated from PMC trans. power fluctuation. More investigation is necessary to indentify the cause of this power fluctuation.
## what we did
As response to klog33323, we began to investigate IOO related signals to find the cause of the noise around 300 Hz in the CARM outloop sensor, instead of DARM.
### about 330 Hz and 360 Hz bumps
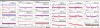
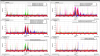
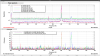
We measured the spectra of IOO related signals (IMC ASC/LSC, PSL) and a CARM outloop sensor (K1:LSC-REFL_PDA3_RF45_I_ERR) with a PRM single bounced beam when IMC locked with 1 W (fig.1). We also measured coherences between IOO signals and the out put loop sensor (fig.2) the black and gray spectra labeled REF in fig.1 is the one when IMC was down and a PSL shutter closed. Therefore, for PD signals, the REF spectra shows the dark noise. However, for QPD signals, since the signals devided by SUM, that is the power on QPD, so we input the SUM offset to 10 cnt to avoid 0 devid intensionaly. And we did not consider the SUM effect about the spectra. We can discuss about the location and the shape of the peak from these spectra. Anyway, the strange shape seems not to be around 300 Hz in the black and gray spectra.
As for the colored spectra when IMC was locked, 330 Hz and 360 Hz bumps can be seen in IMC REFL RF/DC QPDs, but cannot be seen in IMC TRANS QPDs maybe because the power was not enough to observe them. According to klog32562, when IMC was locked with 10W, the noise floor of IMMT1 TRANS QPD2 signals around 300 Hz seems to become lower. As for PDs, these bumps can be seen in ISS PD, IMC TRANS/REFL PDs.
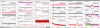
Second, we meaused the spectra after IMC went down and MCe and MCo were misaligned largely not to resonate a light in IMC. Fig. 3 shows the spectra. The black and gray spectra labeled REF in Fig. 3 are the ones when IMC was locked.
As you can see, the 330 Hz and 360 Hz bumps can be seen in IMC REFL DC QPDs, especially PIT. On the other hand, these bumps cannot be seen in ALIGNMON QPD. The 153 Hz peak can be seen in ALIGNMON and the 153 Hz peak height seems to be the same or smaller than 330 Hz and 360 Hz bumps. Therefore, ALIGNMON sensitivity seems to be enough to observe them. These indicate that these bumps are originated from something between ALIGNMON QPDs and IMC REFL QPDs, that is, the periscope or MCI.
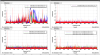
Moreover, we measured the coherences between the accelarometer (ACC) on the pillar of the periscope (fig.4 shows the ACC photo cited by PEM map) and the REFL DC QPDs when IMC was down. Fig. 5 shows the results. There are some coherences around 400 Hz and 430 Hz between the ACC and DC QPD Yaw signals. However, the coherences b.t.w ACC and DCQPD PIT around 330 Hz and 360 Hz seems to be lower than the Yaw coherences around 400 HzAccording to the description of the accelarometer in PEM map, this ACC senses a horizontal lateral motion. Acctually, in the spectra of ACC around 330 Hz and 360 Hz seems to be close to the floor. Therefore, we want to put the ACC which senses the vertical motion and compared the spectra with the DCQPDs one.
Anyway, the 330 Hz and 360 Hz bumps in CARM outloop sensor and DARM may come from the jitter by the motion of the periscope. If eliminate this jitter, the DARM sensitivity might be improved.
### about 372 Hz peak
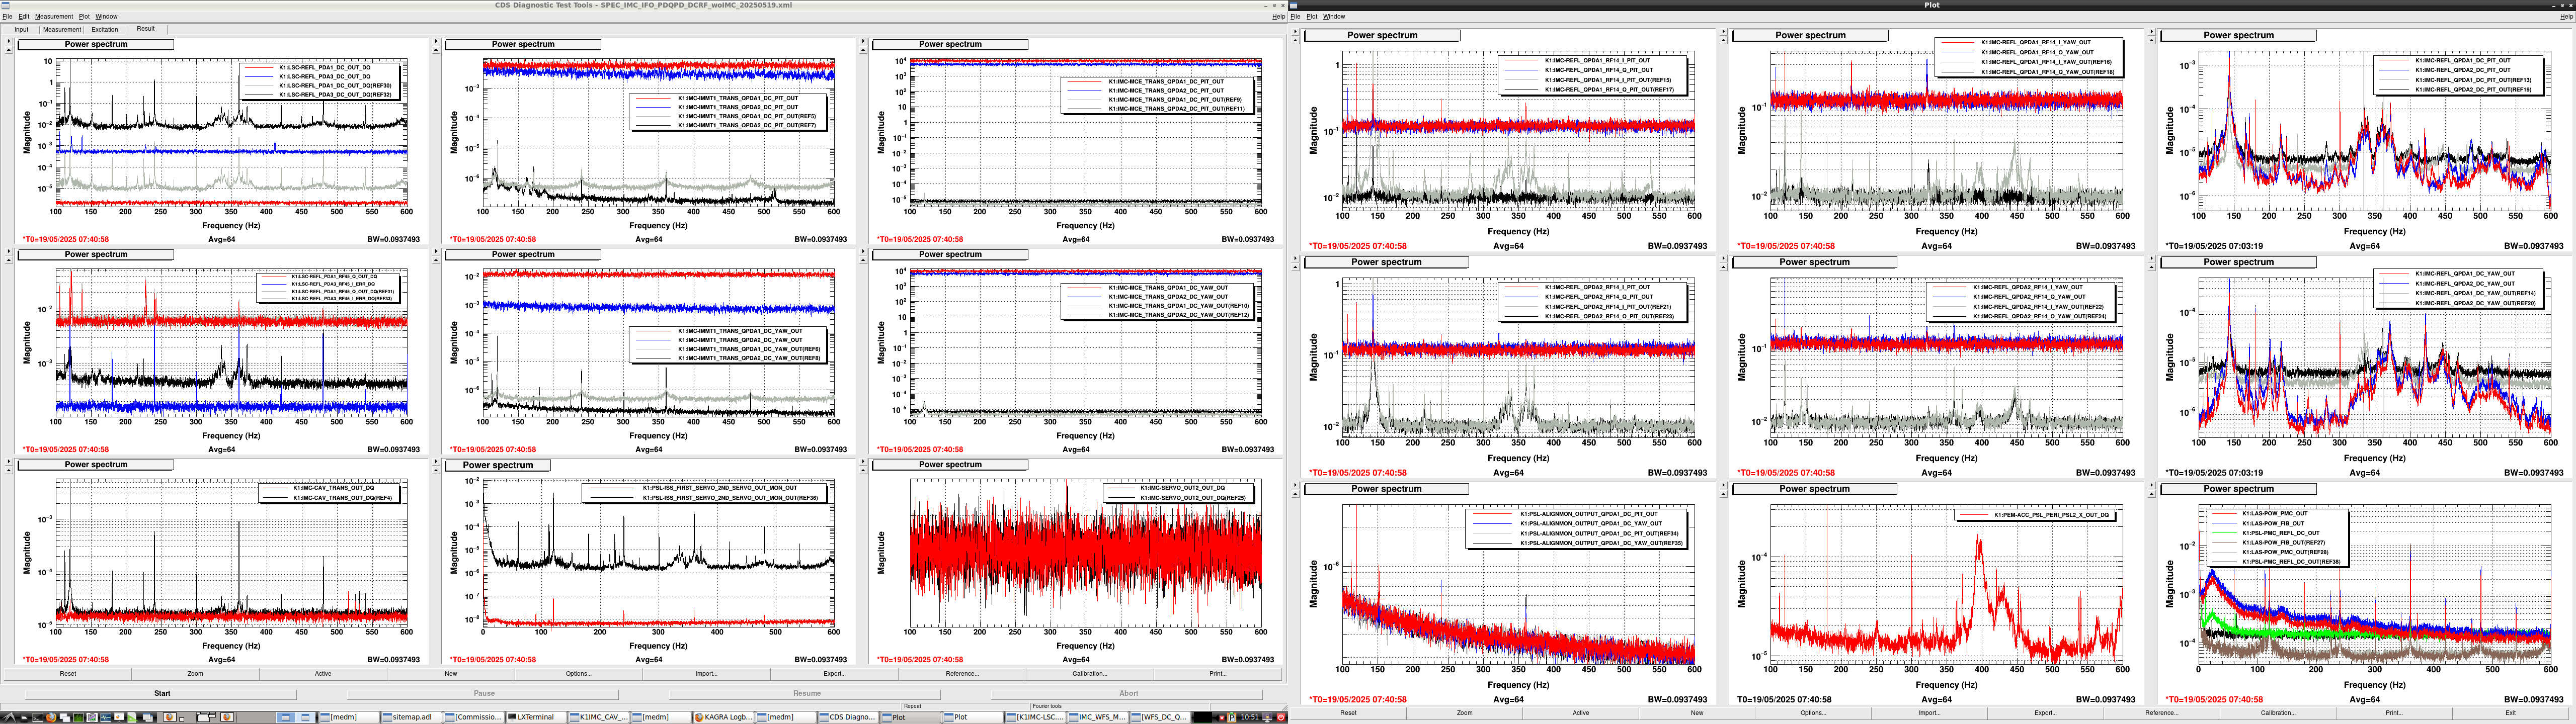
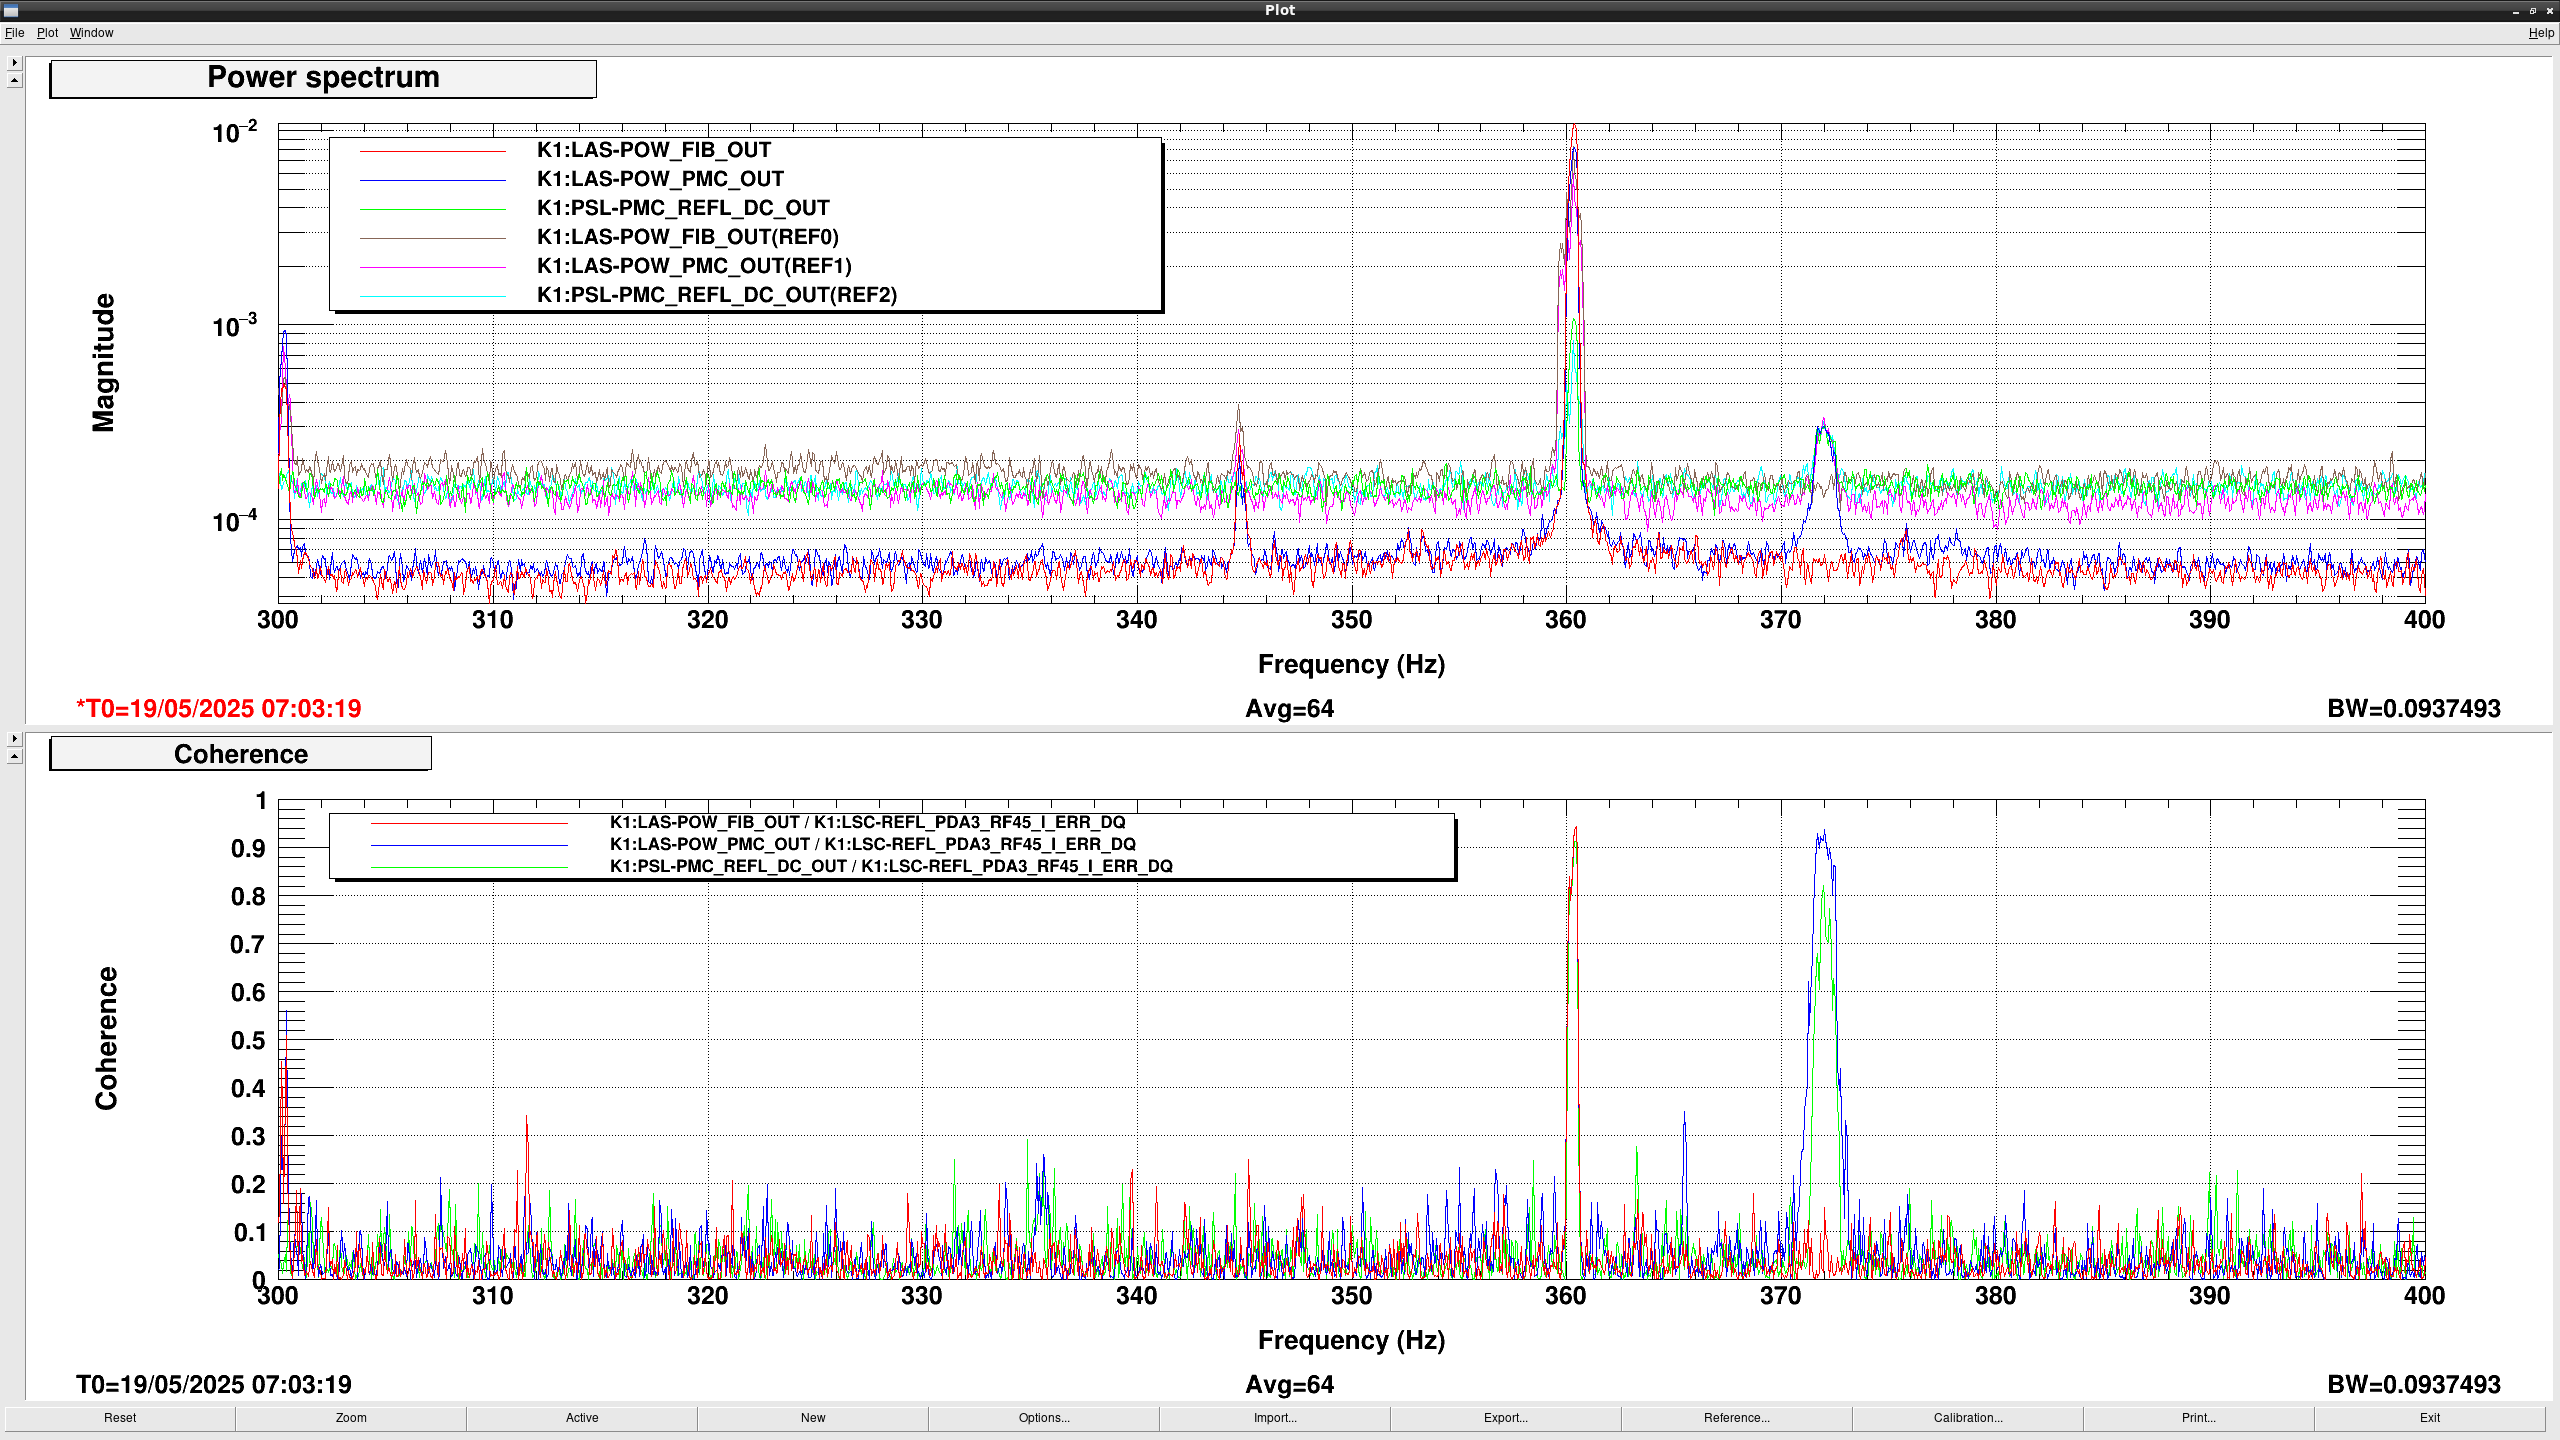
Apart from the 360 Hz bump, there is a peak at 372 Hz. This peak is also in the PMC_OUT spectrum, but the peak is not observed in the FIB_OUT spectrum. Fig. 6 show the spectra of PMC input, refl., trans. powers and the coherences between PMC related signals and tthe CARM out-loop sensor from 300 to 400 Hz. the spectra labeled REF is the one when PMC is down. PMC trans/refl powers have some coherences with the CARM out-loop sensor. the peak can be seen even though PMC is down because PMC seems to be flashed. Anyway, 370 Hz peak seems to be originated from PMC trans. power fluctuation. For now, we are not sure of the cause of this power fluctuation (input jitter? PMC length fluctuation?) According to the PMC REFL image camera, PMC input alignment is bad. So we can distinguish the power fluctuation by the jitter or not if the spectra or coherence become small after PMC alignment is improved.
