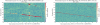
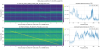
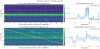
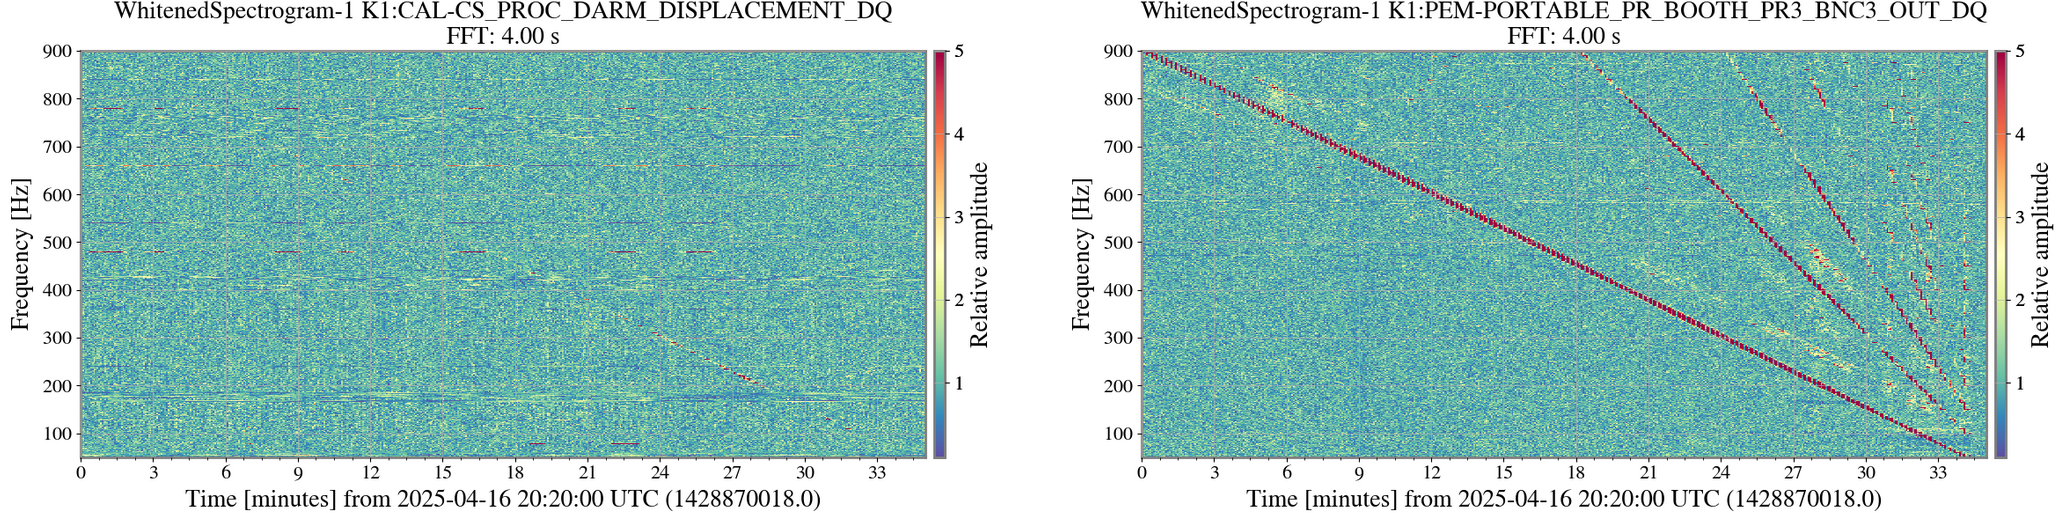
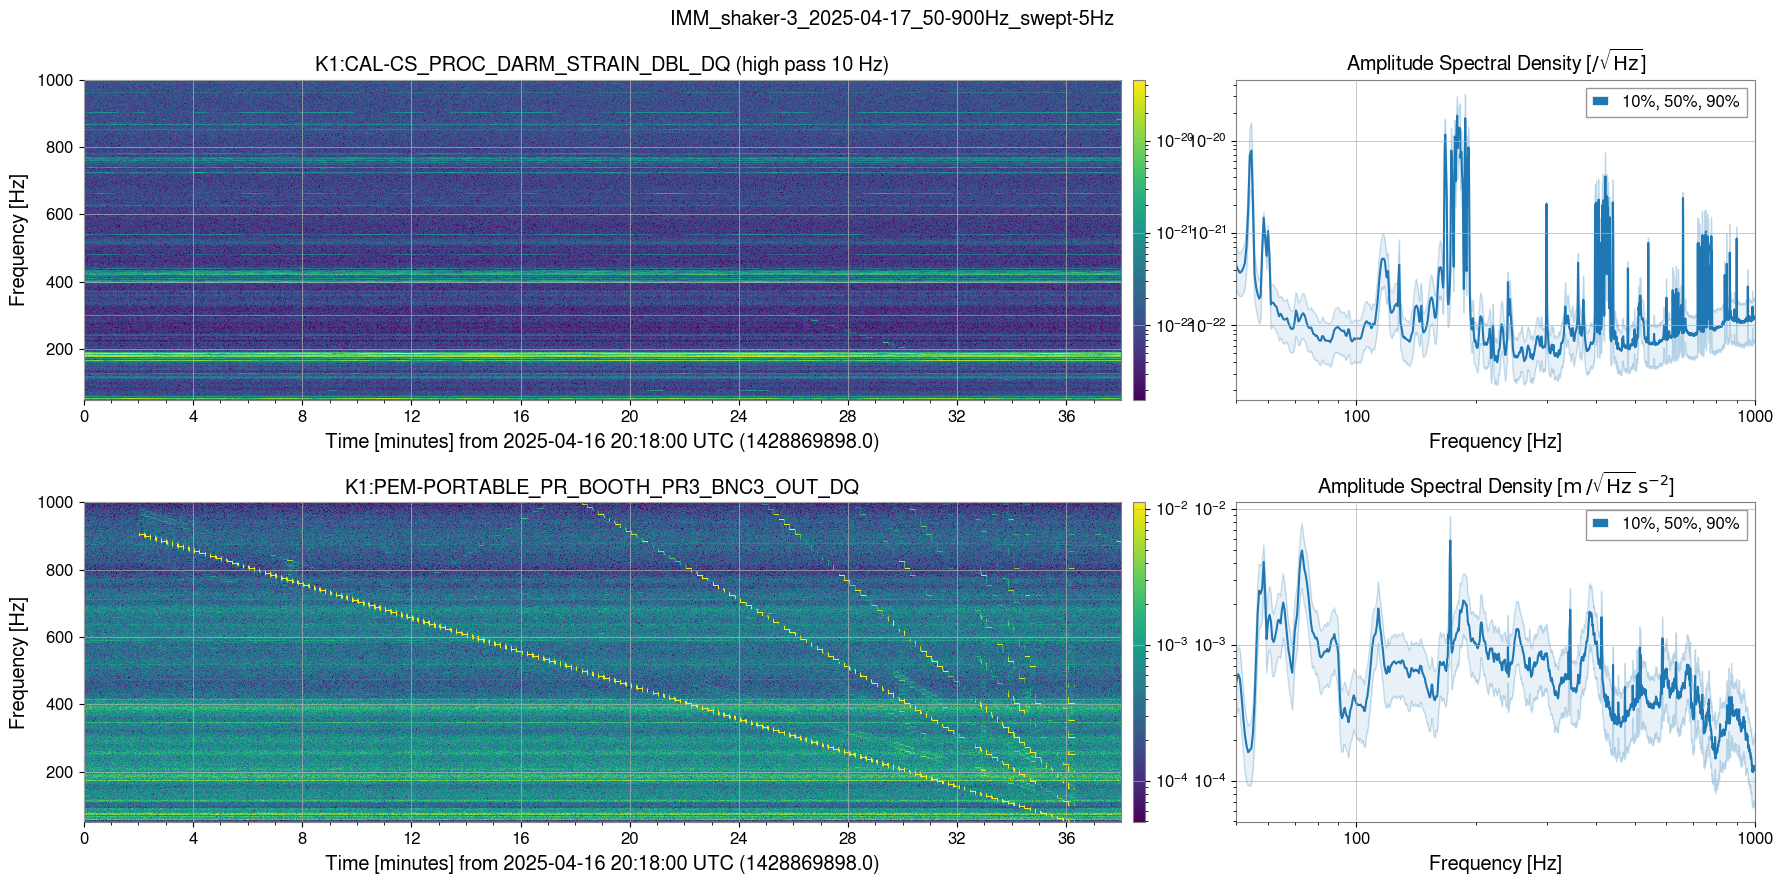
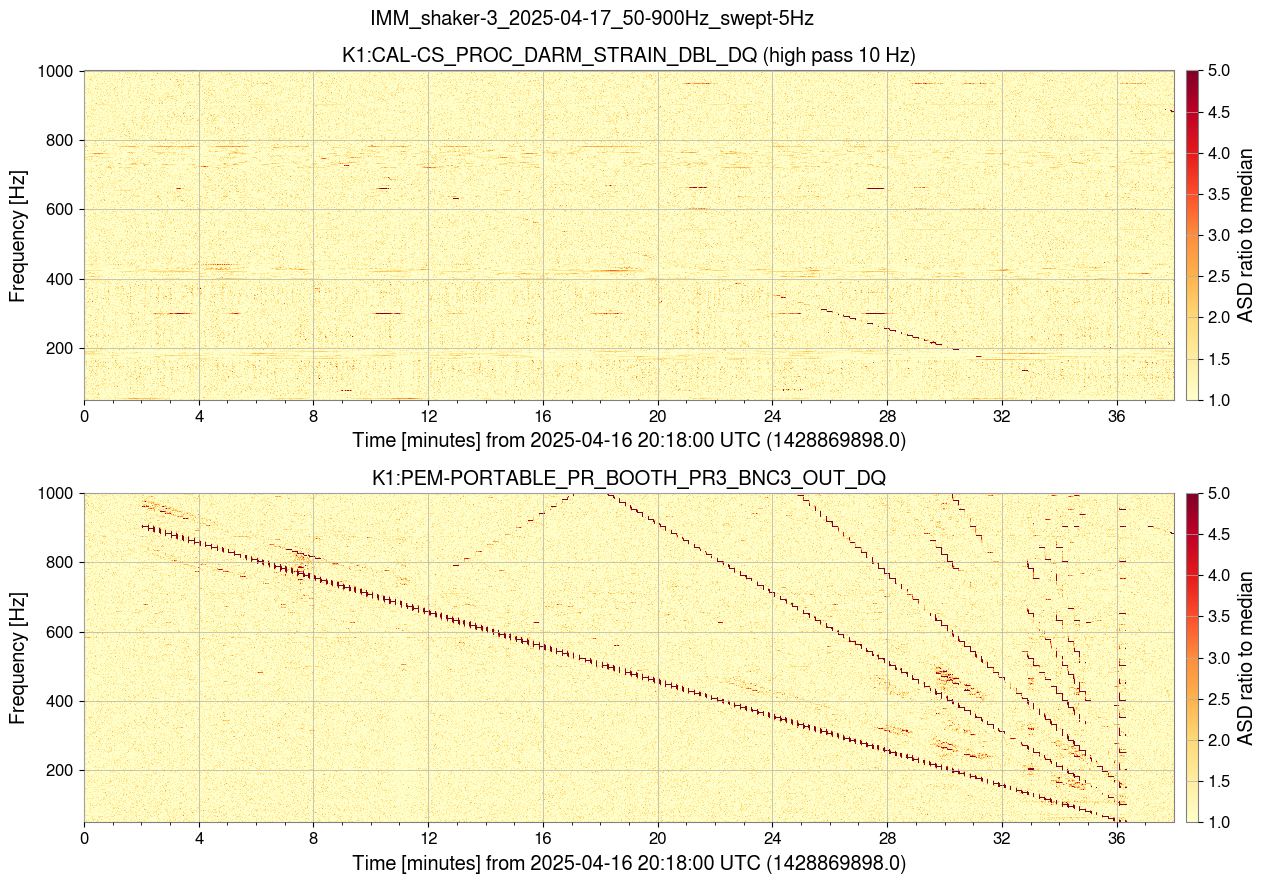
PEM injection using Saker #3 IMM shaker
2025/04/17 5:20:00 - 05:55:00
Excitation : K1:PEM-EXCITATION_MCF0_RACK_11_EXC
50 - 900 Hz , 5Hz resolution, 10 s in each measurement, 100 cnt
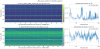
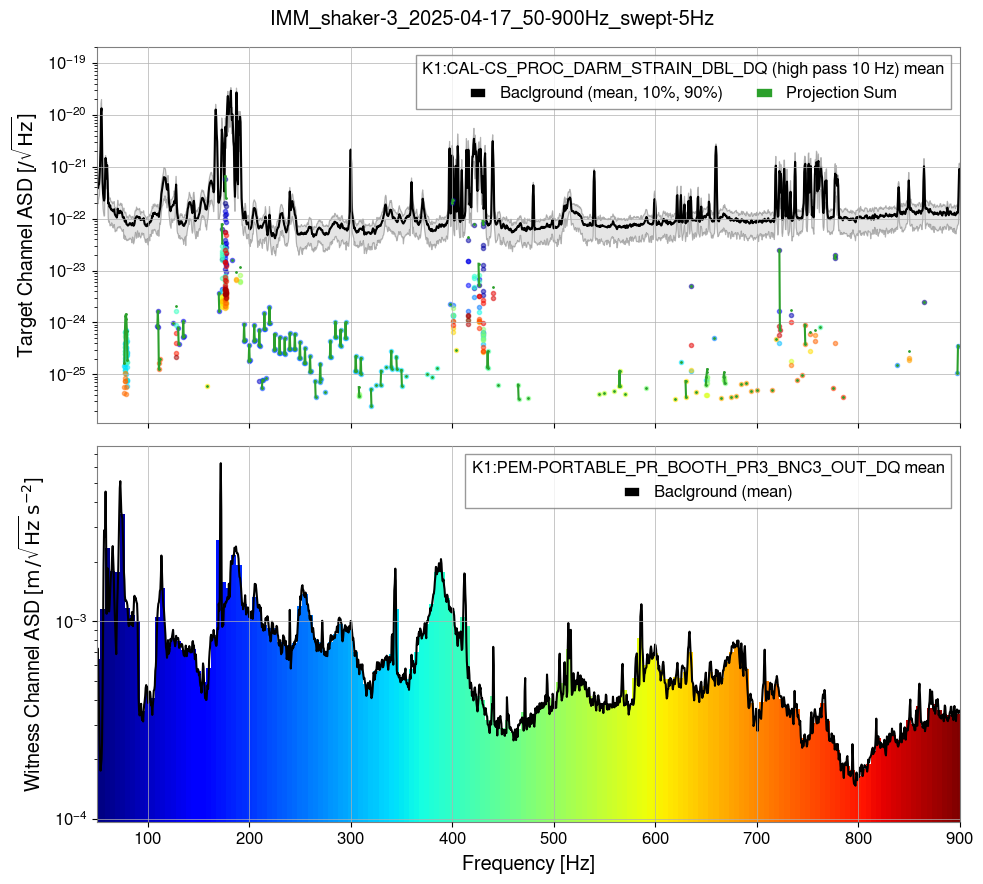
Fig.1. showed the results, there are several linear coupling around 300 Hz, but not so large.
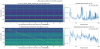
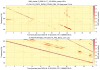
PEM injection using Saker #4 IMM shaker
2025/04/17 5:55:00 - 06:22:00
Excitation : K1:PEM-EXCITATION_MCF0_RACK_12_EXC
50 - 900 Hz , 5Hz resolution, 10 s in each measurement, 100 cnt
During this measurement, lock loss happened
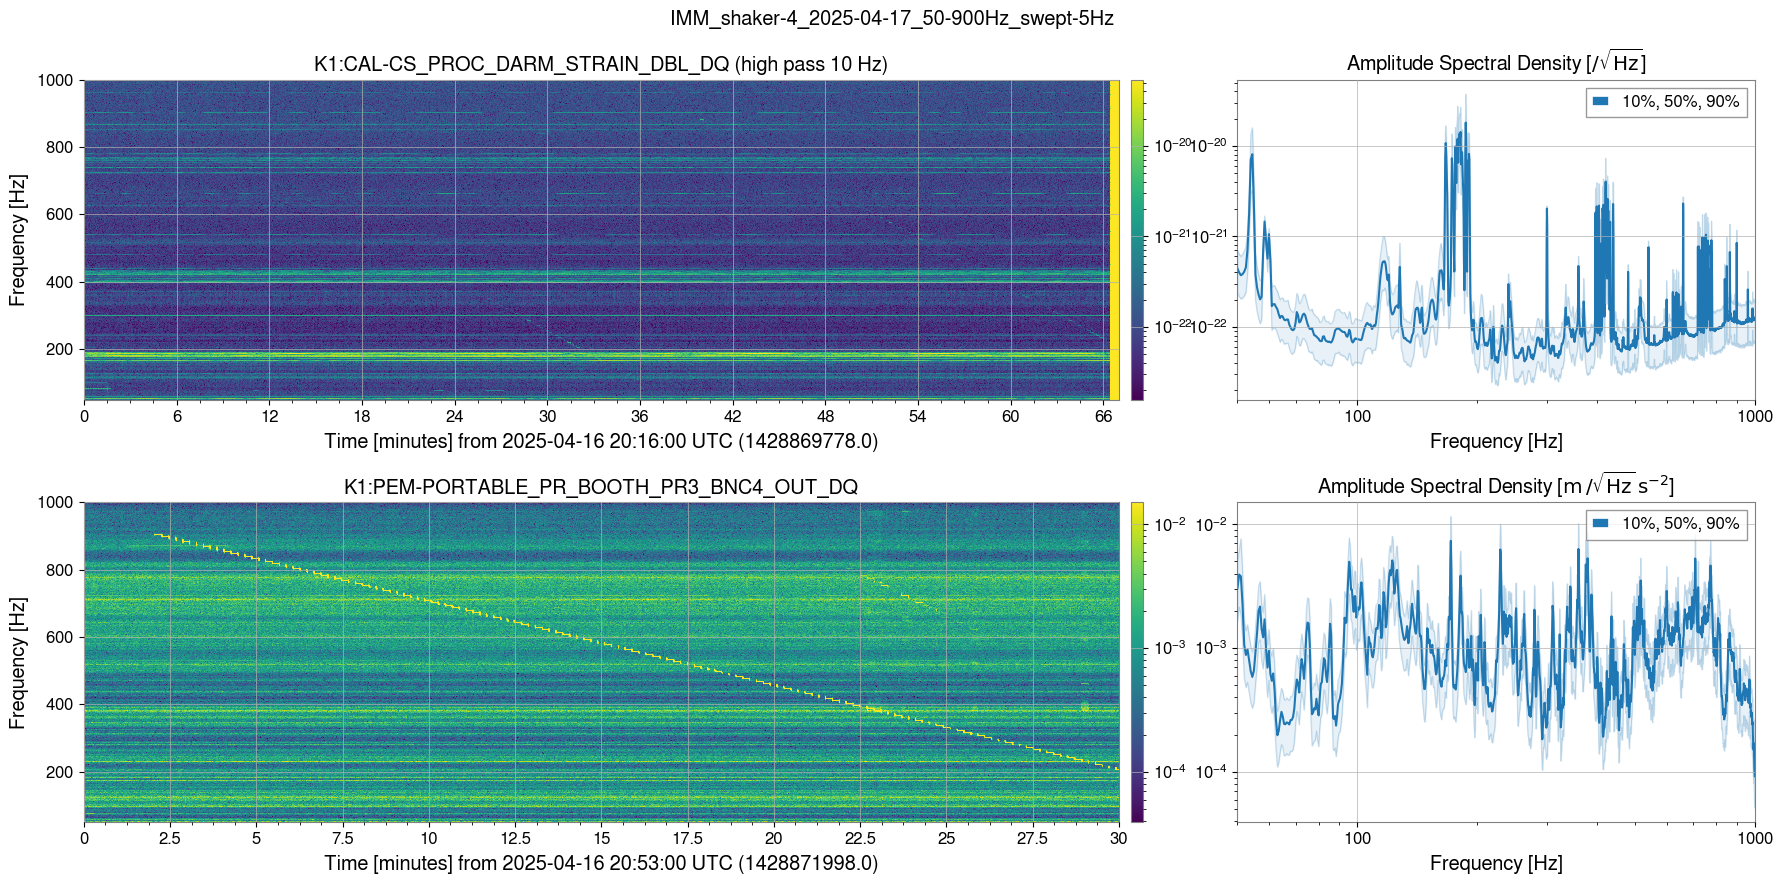
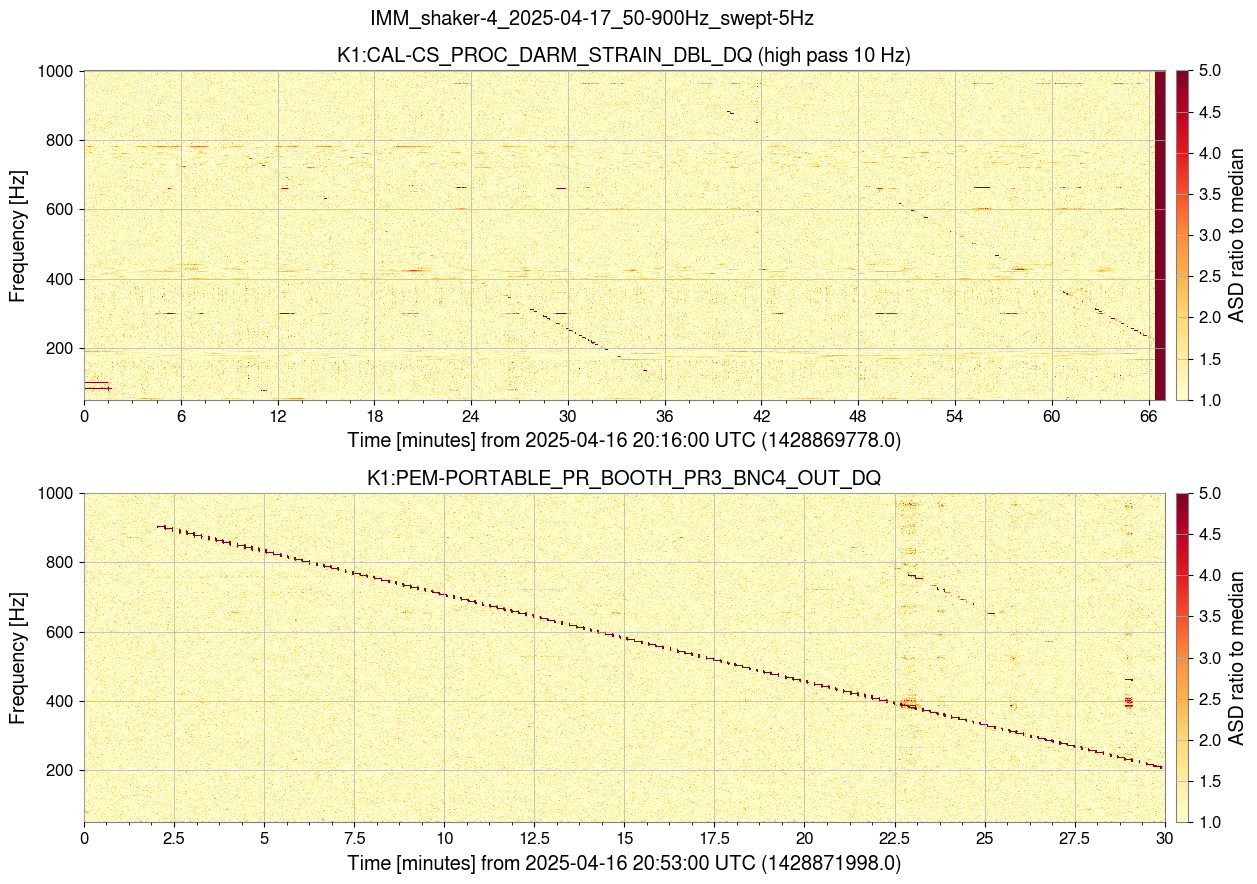
Fig.2. showed the result, several linear coupling can be seen below 400 Hz.
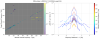
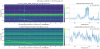
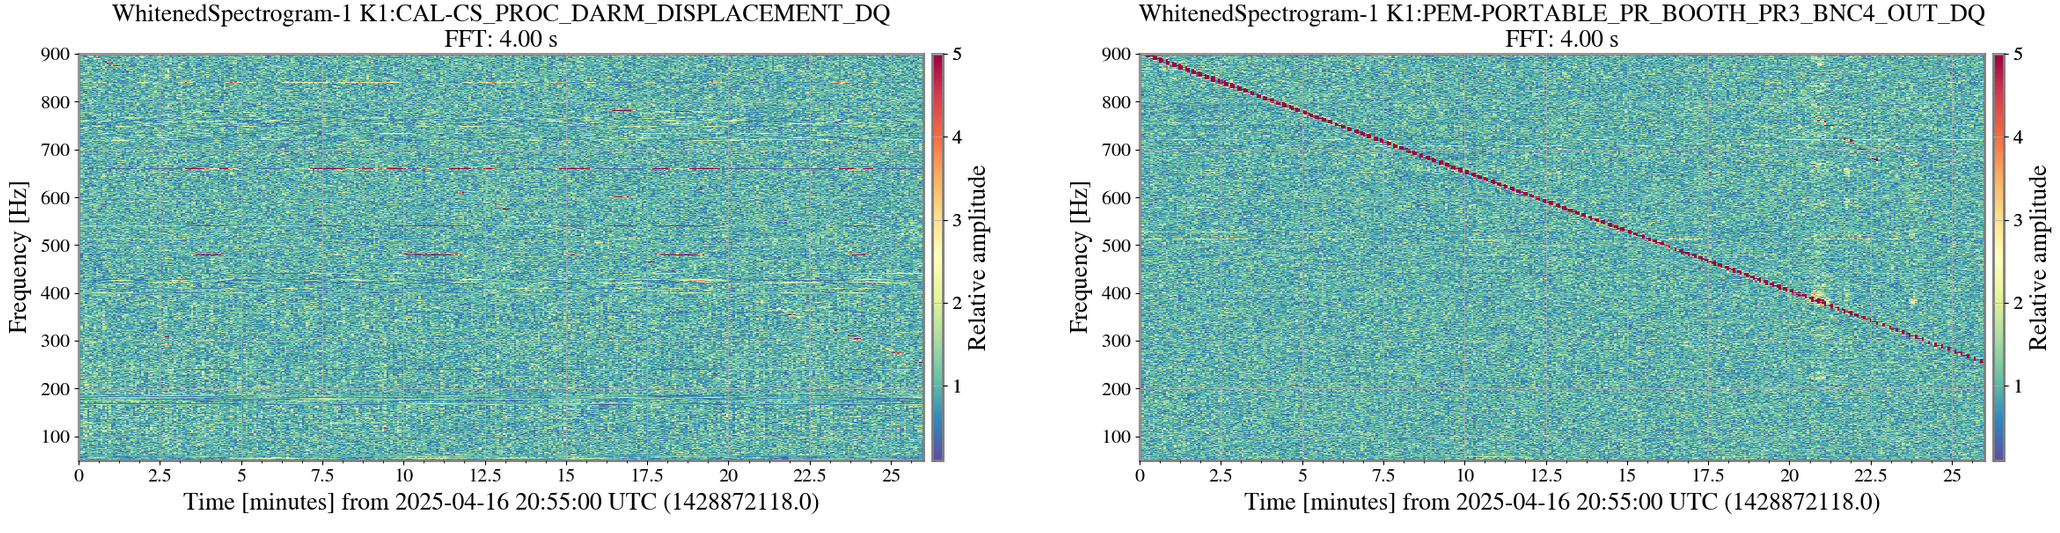
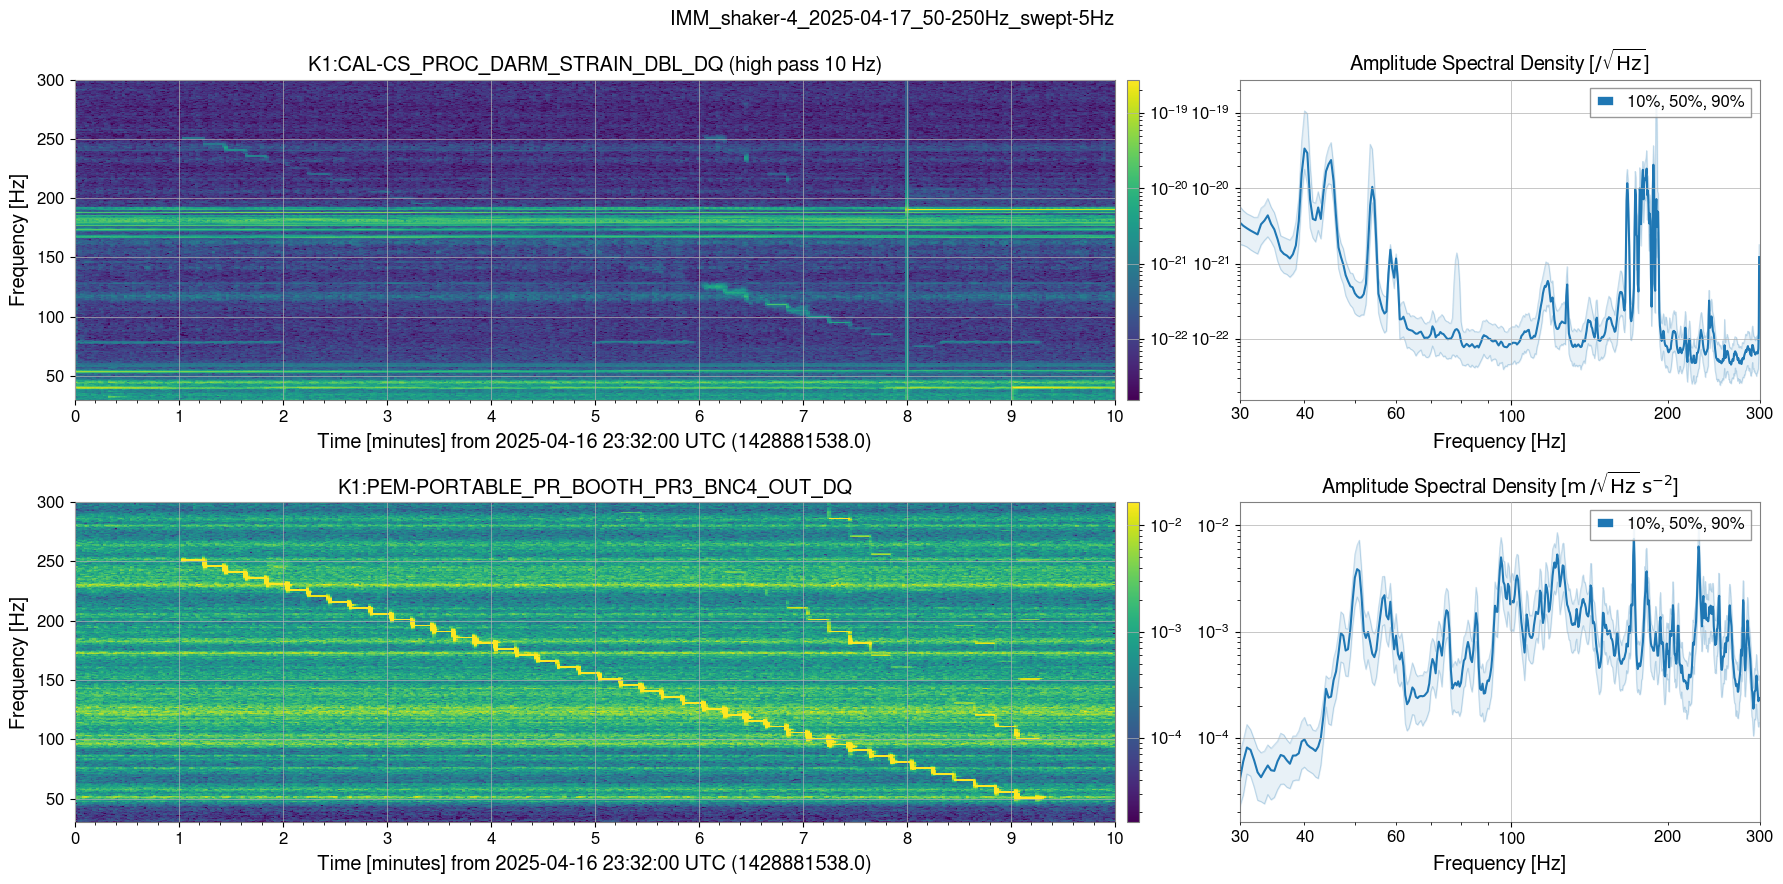
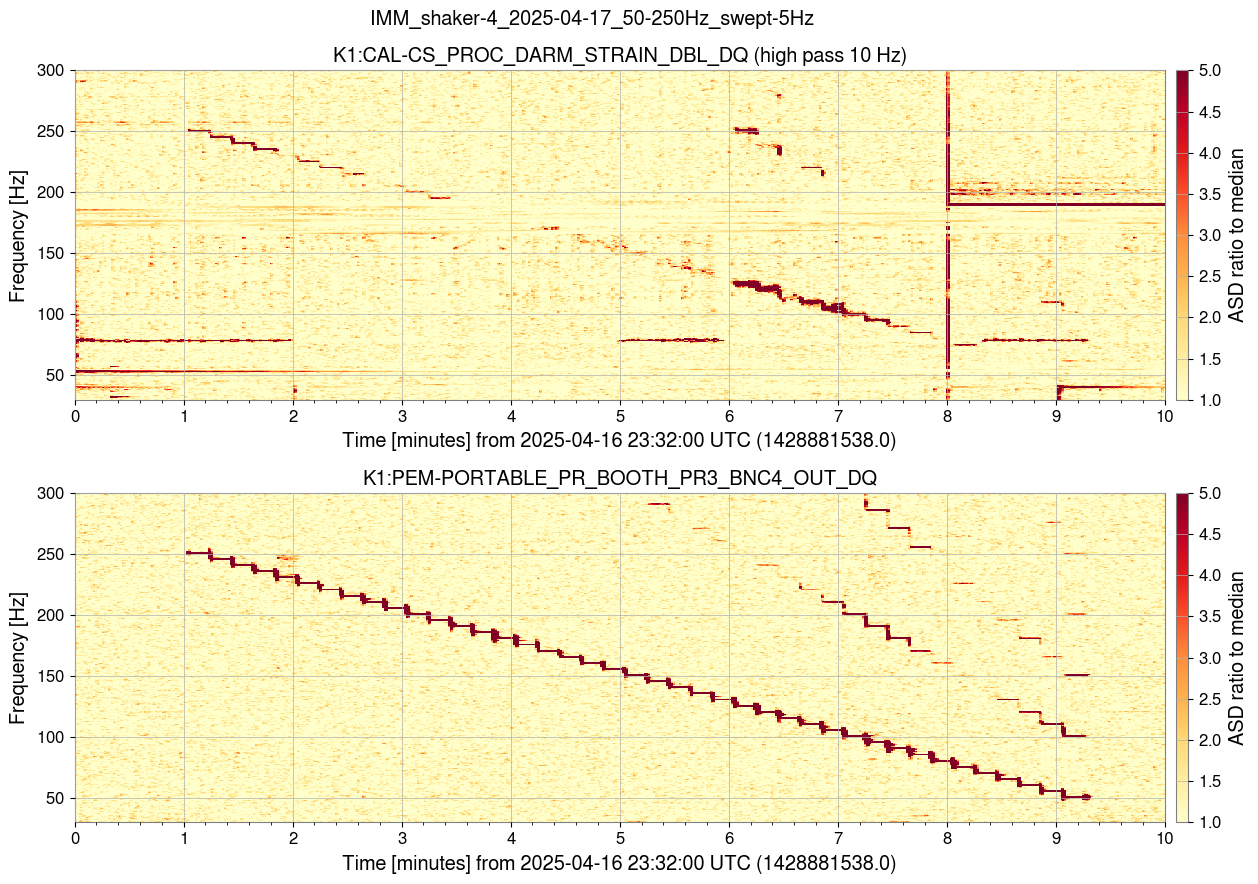
PEM injection using Saker #4 IMM shaker
2025/04/17 8:33:00 - 08:42:00
Excitation : K1:PEM-EXCITATION_MCF0_RACK_12_EXC
50 - 250 Hz , 5Hz resolution, 10 s in each measurement, 100 cnt
Fig.3. showed the result, one large glitch around 7 min, I will investigate later.
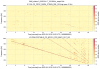
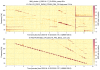
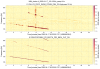
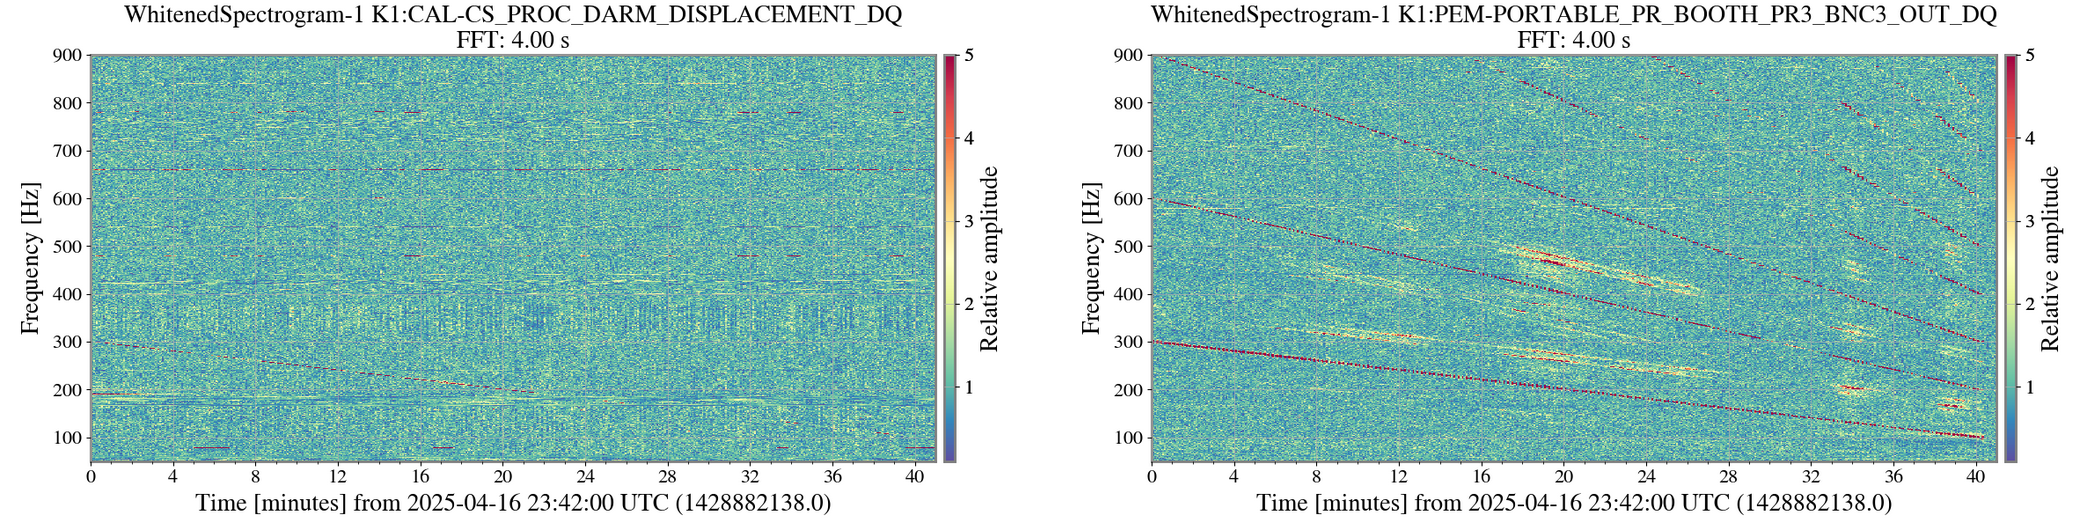
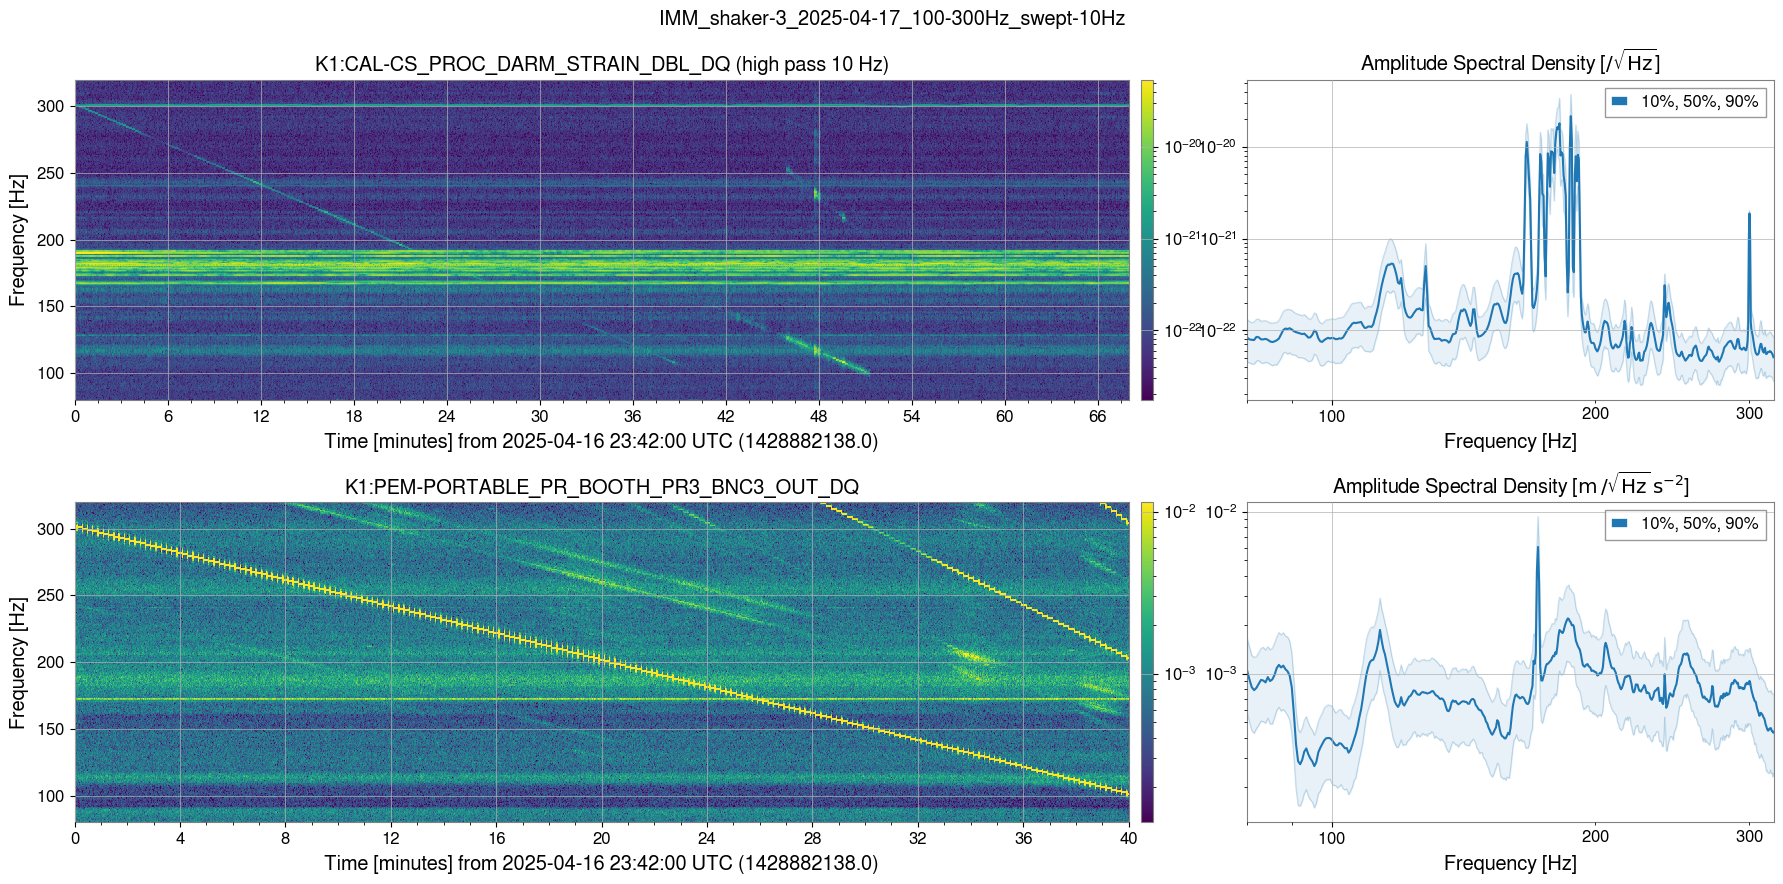
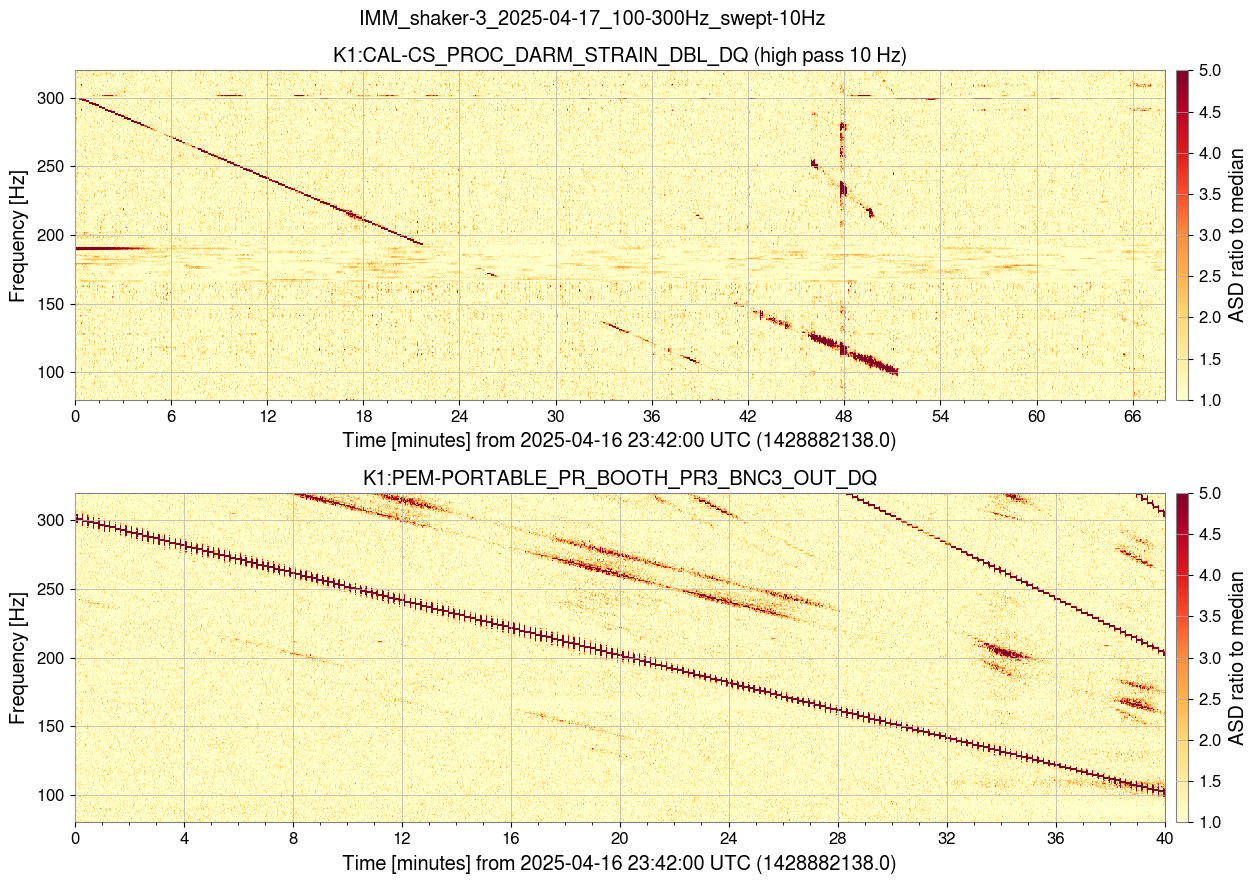
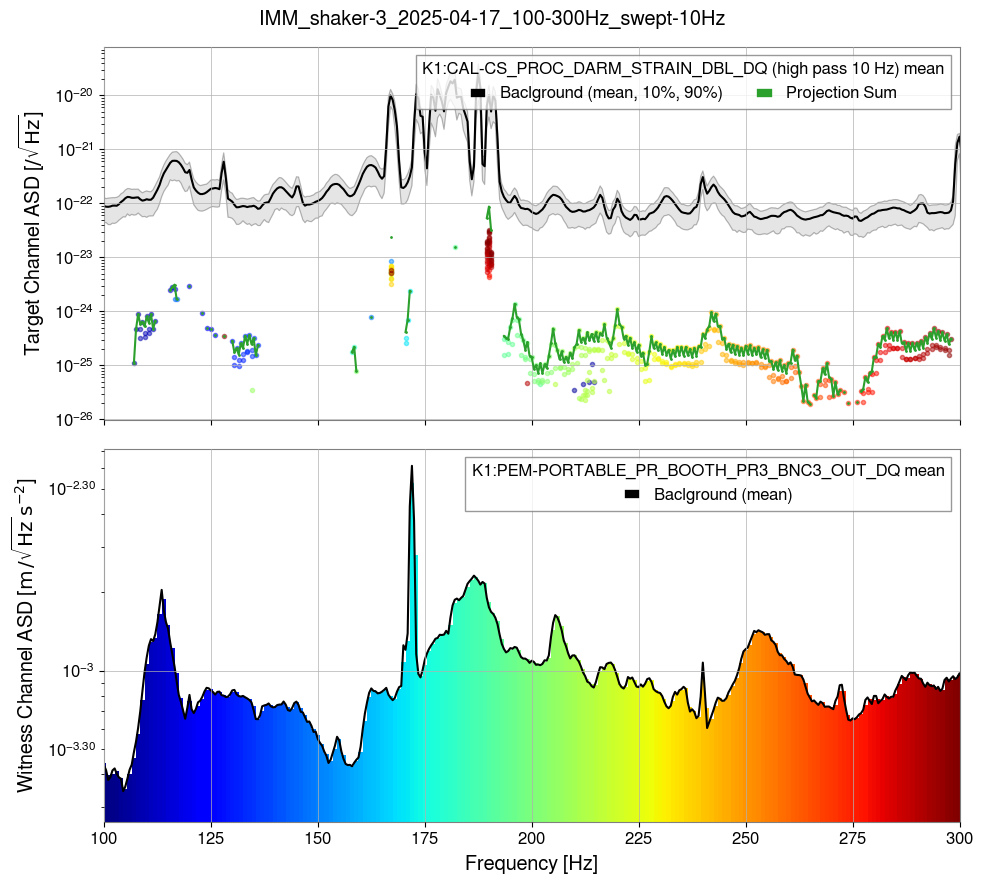
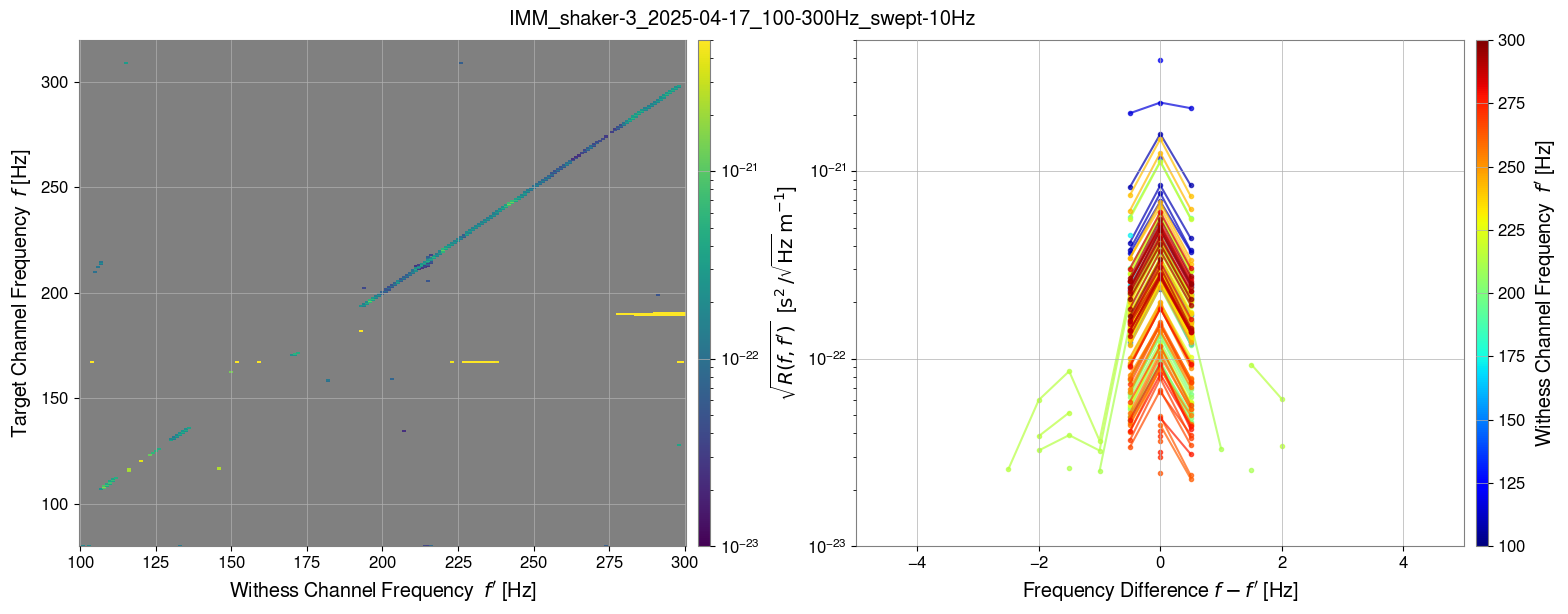
PEM injection using Saker #3 IMM shaker
2025/04/17 8:42:00 - 09:22:00
Excitation : K1:PEM-EXCITATION_MCF0_RACK_11_EXC
100 - 300 Hz , 1Hz resolution, 10 s in each measurement, 100 cnt
Fig.4. showed the result, there are several linear coupling 200 - 300 Hz
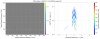
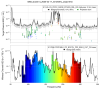
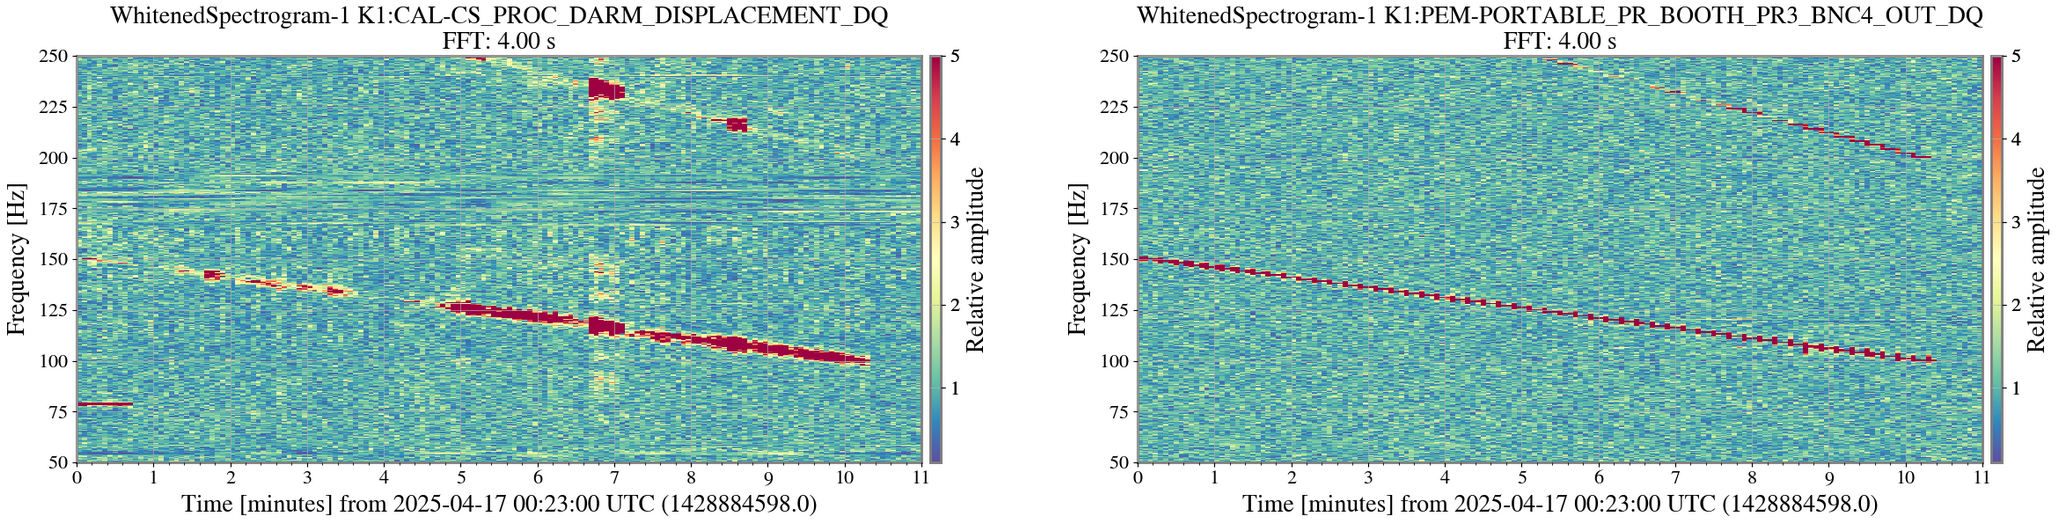
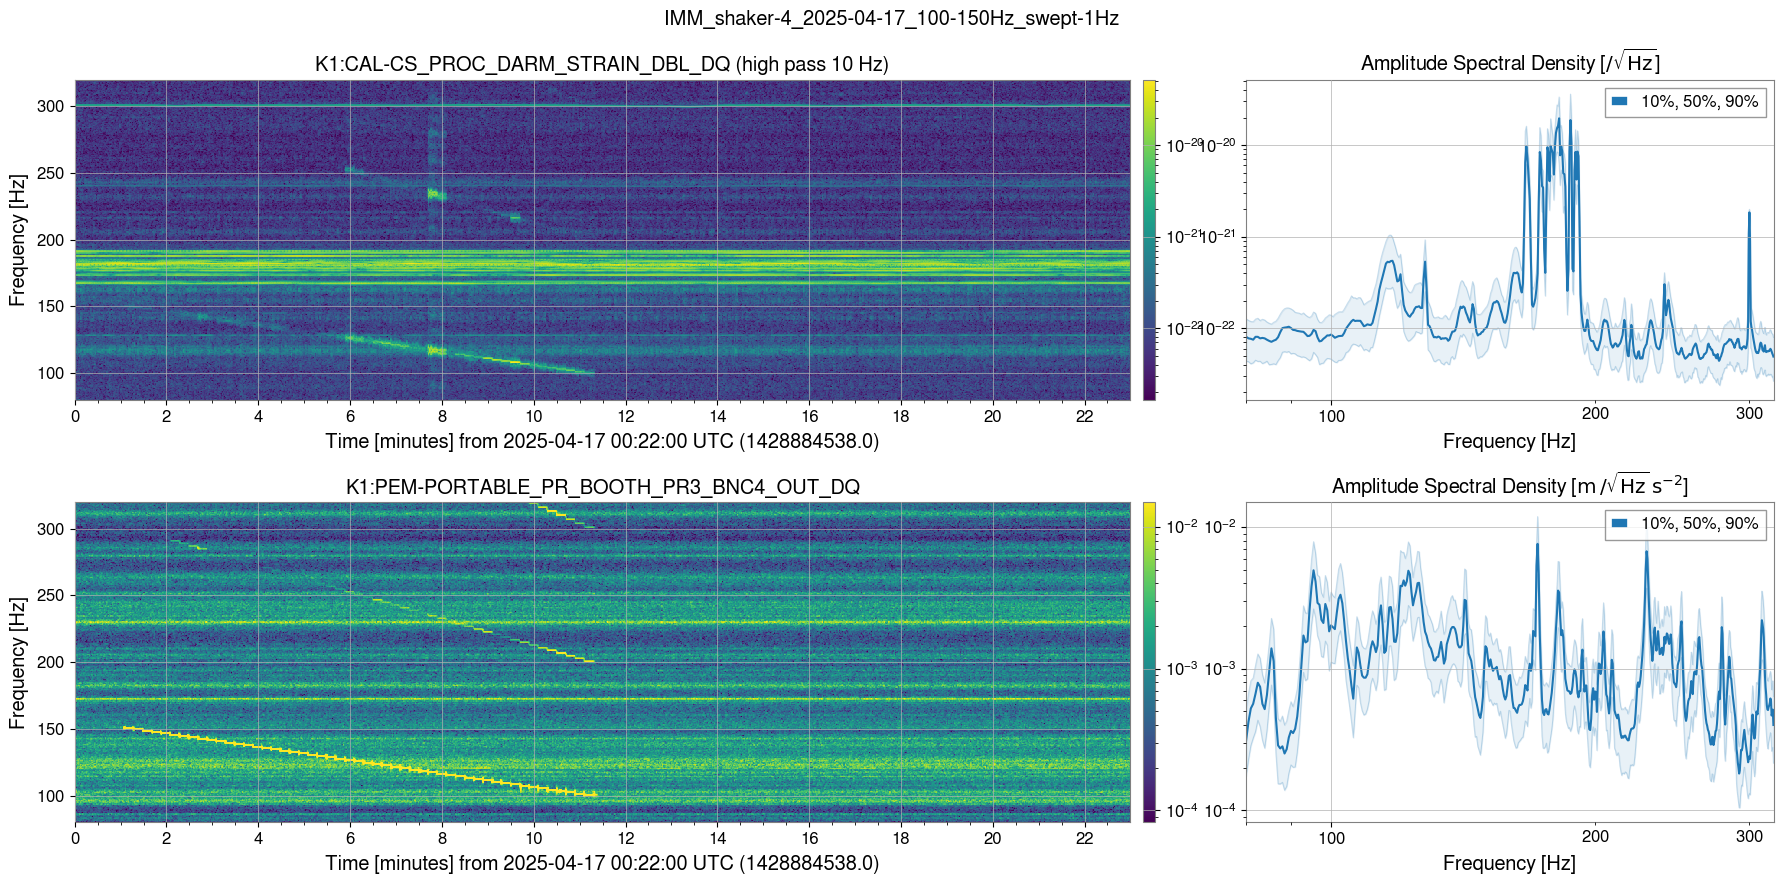
PEM injection using Saker #4 IMM shaker
2025/04/17 9:23:00 - 09:33:00
Excitation : K1:PEM-EXCITATION_MCF0_RACK_12_EXC
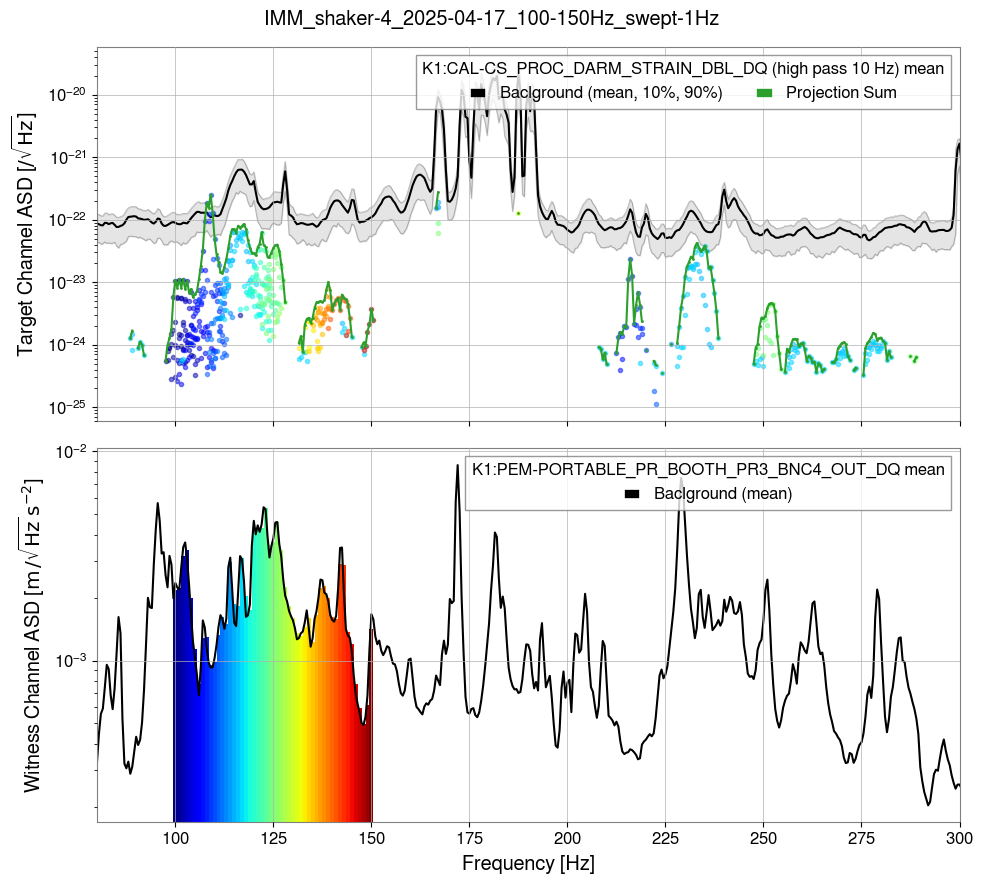
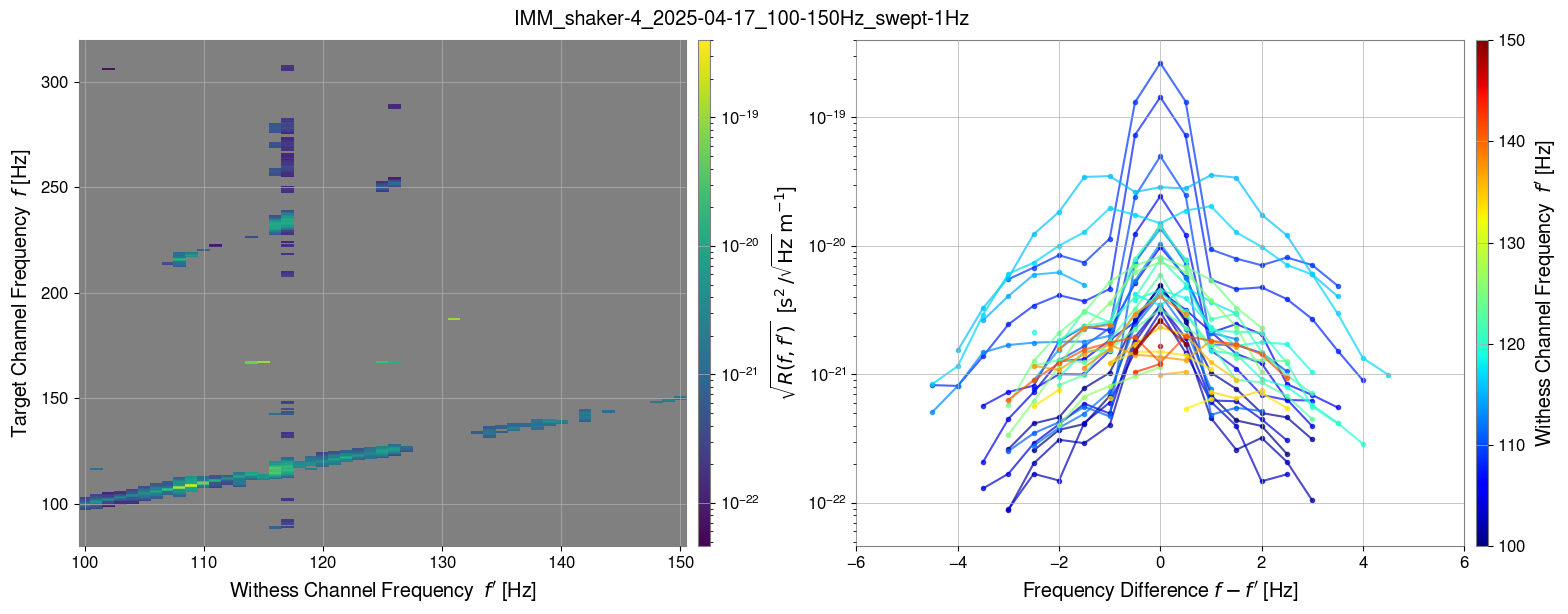
100 - 150 Hz , 1Hz resolution, 10 s in each measurement, 100 cnt
Fig.5. showed the result


Analysis for
PEM injection using Saker #3 IMM shaker
2025/04/17 5:20:00 - 05:55:00
Excitation : K1:PEM-EXCITATION_MCF0_RACK_11_EXC
50 - 900 Hz , 5Hz resolution, 10 s in each measurement, 100 cnt
Fig.1. showed the results, there are several linear coupling around 300 Hz, but not so large.
The projection result is very small.

Analysis for
PEM injection using Saker #4 IMM shaker
2025/04/17 5:55:00 - 06:22:00
Excitation : K1:PEM-EXCITATION_MCF0_RACK_12_EXC
50 - 900 Hz , 5Hz resolution, 10 s in each measurement, 100 cnt
During this measurement, lock loss happened
Fig.2. showed the result, several linear coupling can be seen below 400 Hz.
The projection result is very small.

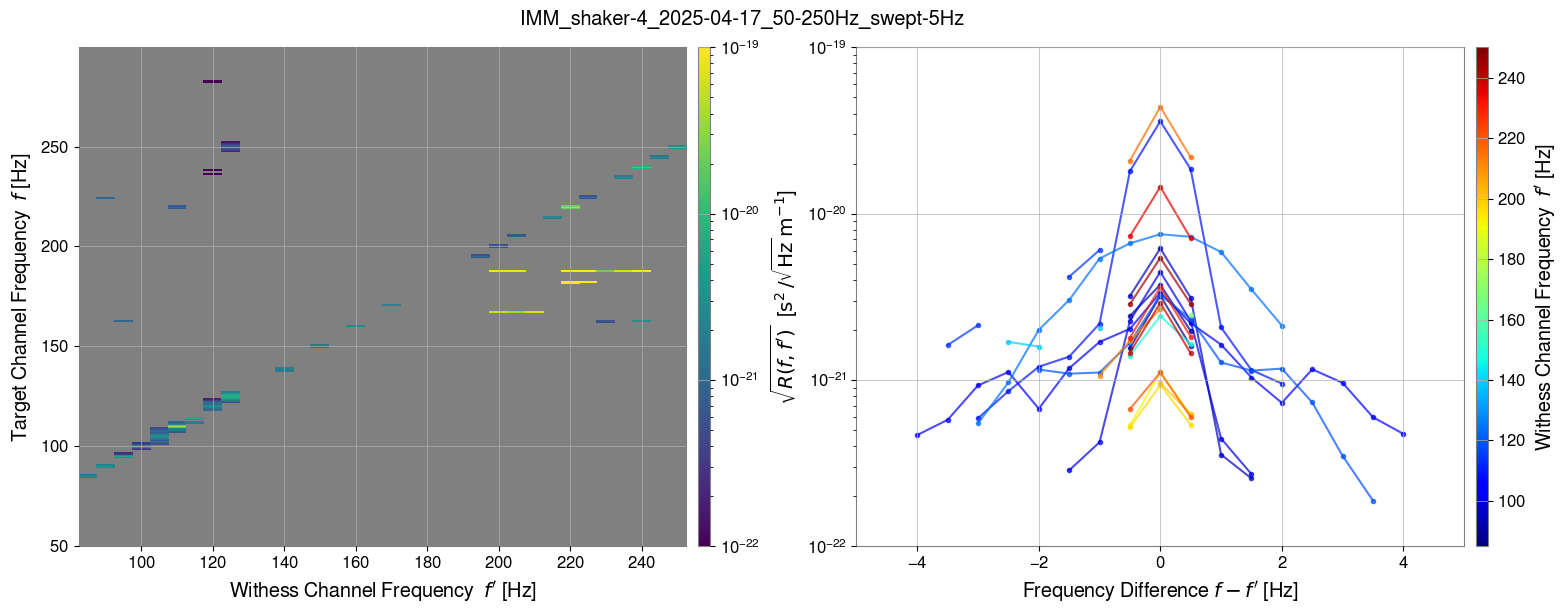
Analysis for
PEM injection using Saker #4 IMM shaker
2025/04/17 8:33:00 - 08:42:00
Excitation : K1:PEM-EXCITATION_MCF0_RACK_12_EXC
50 - 250 Hz , 5Hz resolution, 10 s in each measurement, 100 cnt
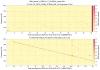
Fig.3. showed the result, one large glitch around 7 min, I will investigate later.
Here, the noisier time (injection frequency <80Hz) is removed from the analysis.

Analysis for
PEM injection using Saker #3 IMM shaker
2025/04/17 8:42:00 - 09:22:00
Excitation : K1:PEM-EXCITATION_MCF0_RACK_11_EXC
100 - 300 Hz , 1Hz resolution, 10 s in each measurement, 100 cnt
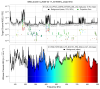
Fig.4. showed the result, there are several linear coupling 200 - 300 Hz
The projected noise is about 2-orders below.


Analysis for
PEM injection using Saker #4 IMM shaker
2025/04/17 9:23:00 - 09:33:00
Excitation : K1:PEM-EXCITATION_MCF0_RACK_12_EXC
100 - 150 Hz , 1Hz resolution, 10 s in each measurement, 100 cnt
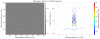
Fig.5. showed the result
The projected noise spectrum shape around 116 Hz is similar to the current sensitivity, but its amplitude is smaller.

