D. Chen, Komori, Ushiba, Akutsu
Abstract
Have successfully reduced the vibration features caused by the STM2 structure. Let's see how this will improve the sensitivity of the interferometer.
Details
For a long time, the 127 Hz peak in DARM had been a concern, and a coherent peak was also observed in the IMMT1T QPDs. Since then, several investigations have been conducted, suggesting that the origin of the peak is related to the STM2 structure (see the presentation file in JGW-G2516553). According to the strategy outlined in the txt files in JGW-G2516553, we carried out the following actions.
Preparation
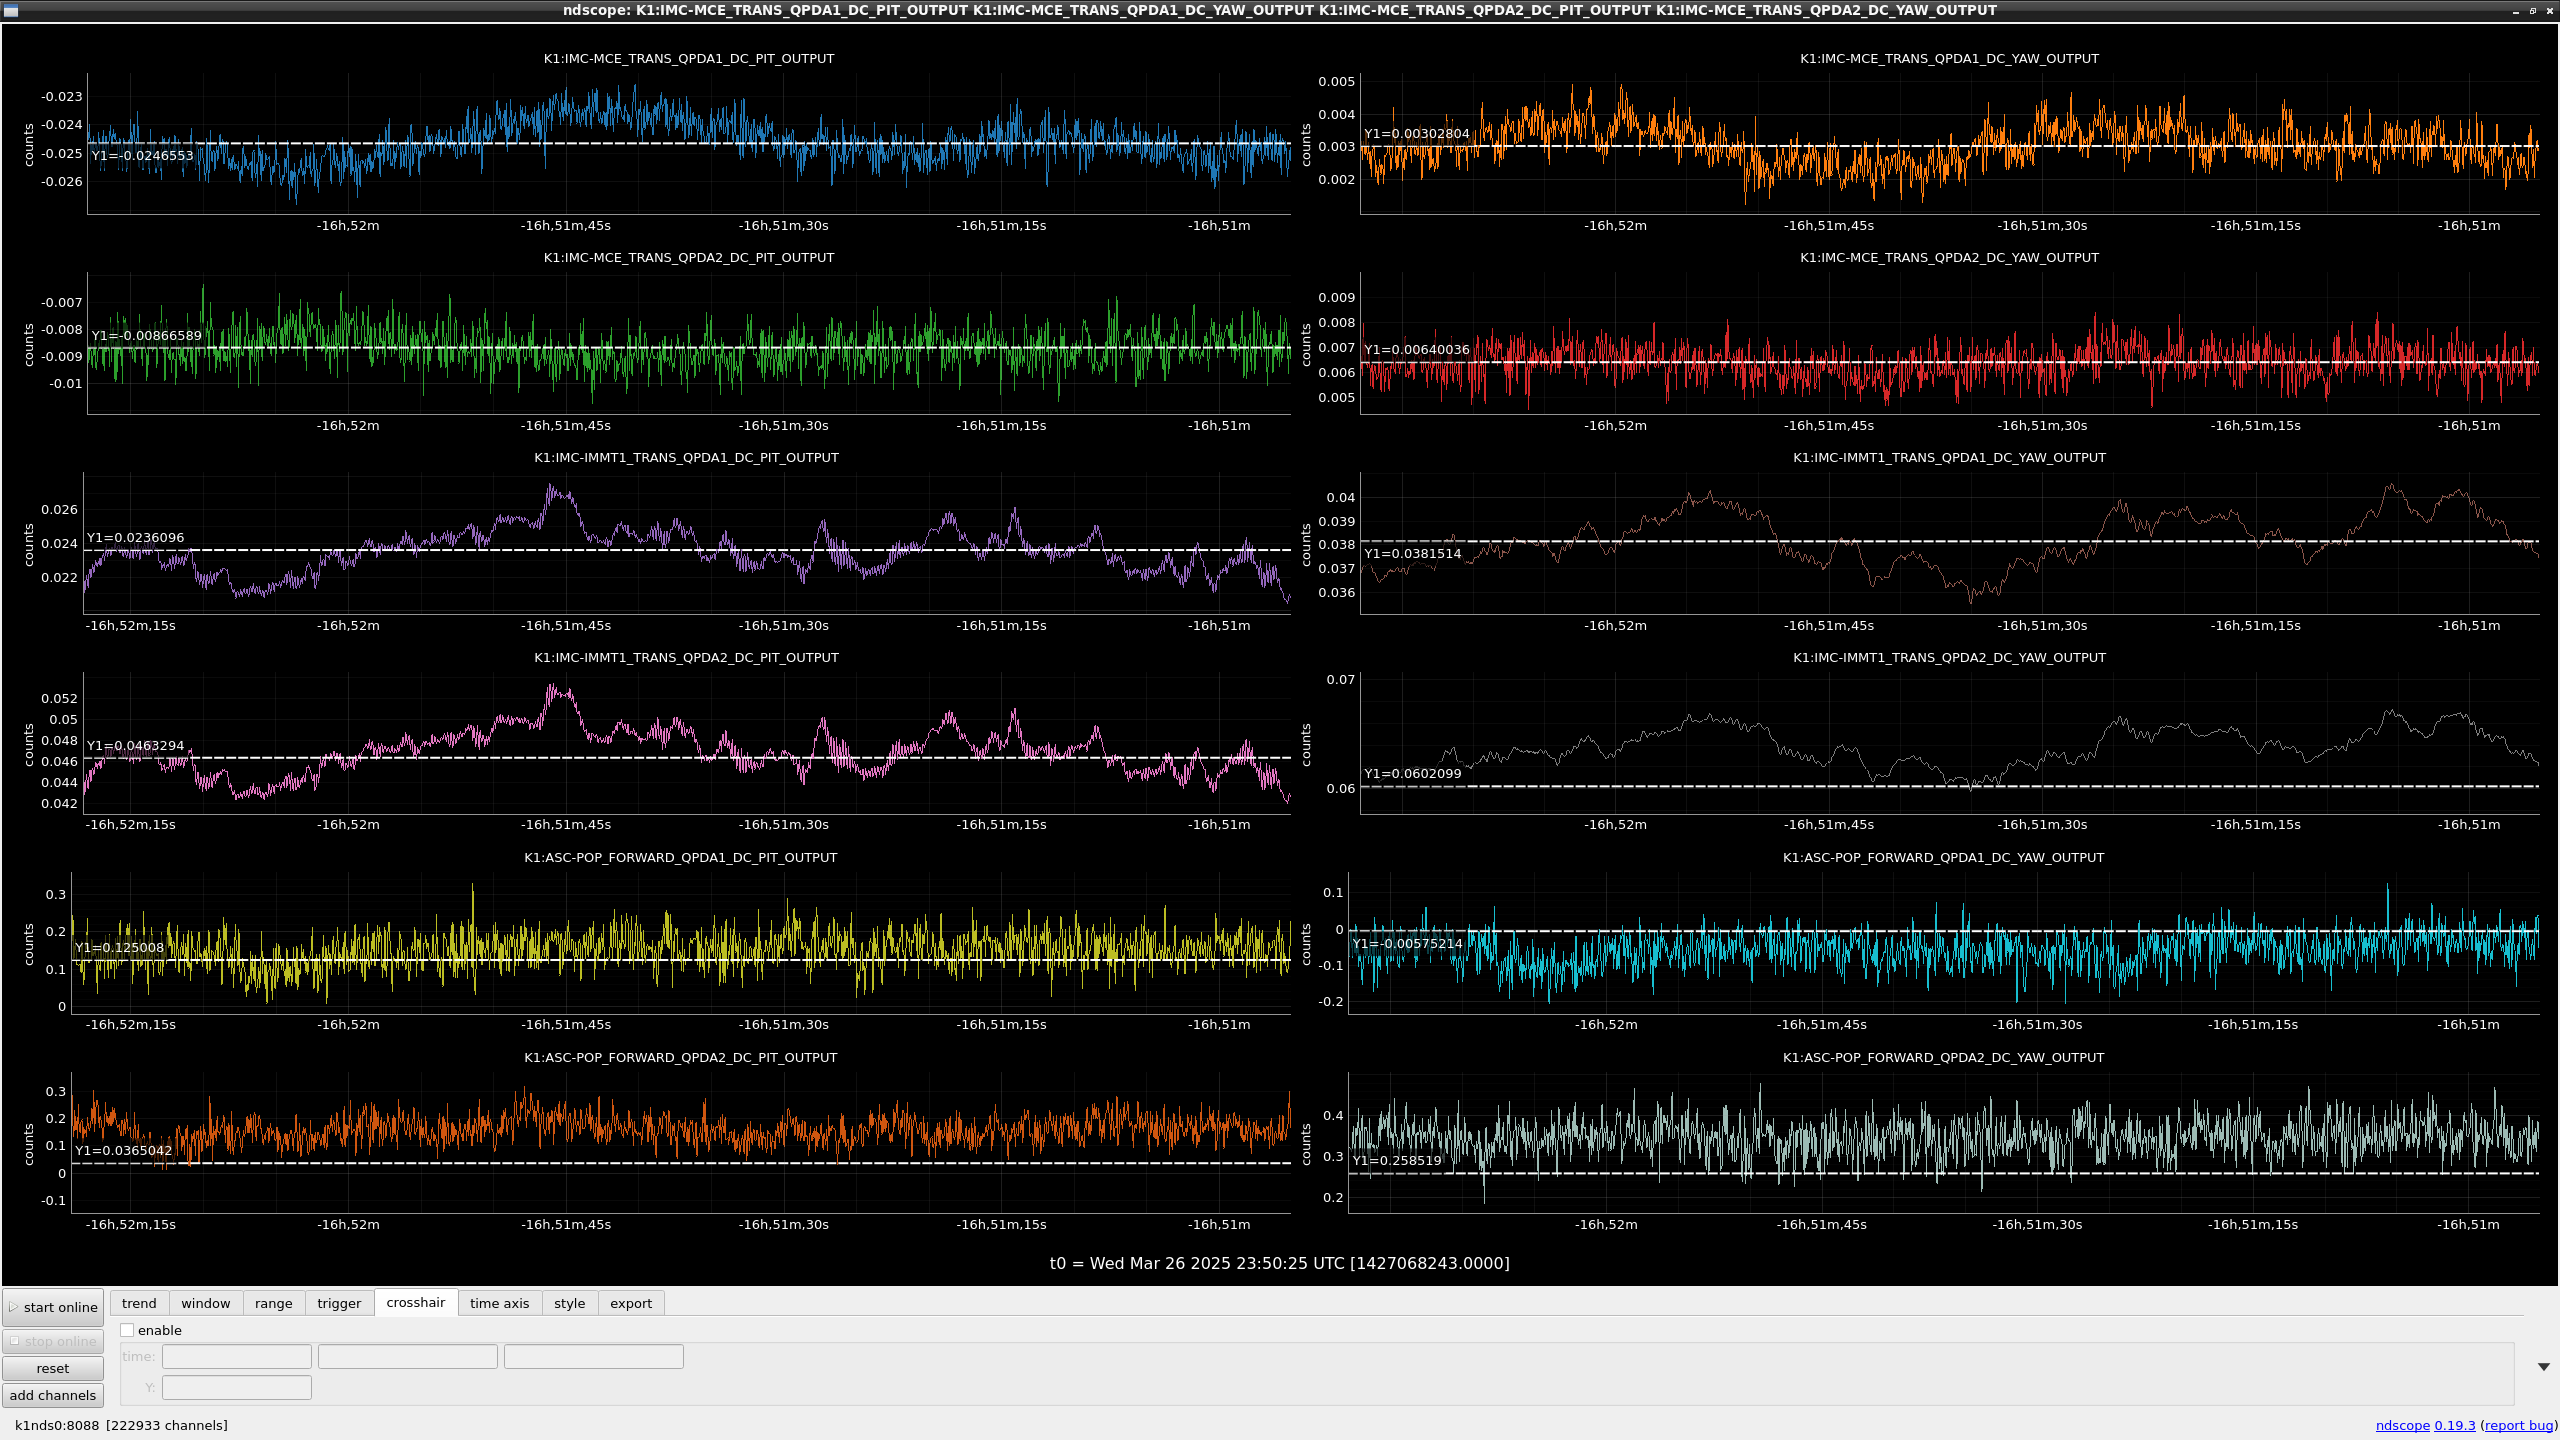
As usual, IMC-ASC control loops were disabled to prevent instability when occasionally shutting off the laser beam. Also, IMMT2 oplev control was paused. IMMT1T QPDA{1,2} PIT and YAW as well as SUM were continously monitored as much as possible with care. When necessary, POP_FORWARD QPDs were checked. IMMT1T QPDA2 PIT and YAW spectra were also monitored to observe the behaviors of the vibration features.
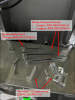
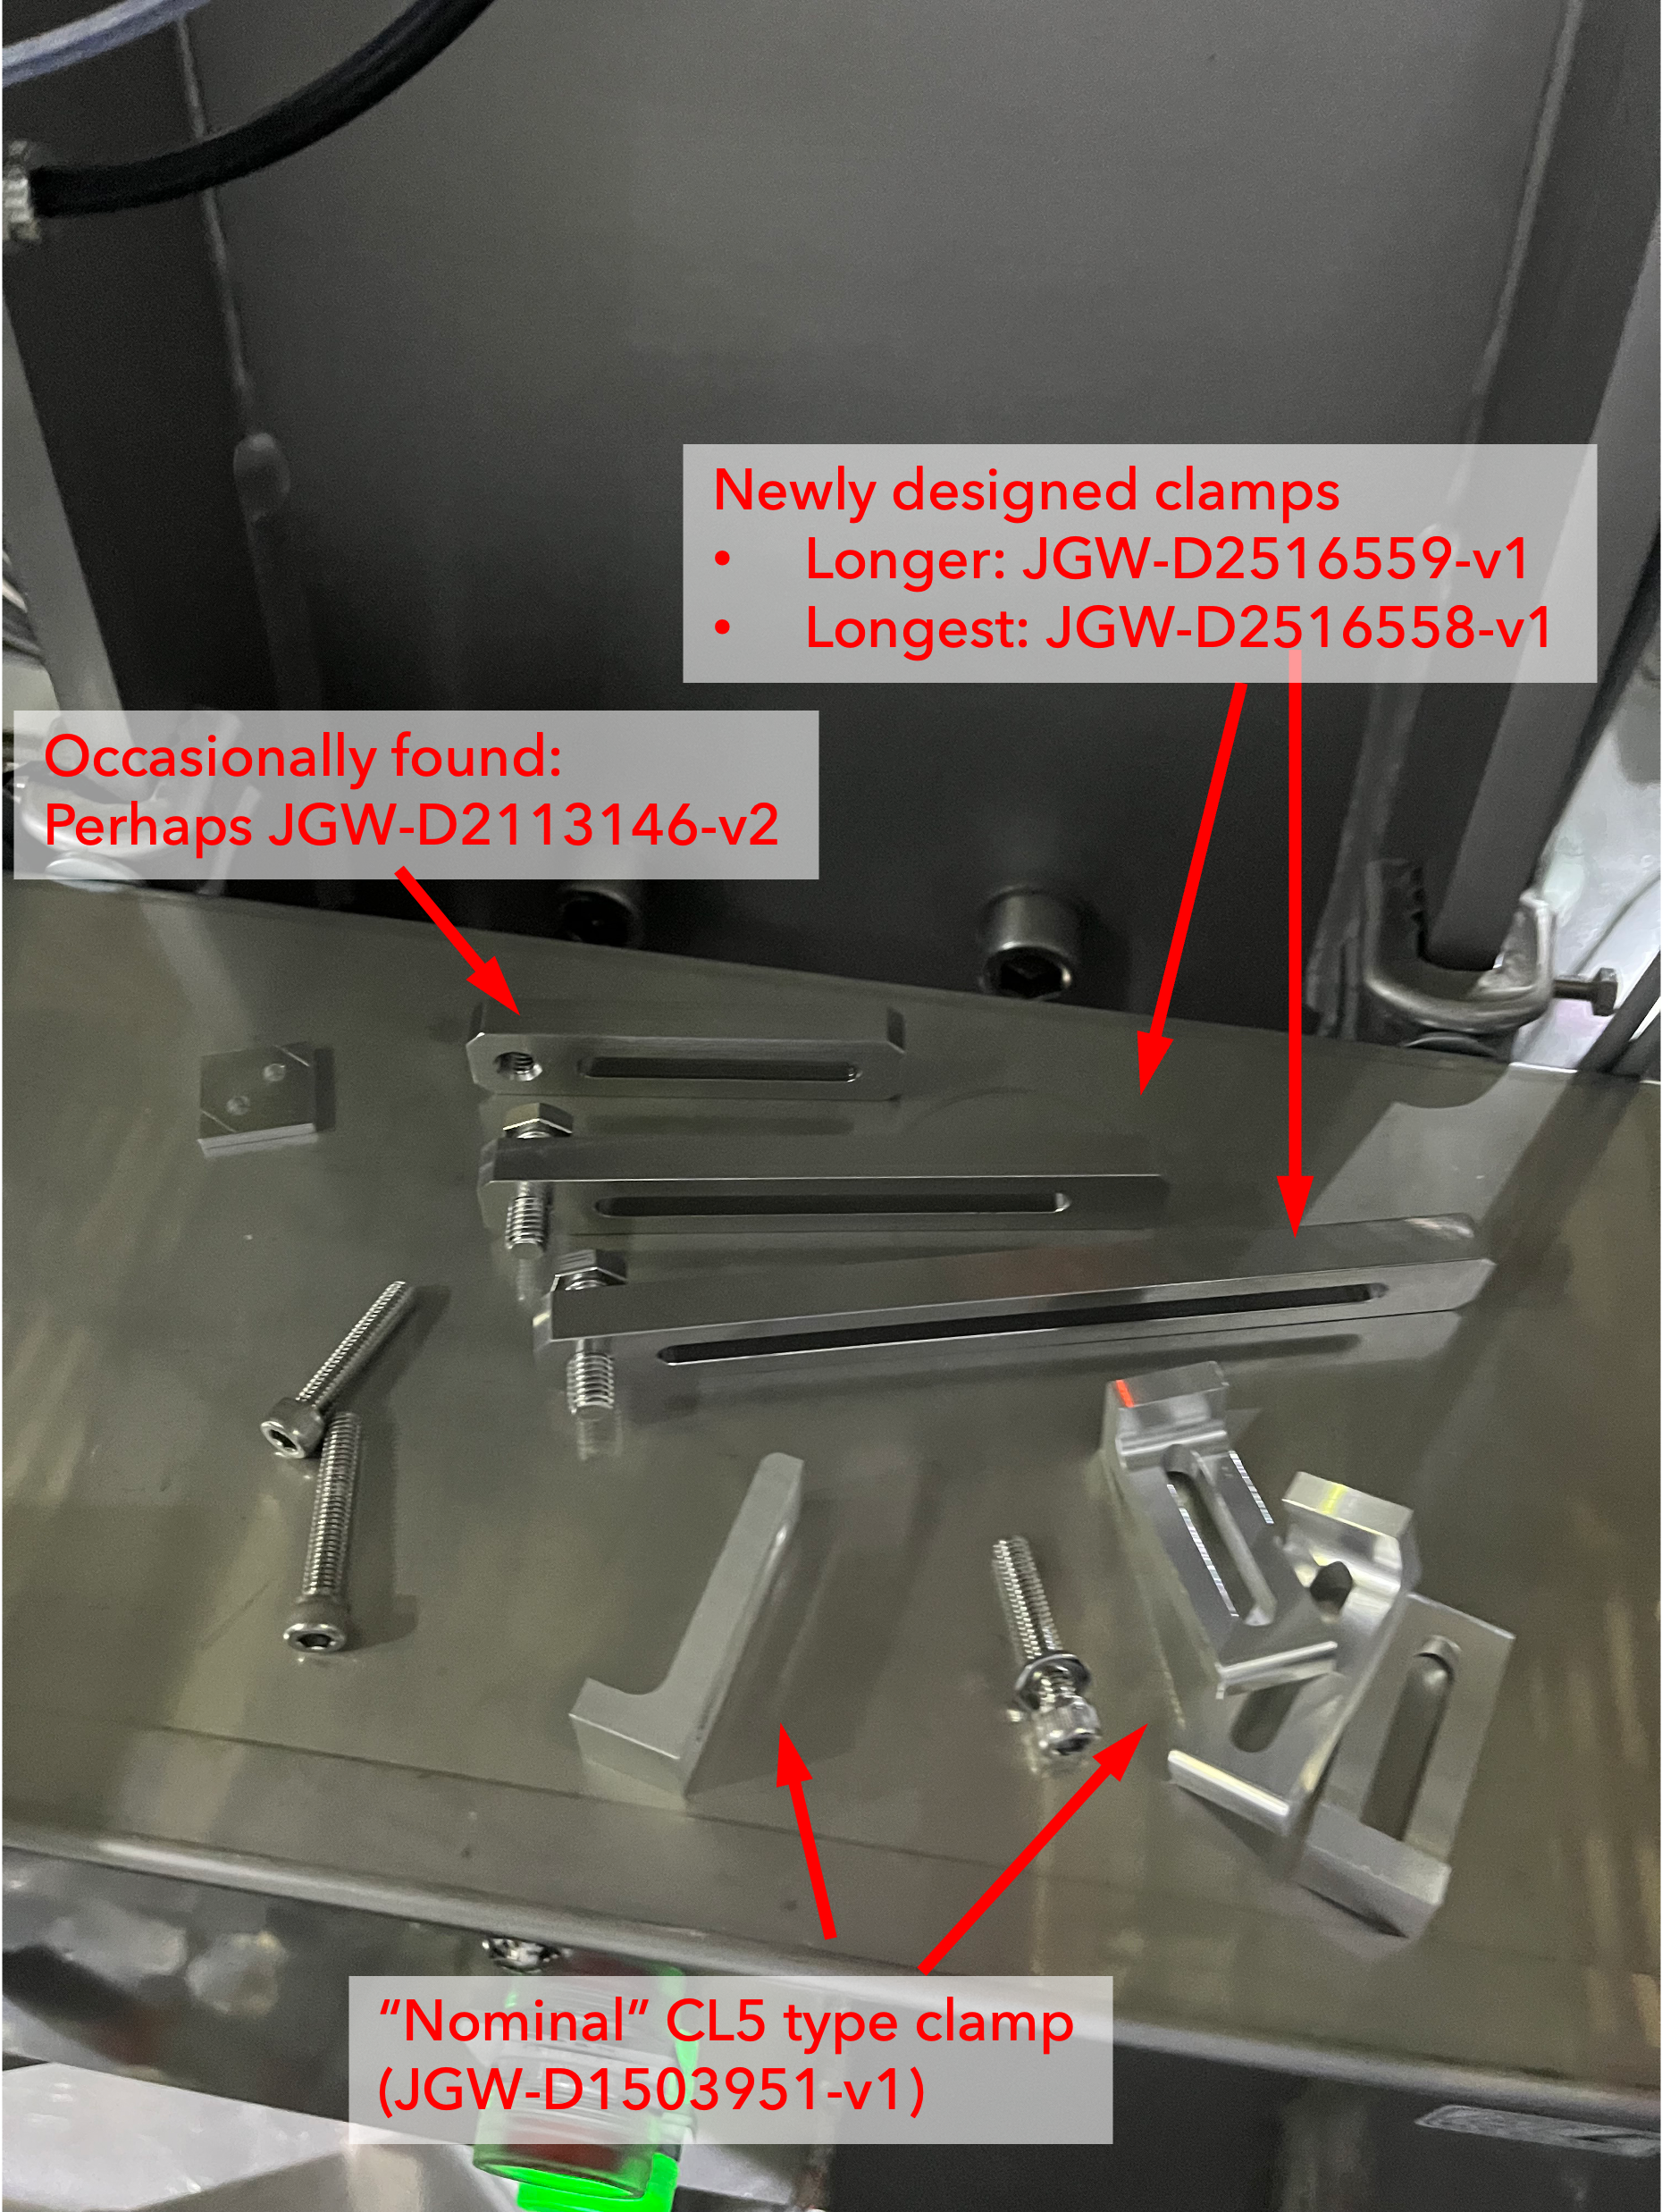
Re-arranging the clamps
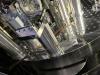
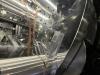
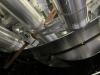
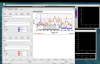
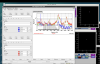
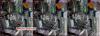
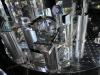
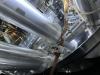
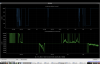
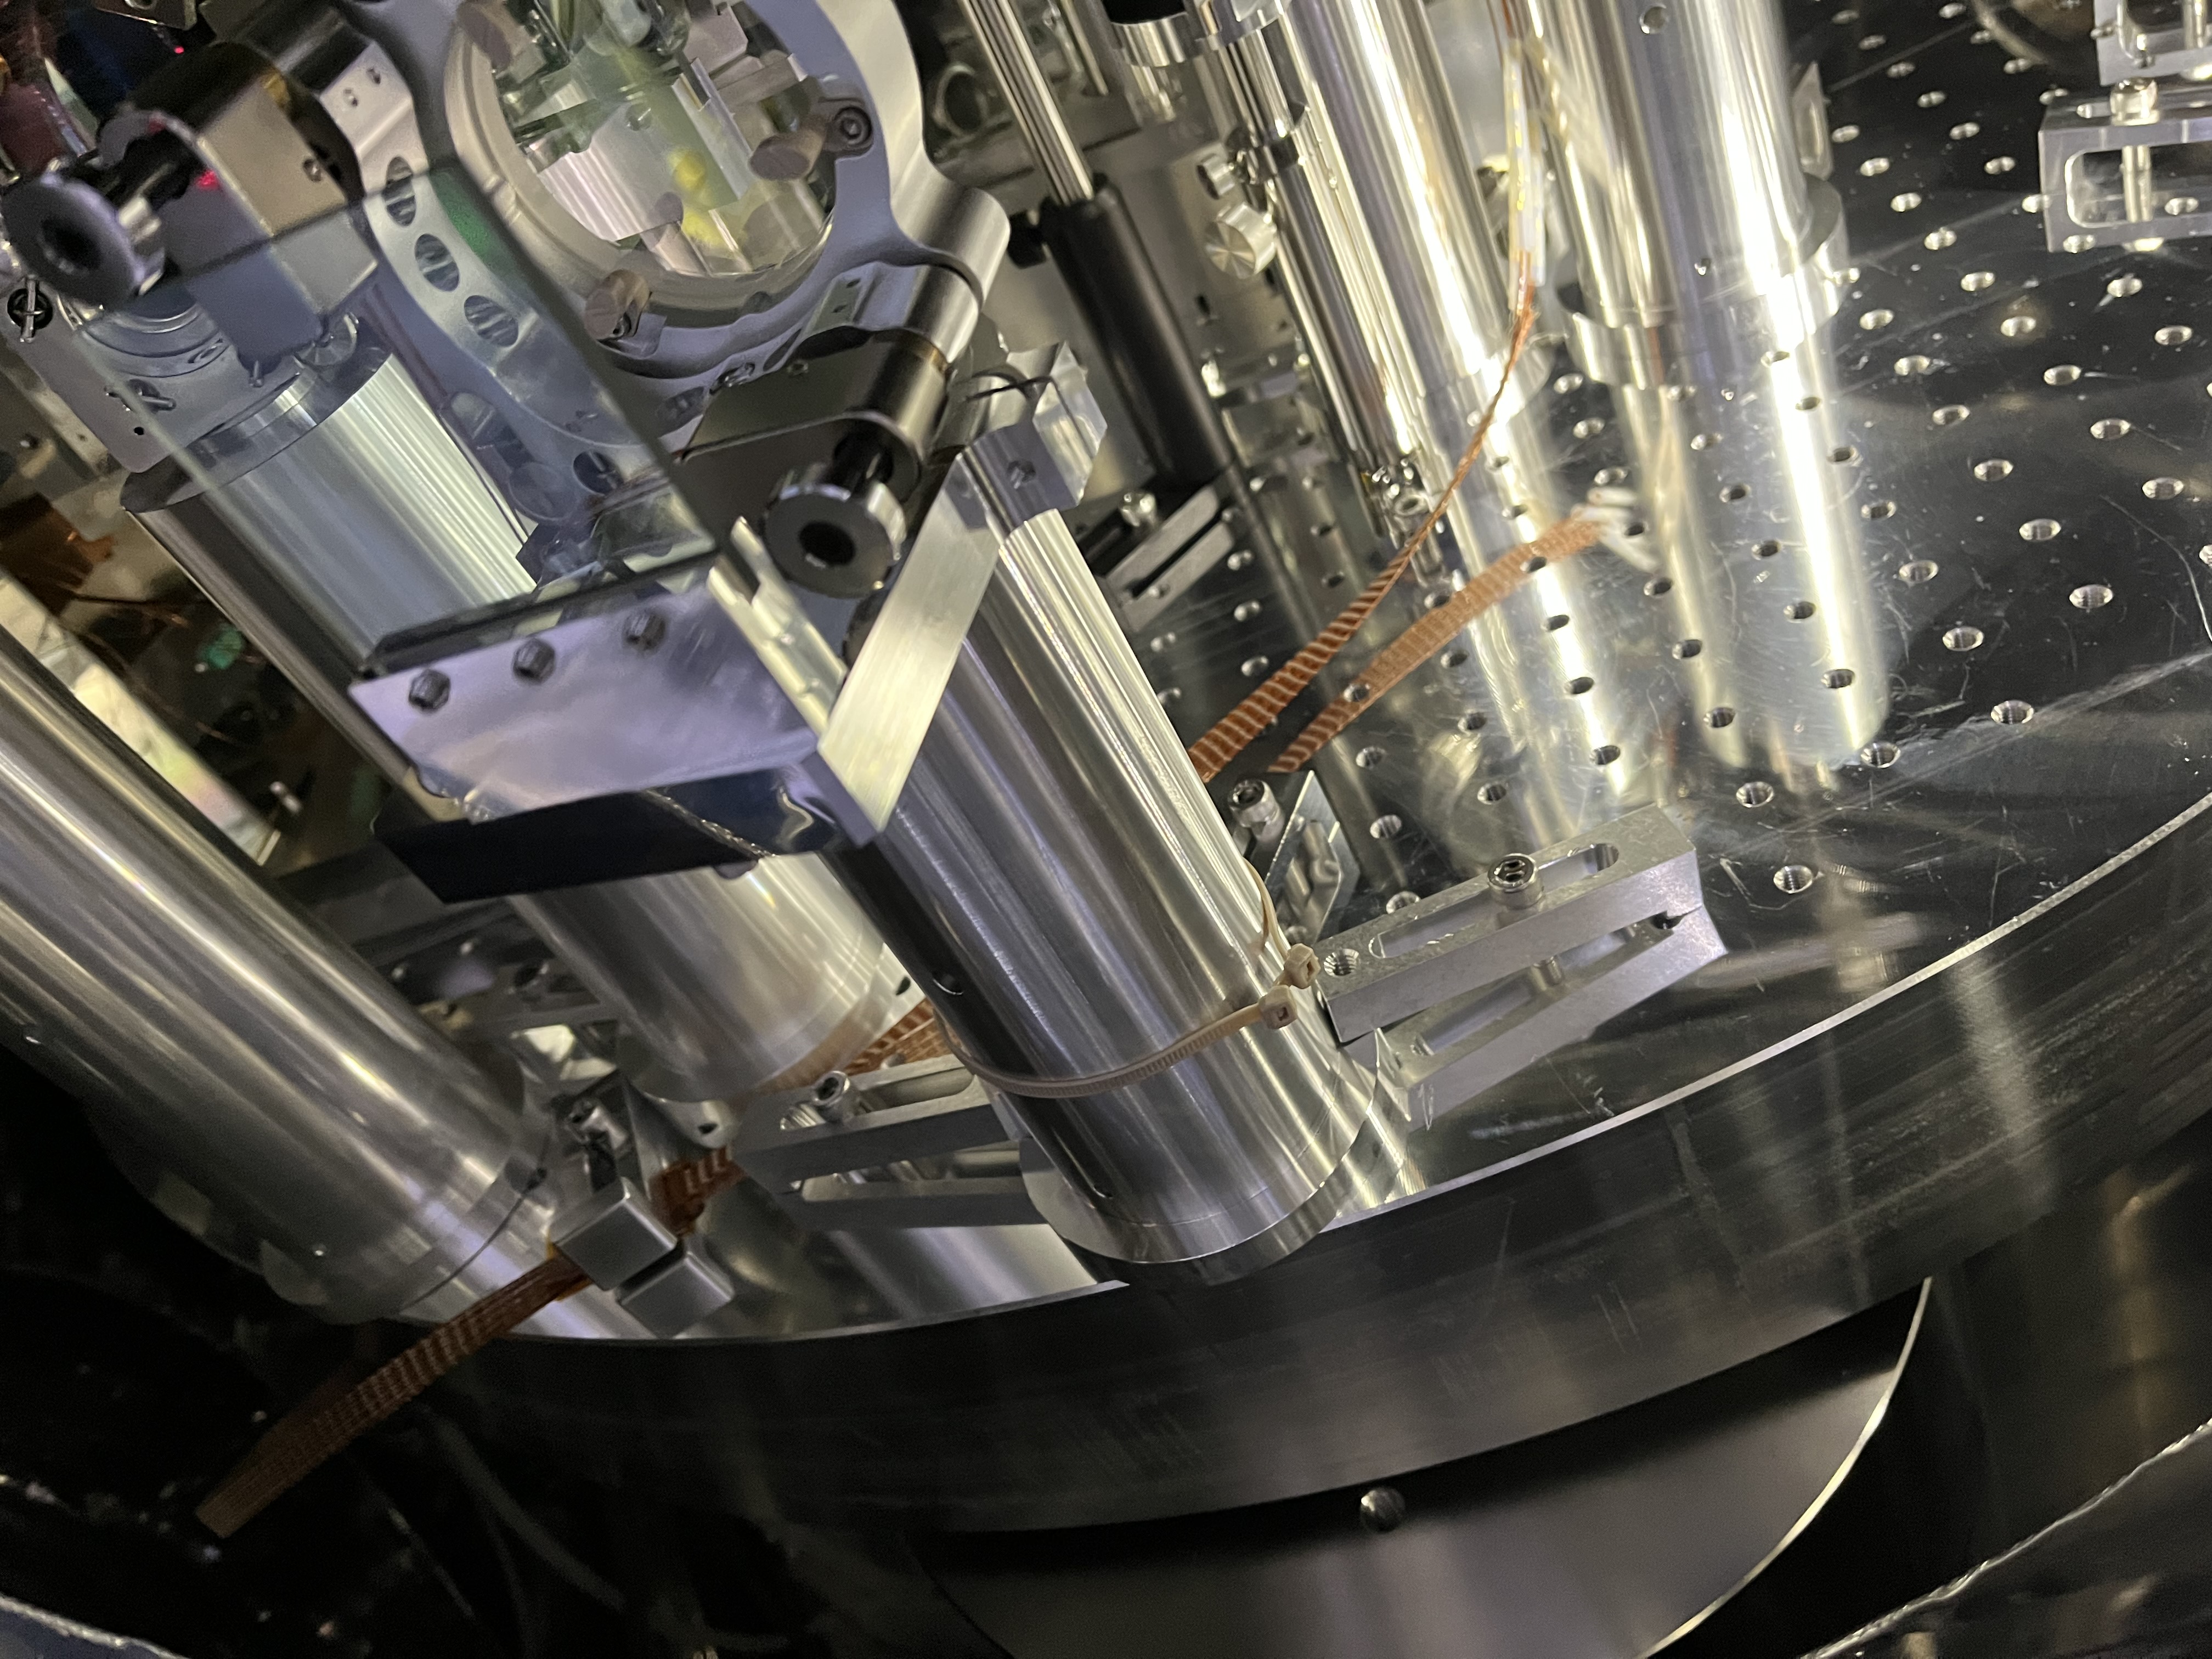
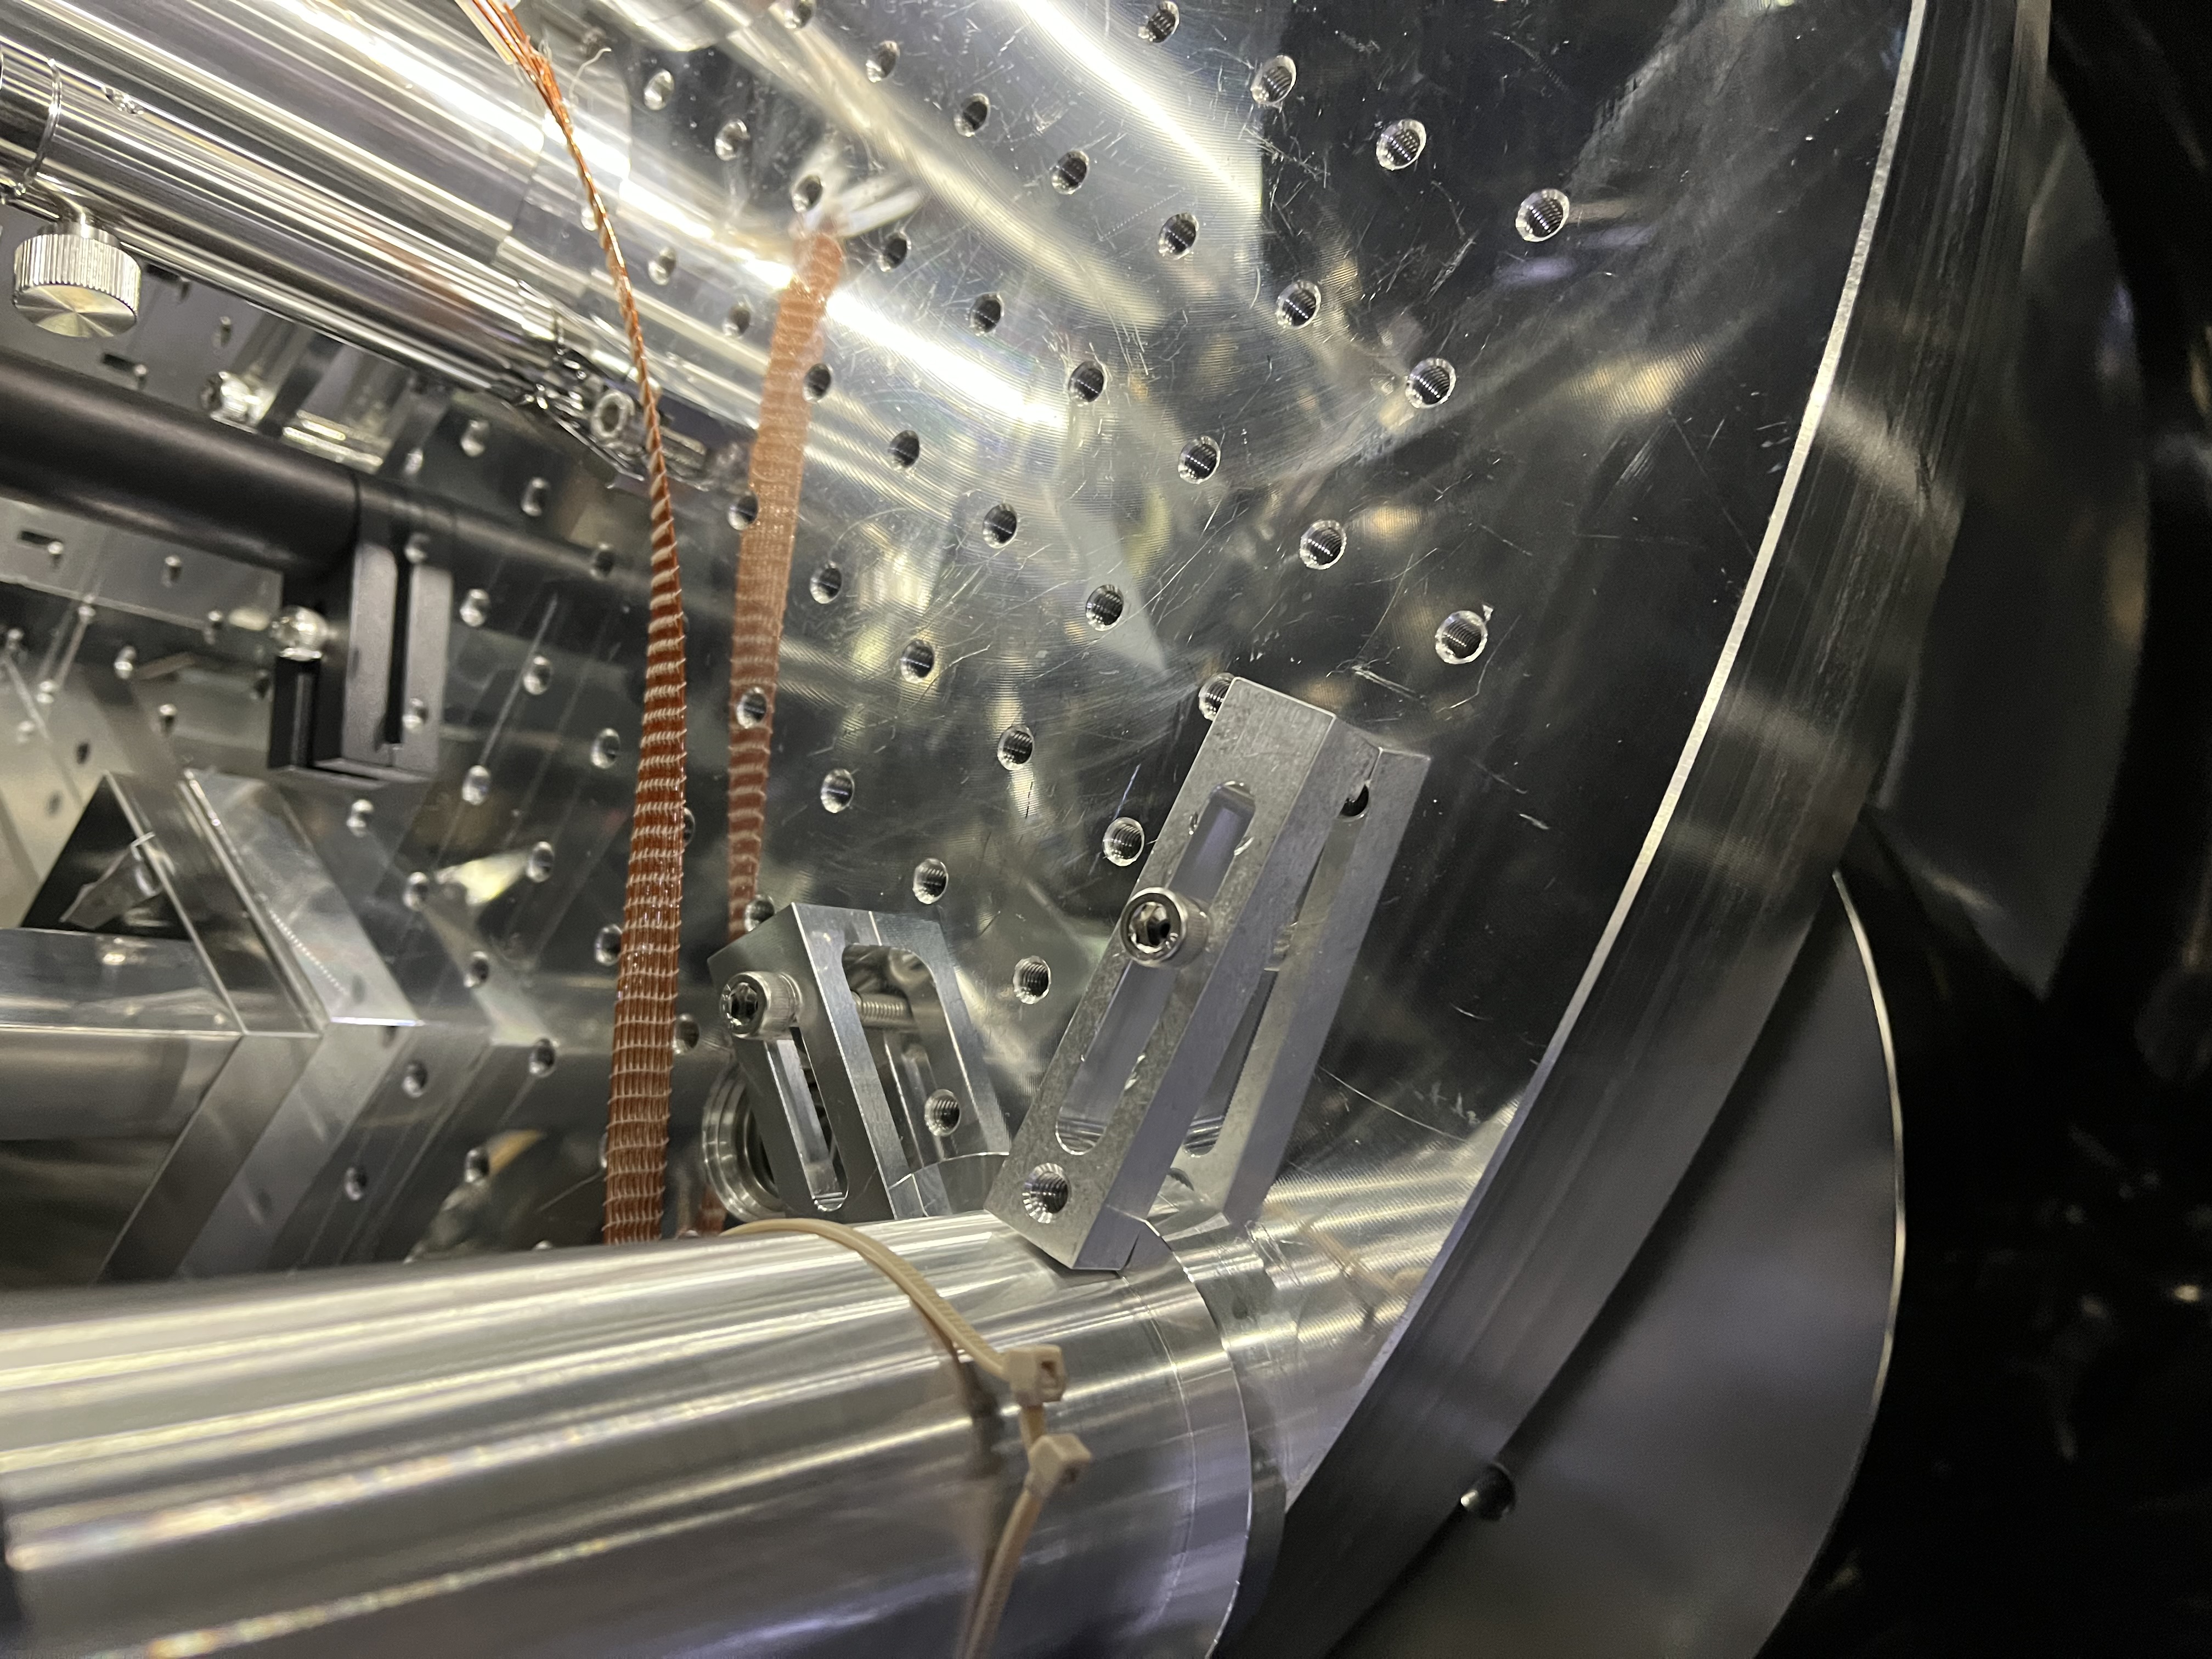
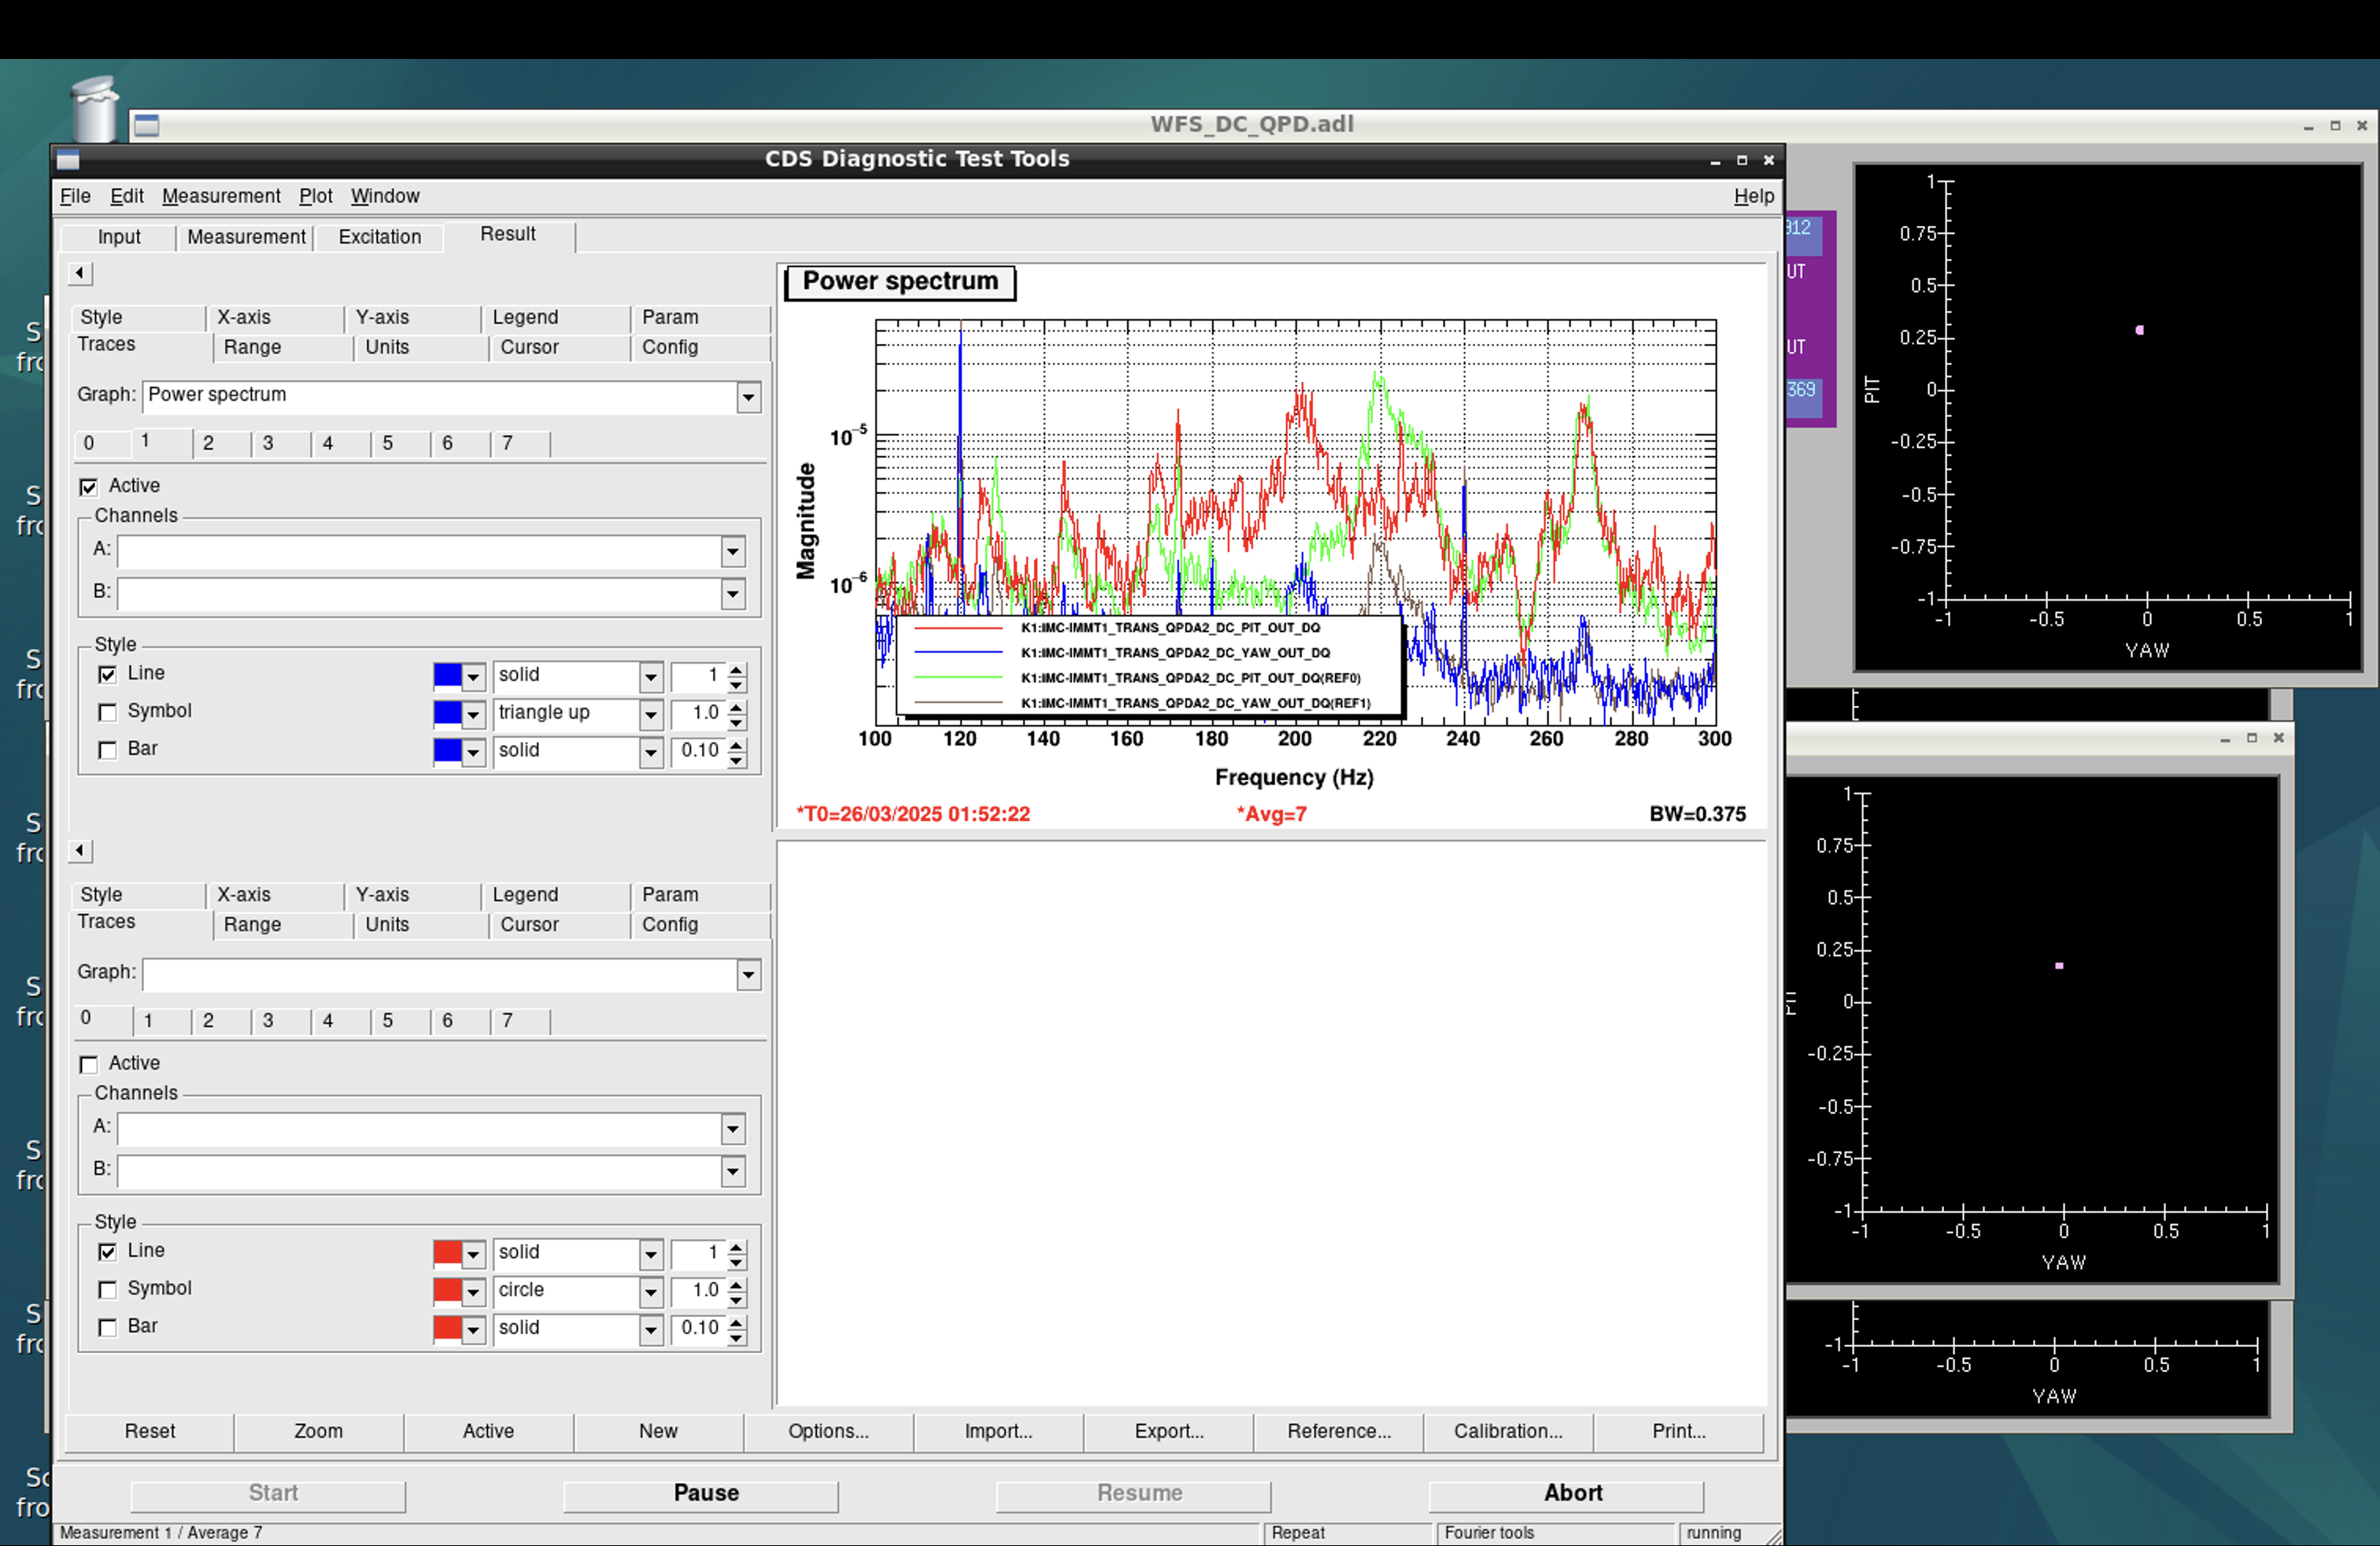
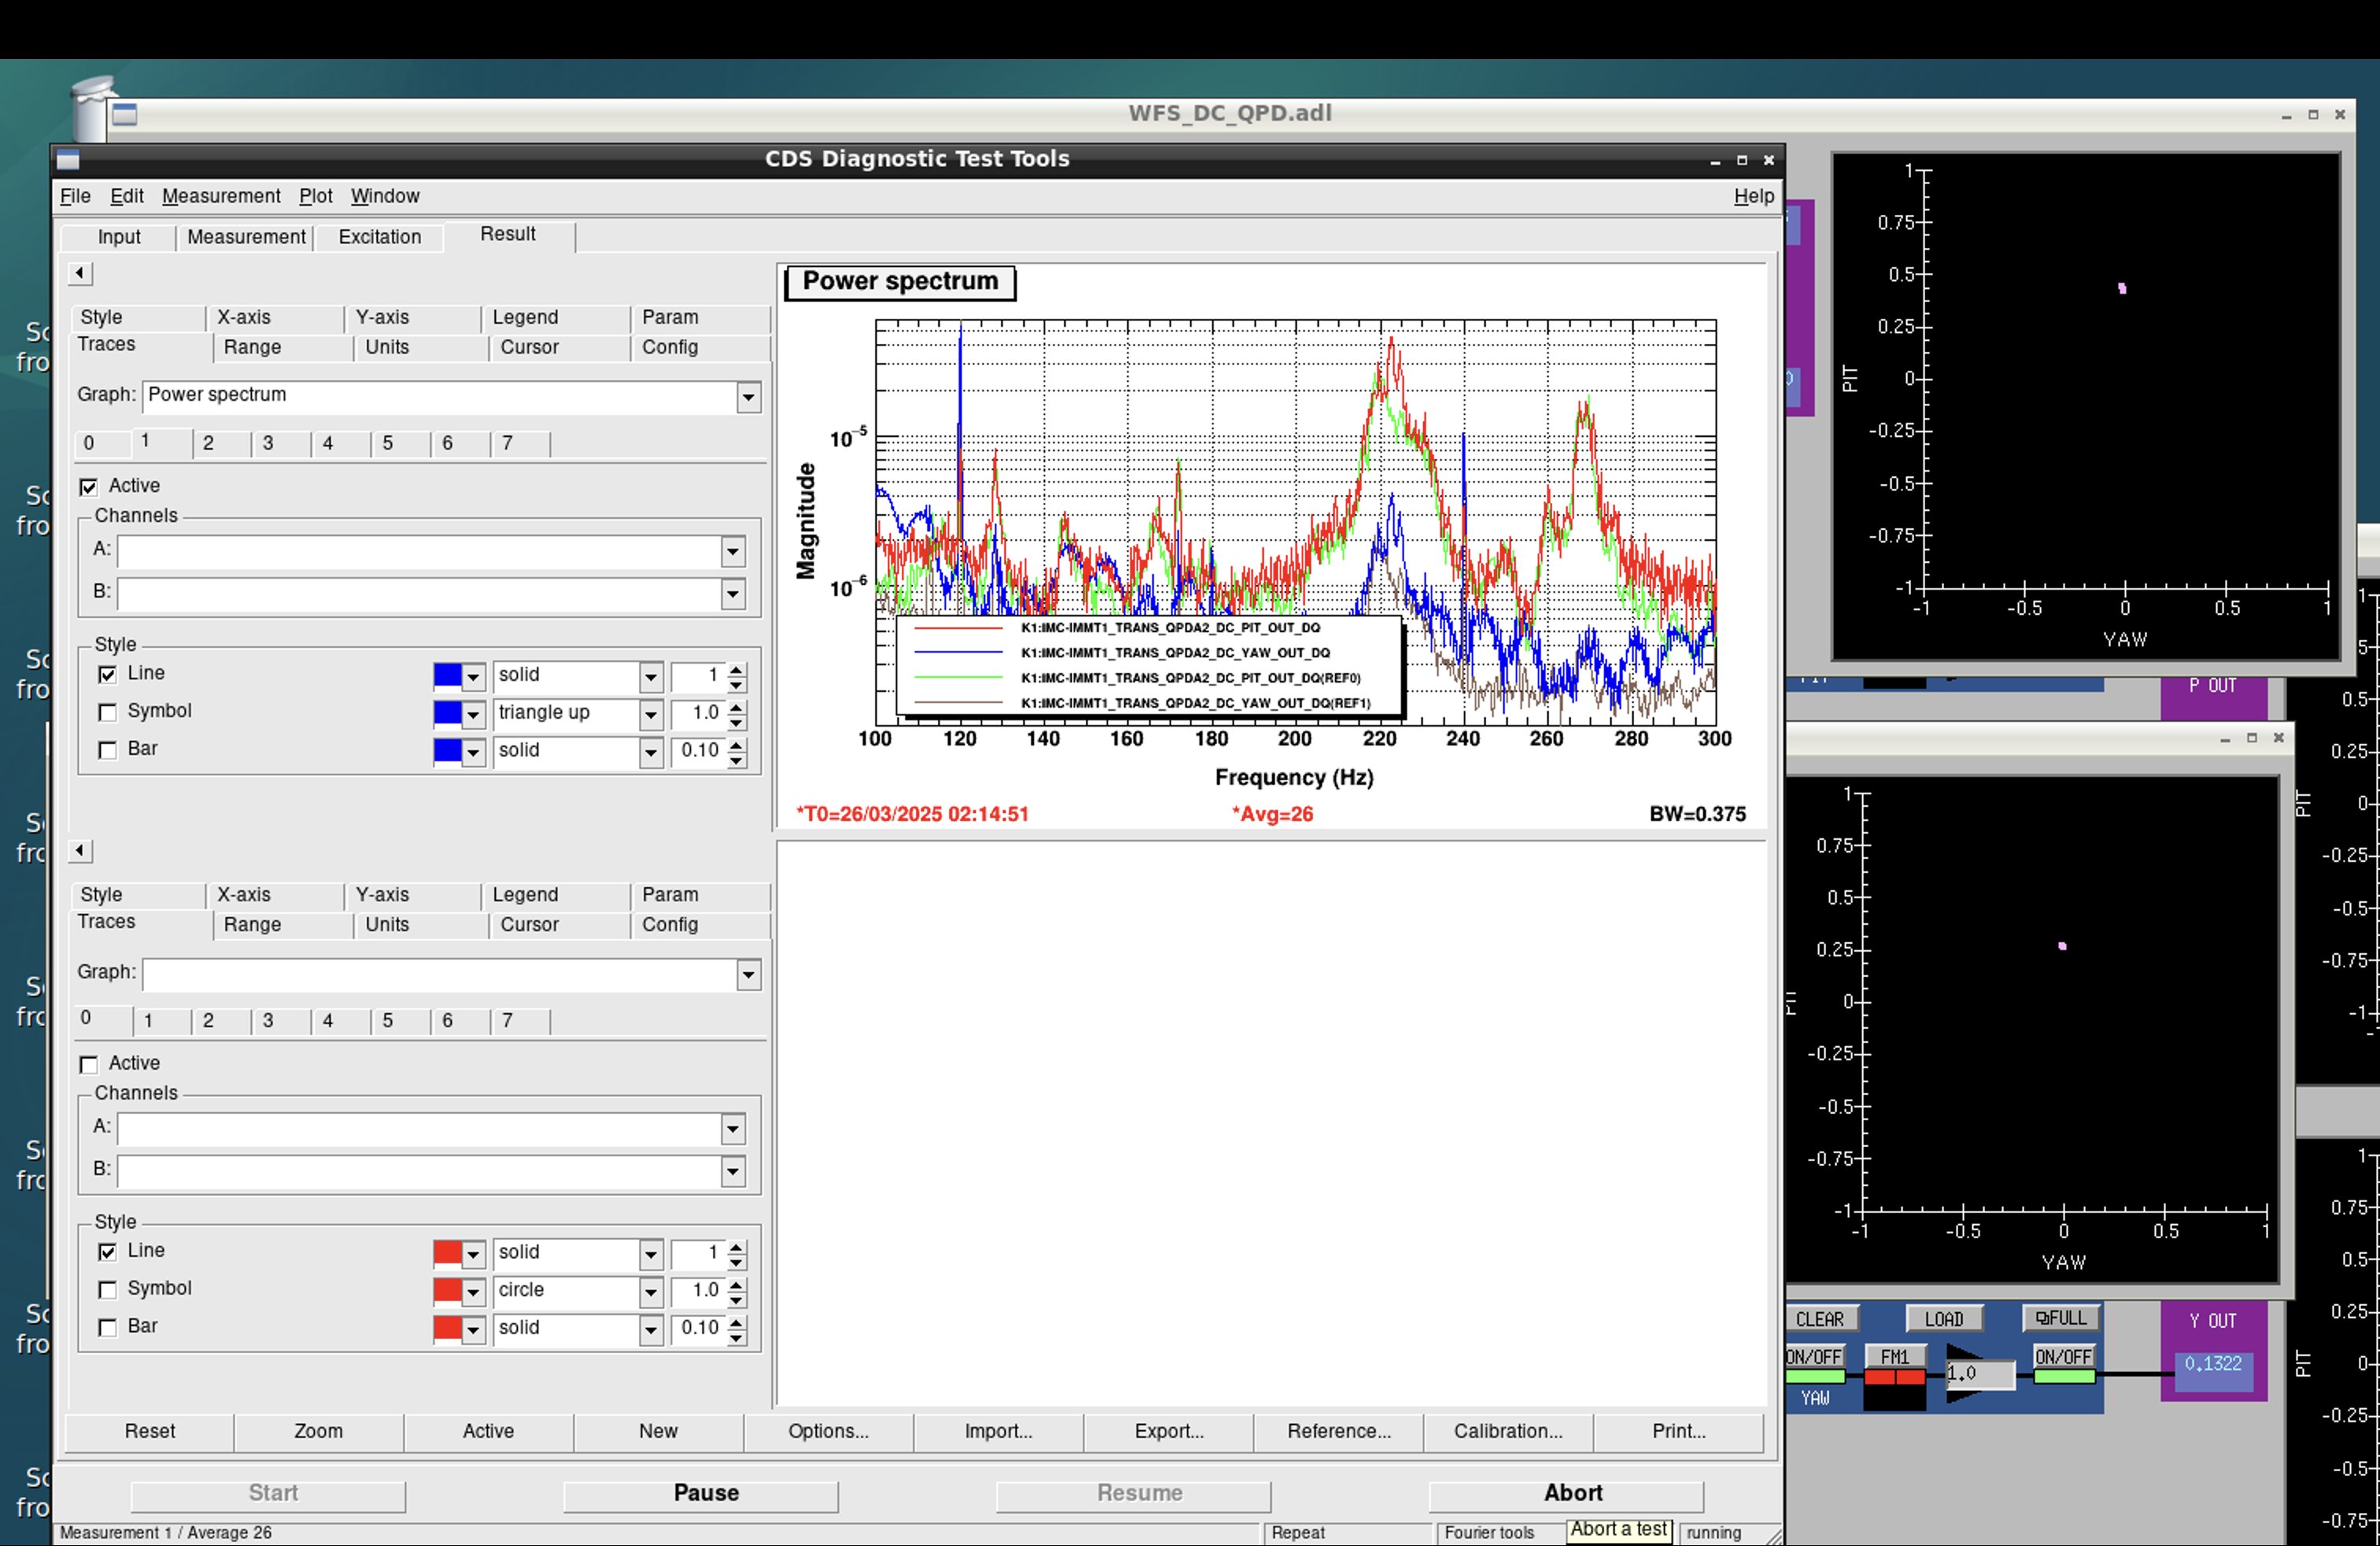
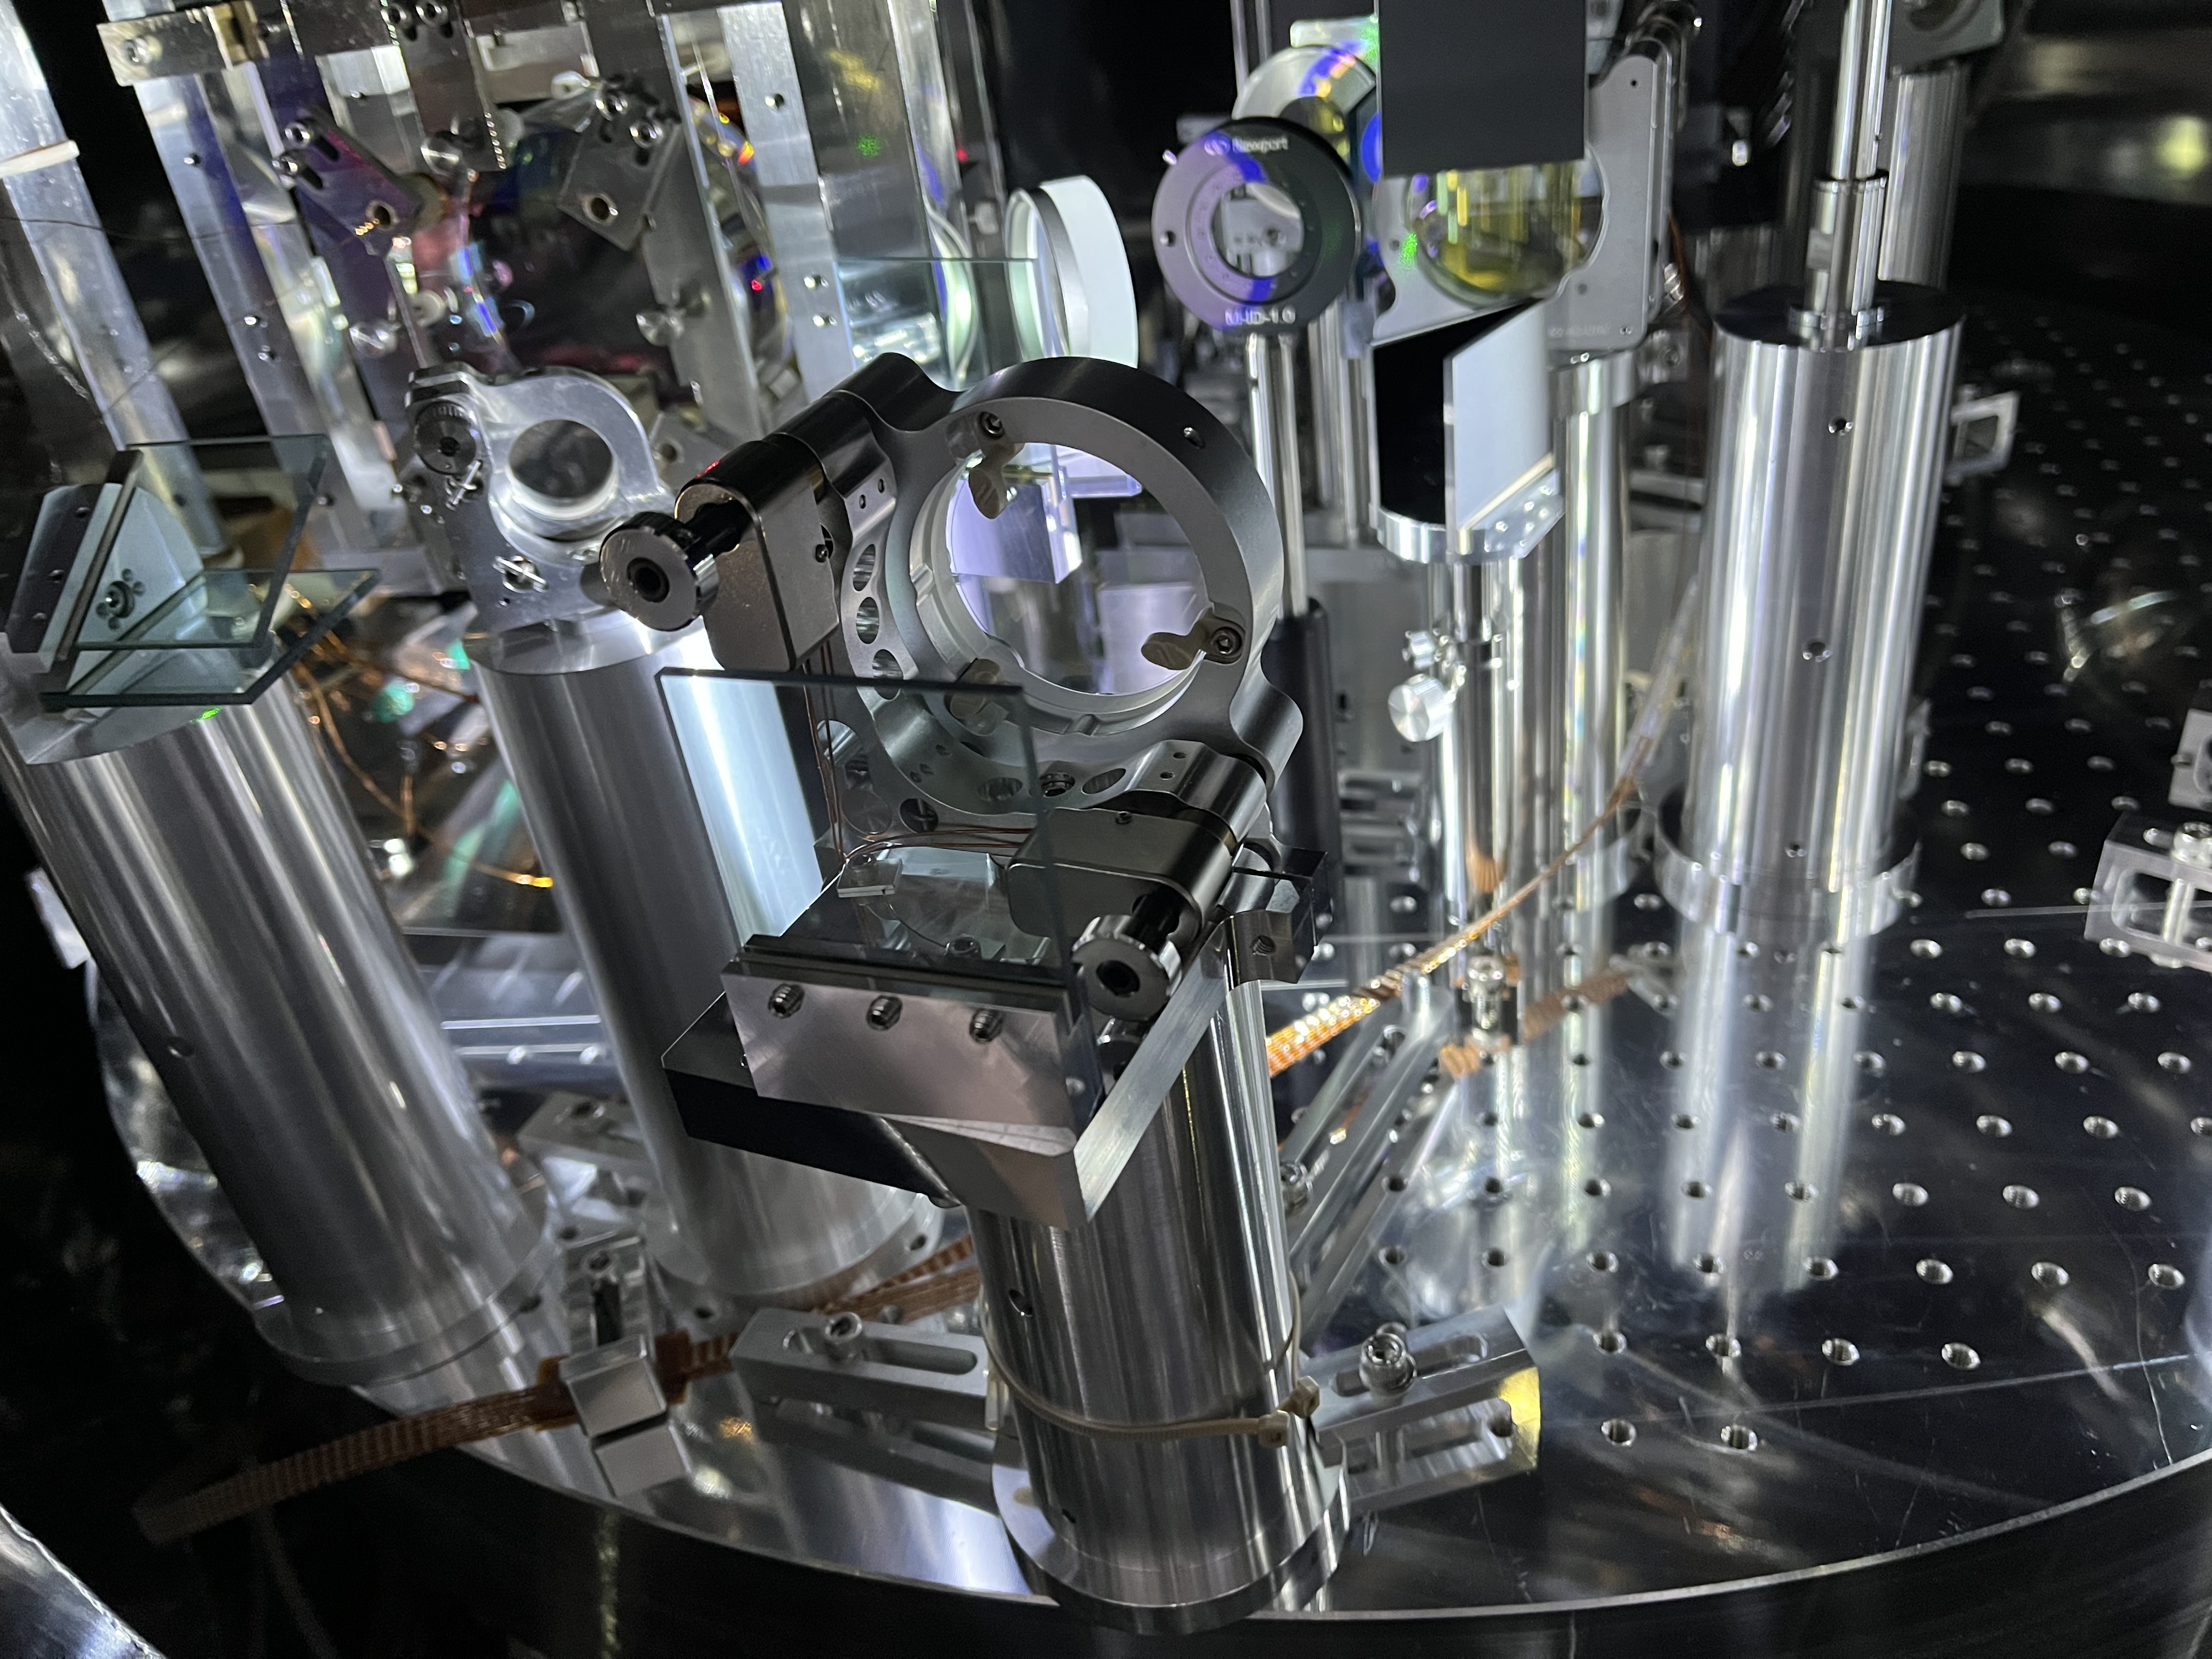
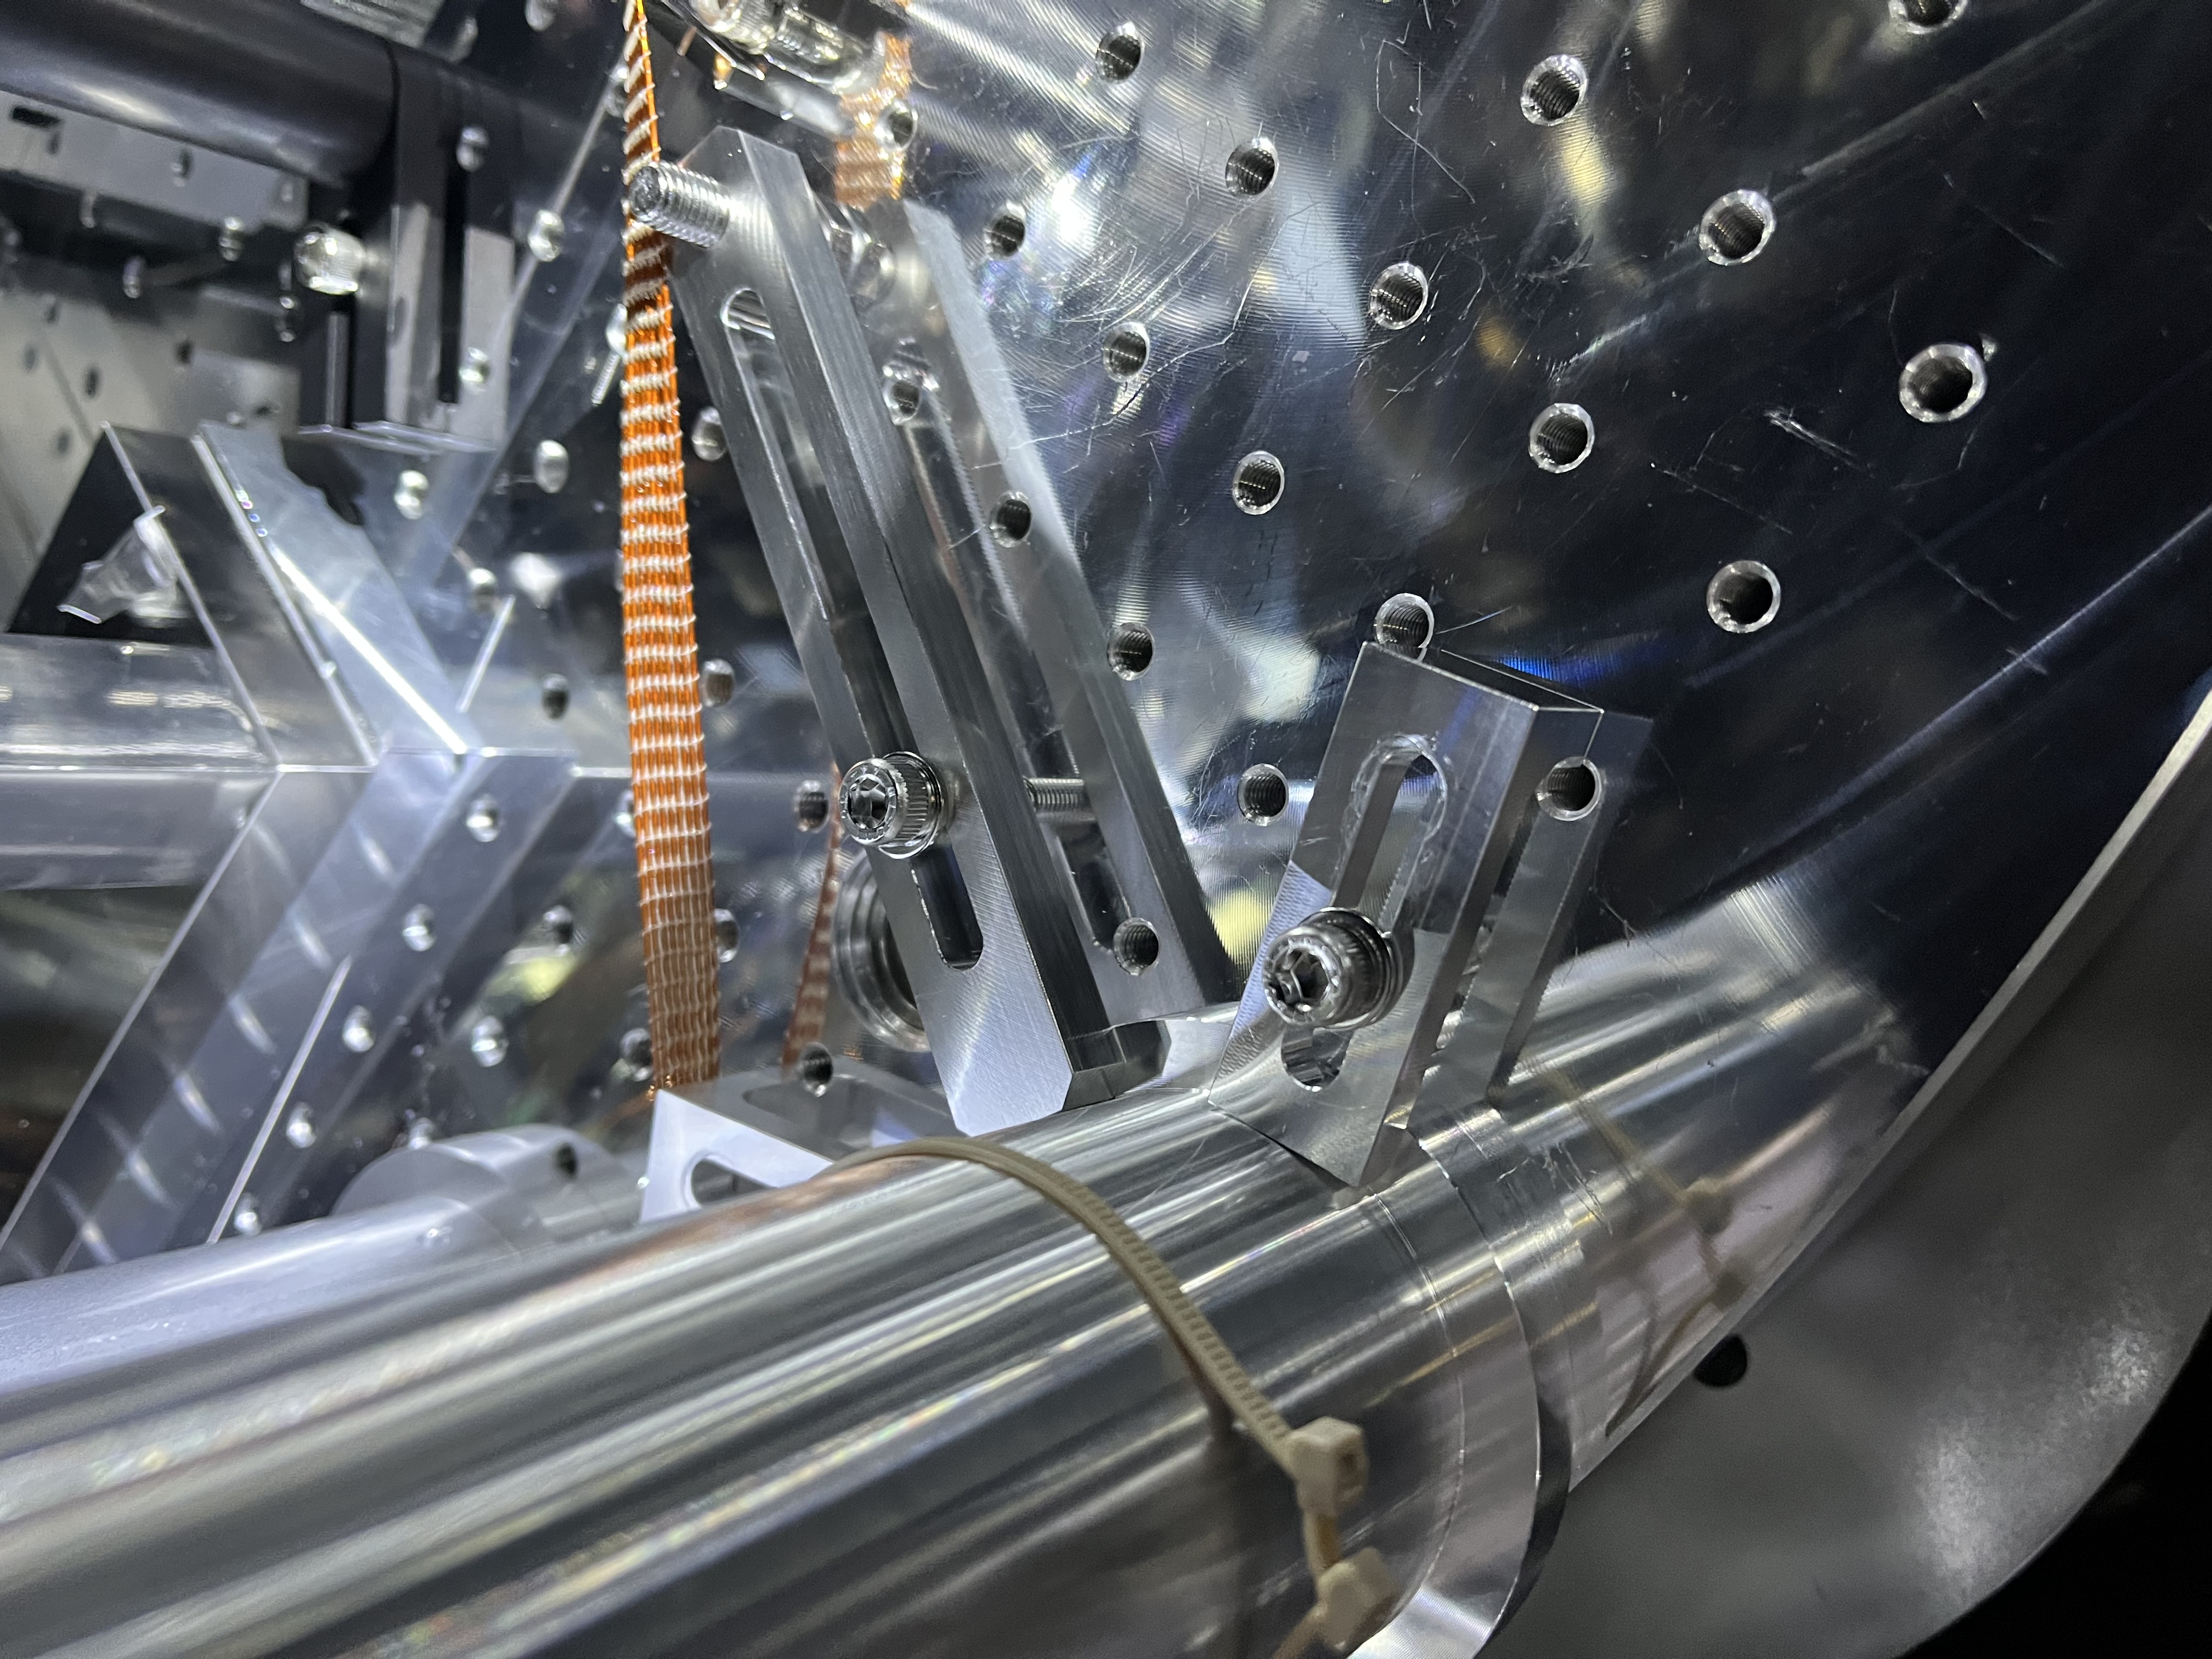
Figs. 1, 2 and 3 show the situation before our work. The first step was to rearrange the clamps on the STM2 pedestal's flange. Fig. 4 show prepared clamps. But, no matter how we arranged them, the situation only ever got worse; never better. For example, in Fig. 5, the reference lines (in green and brown) were the spectra before we began, while the red and blue lines were recorded after one of the clamps on the minus Y side was removed; as the number of clamps decreased, the resonant frequencies naturally shifted lower. Fig. 6 shows the spectra when reattaching three clamps, but no improvement were observed. Moreover, when I tried to remove the clamp on the plus Y side, IMMT1T QPD signals tended to shift in the positive pitch direction to out-of-the-range level, so I re-tightened it and left this clamp. The 127 Hz feature was very stable and appeared to be unrelated to the STM2 clamping, while the 220 Hz feature seemed to be associated with it.
At this point, we gave up this approach, and took a lunch break.
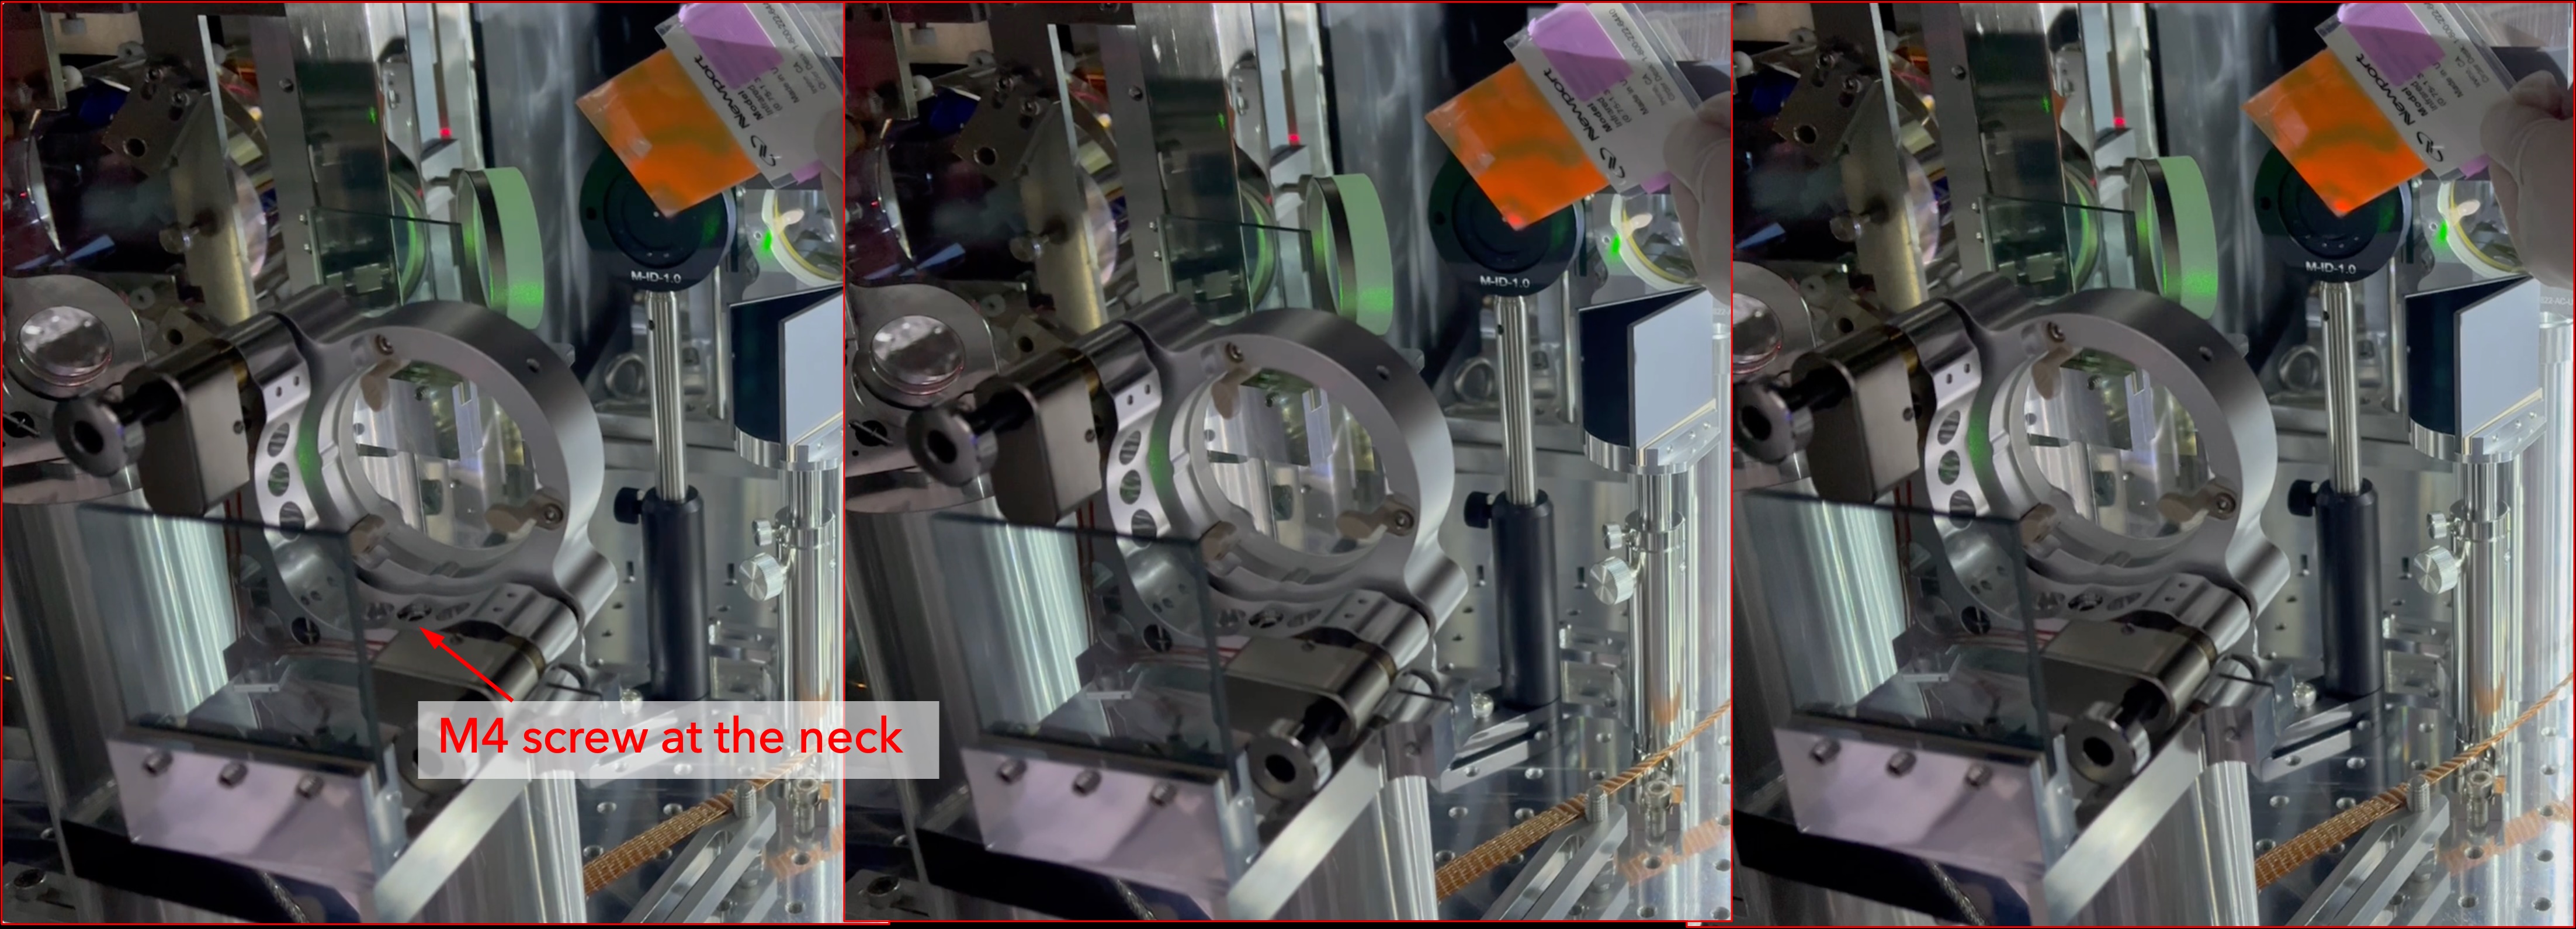
Re-tightening the M4 screw at the neck of the mirror holder
The second approach outlined in JGW-G2516553 is to try (re-)tightening the M4 screw at the neck of the mirror holder (Obuchi-san in ATC had pointed out this would be the most probable cause). This is a risky procedure, as there is a possiblity that the mirror holder may rotate in yaw. Before doing this, we carefully touched the STM2 mirror holder and found that the 127 Hz peak could grow up, while no such tendency was observed for STM1; this suggested that the neck, pico-motors, mirror, or any other components related to the mirror holder might be the cause.
We began by re-tightening the M4 screw at the neck using a torque wrench set to 1 Nm, although the nominal torque for M4 should be 1.5 Nm. As a result, the mirror holder rotated and we lost the beam spot on the IMMT1 QPDs. Fig. 7 shows the M4 screw in concern and the beam spot on the iris diaphragm that was set yesterday (see 33093). The beam spot seemed offset from the center hole of the iris by about 7-8 mm; the beam seemed clipped at IFI. Using the iris as a reference, we manually tweaked the picomotor while keeping the diaphragm closed; as a result, IMMT1 QPD SUM responeded. Then we fully opened the diaphragm, and using the IMMT1T QPD pitch and yaw as references, precisly adjusted the picomotor by hand (note that the electrical wires for the picomotors had been intensionally cut the other day).
Then, when checking the spectra, we found that the 127 Hz feature disappeared, and the 220 Hz feature shifted to the higher frequency.
We then tightend the M4 screw further to 1.5 Nm (the nominal value), and re-tweaked the picomotors. This time, the mirror holder did not rotate so much, and we were able to align the laser beam by referring only to IMMT1T QPDs.
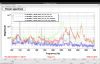
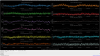
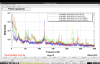
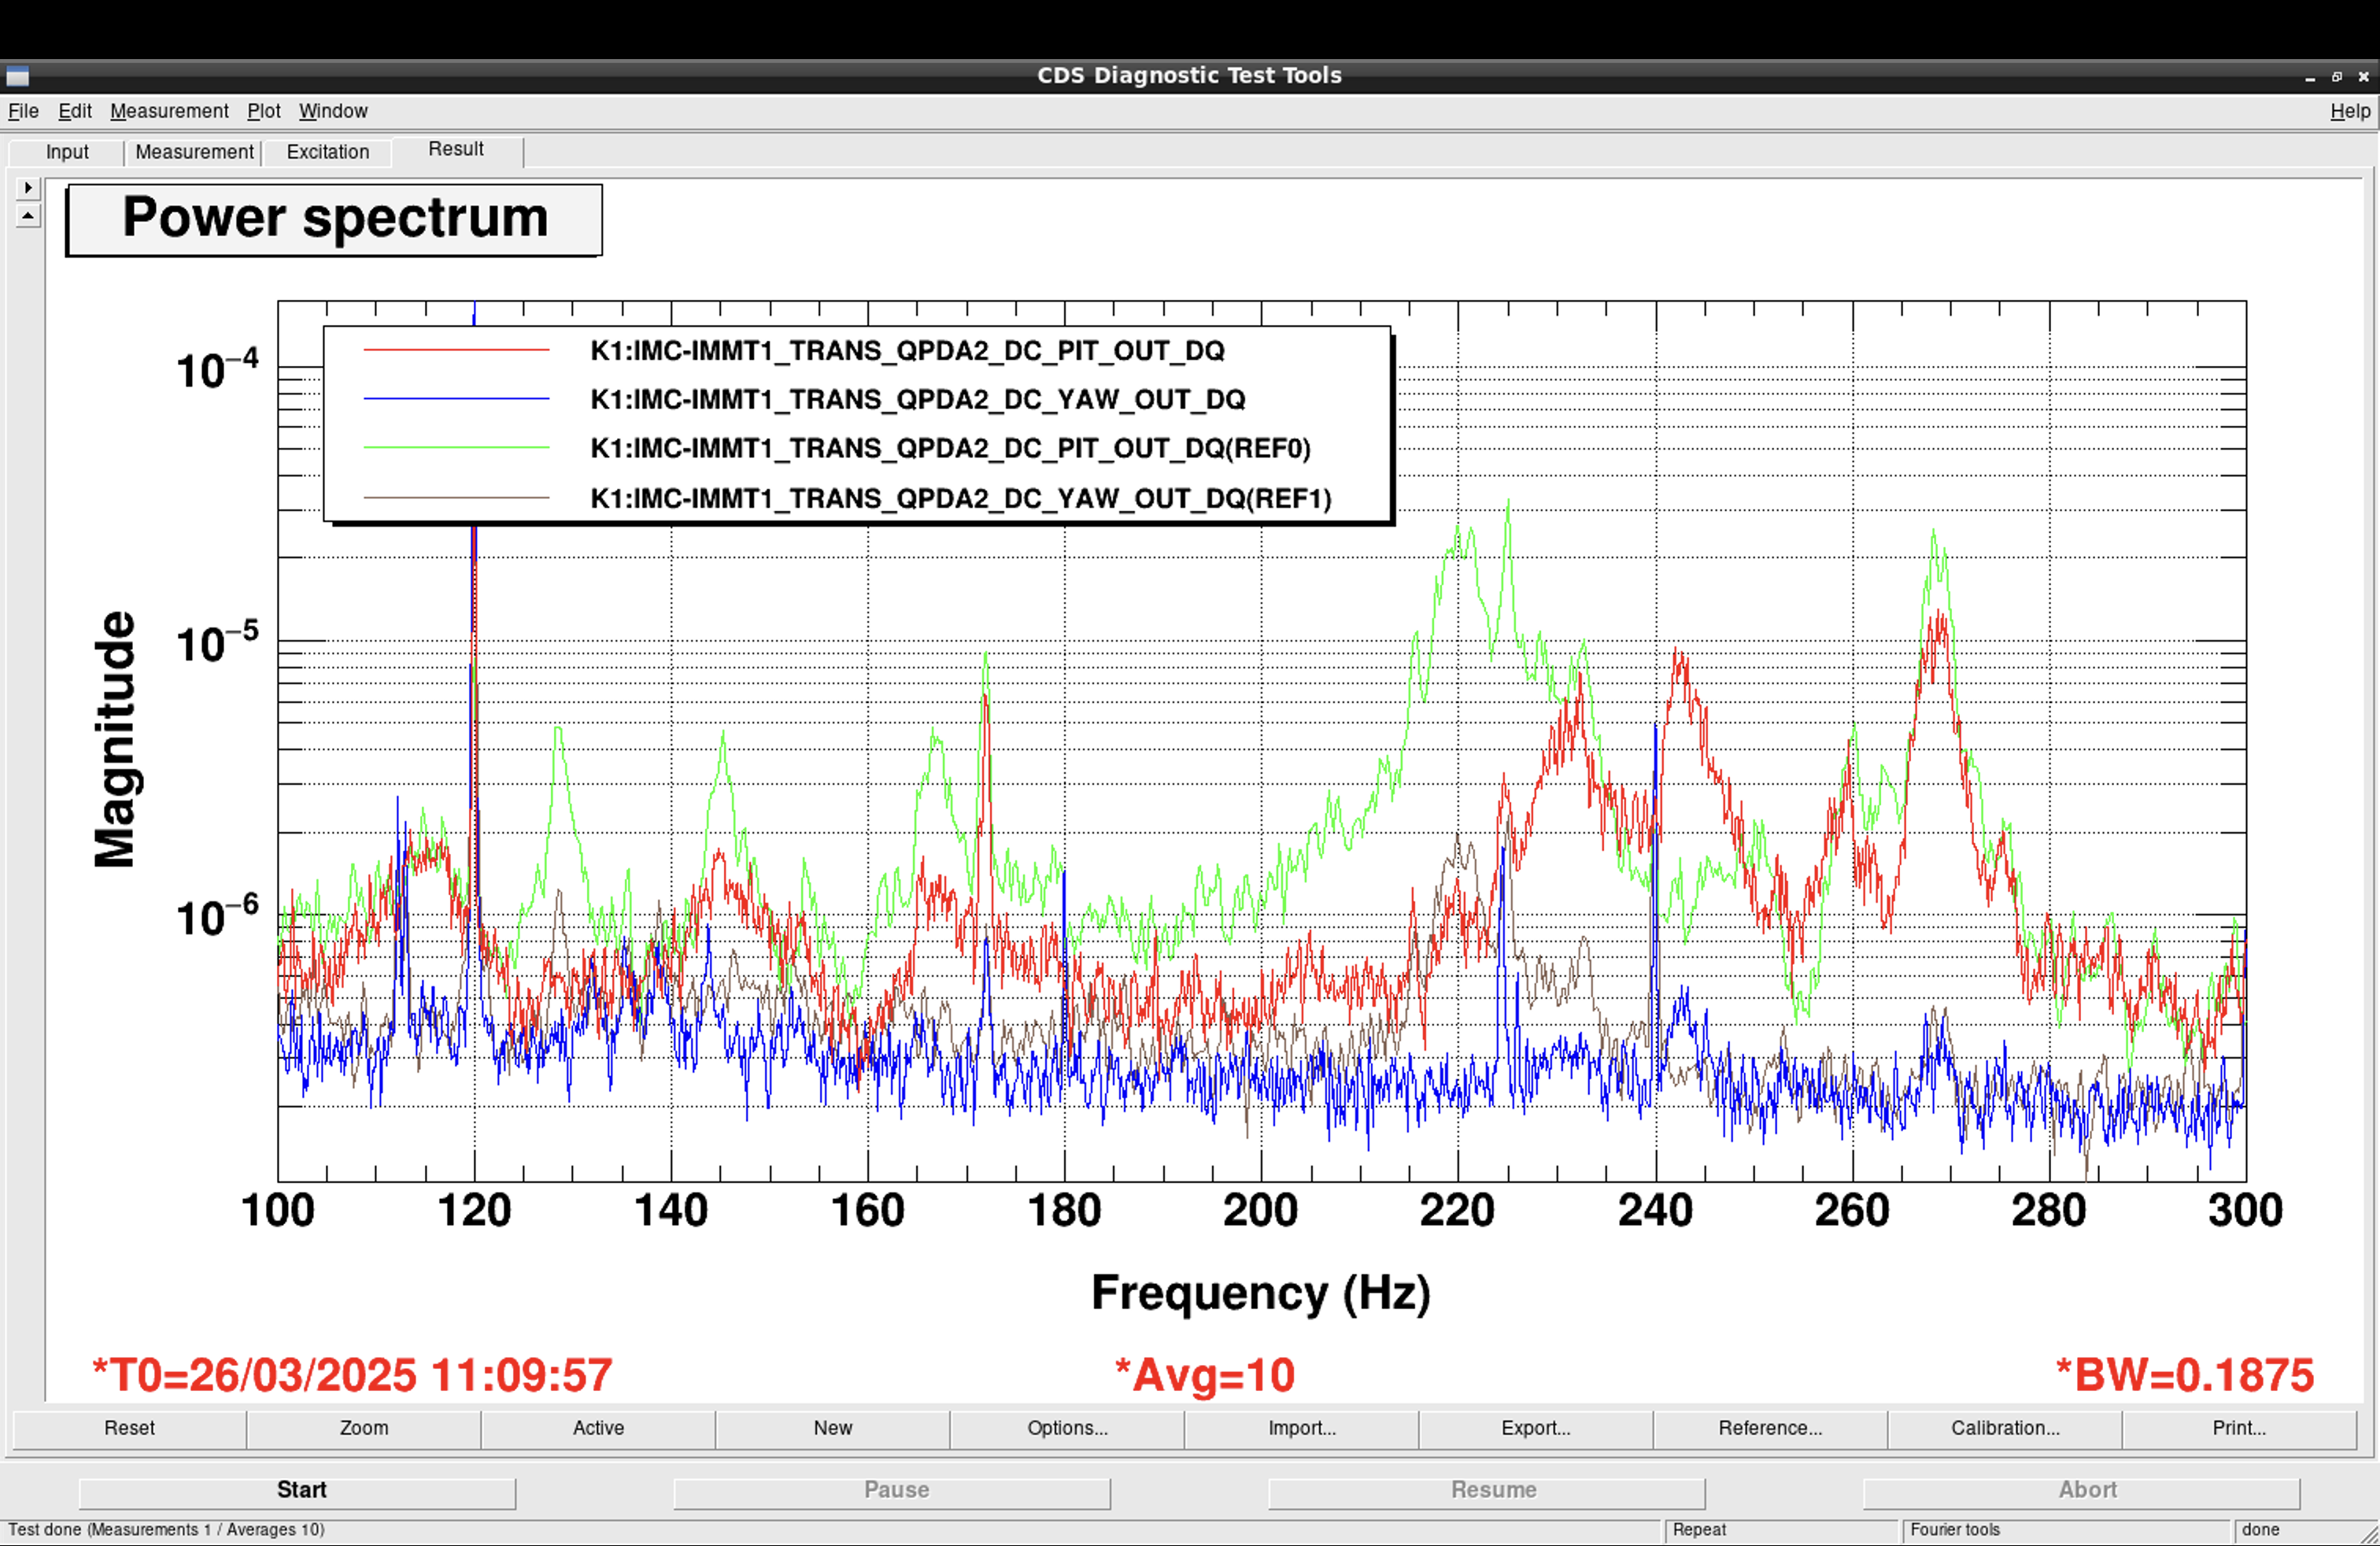
Fig. 8 shows the result. As before, compare red with green (ref) for pitch, blue with brown (ref) for yaw. Among almost entire the frequency range shown, the spectra improved (i.e. decreased). One exception is the range from 240-250 Hz. Let's see what will cause.
Post-processing
- To check if adding more clamps would have any further effect, we put an additional clamp, but seemed no significant change was observed. In the end, a total of four clamps were left (Figs. 9, 10, and 11).
- We removed the all (two) irises set in 33093.
Note
- In Fig. 8, the 270 Hz feature seemed related to STM1 structure; when touched, this feature grew up.
- In Fig. 8, to be precise, the red/blue spectra were measured after the flanges were wrapped by aluminum foils as much as possible, while green and brown were measured when the flanges were left open. Some windy effects may have excited some features to some extent. But, the overall qualitative behavior would remain consistent.
