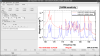
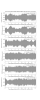
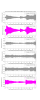
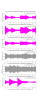
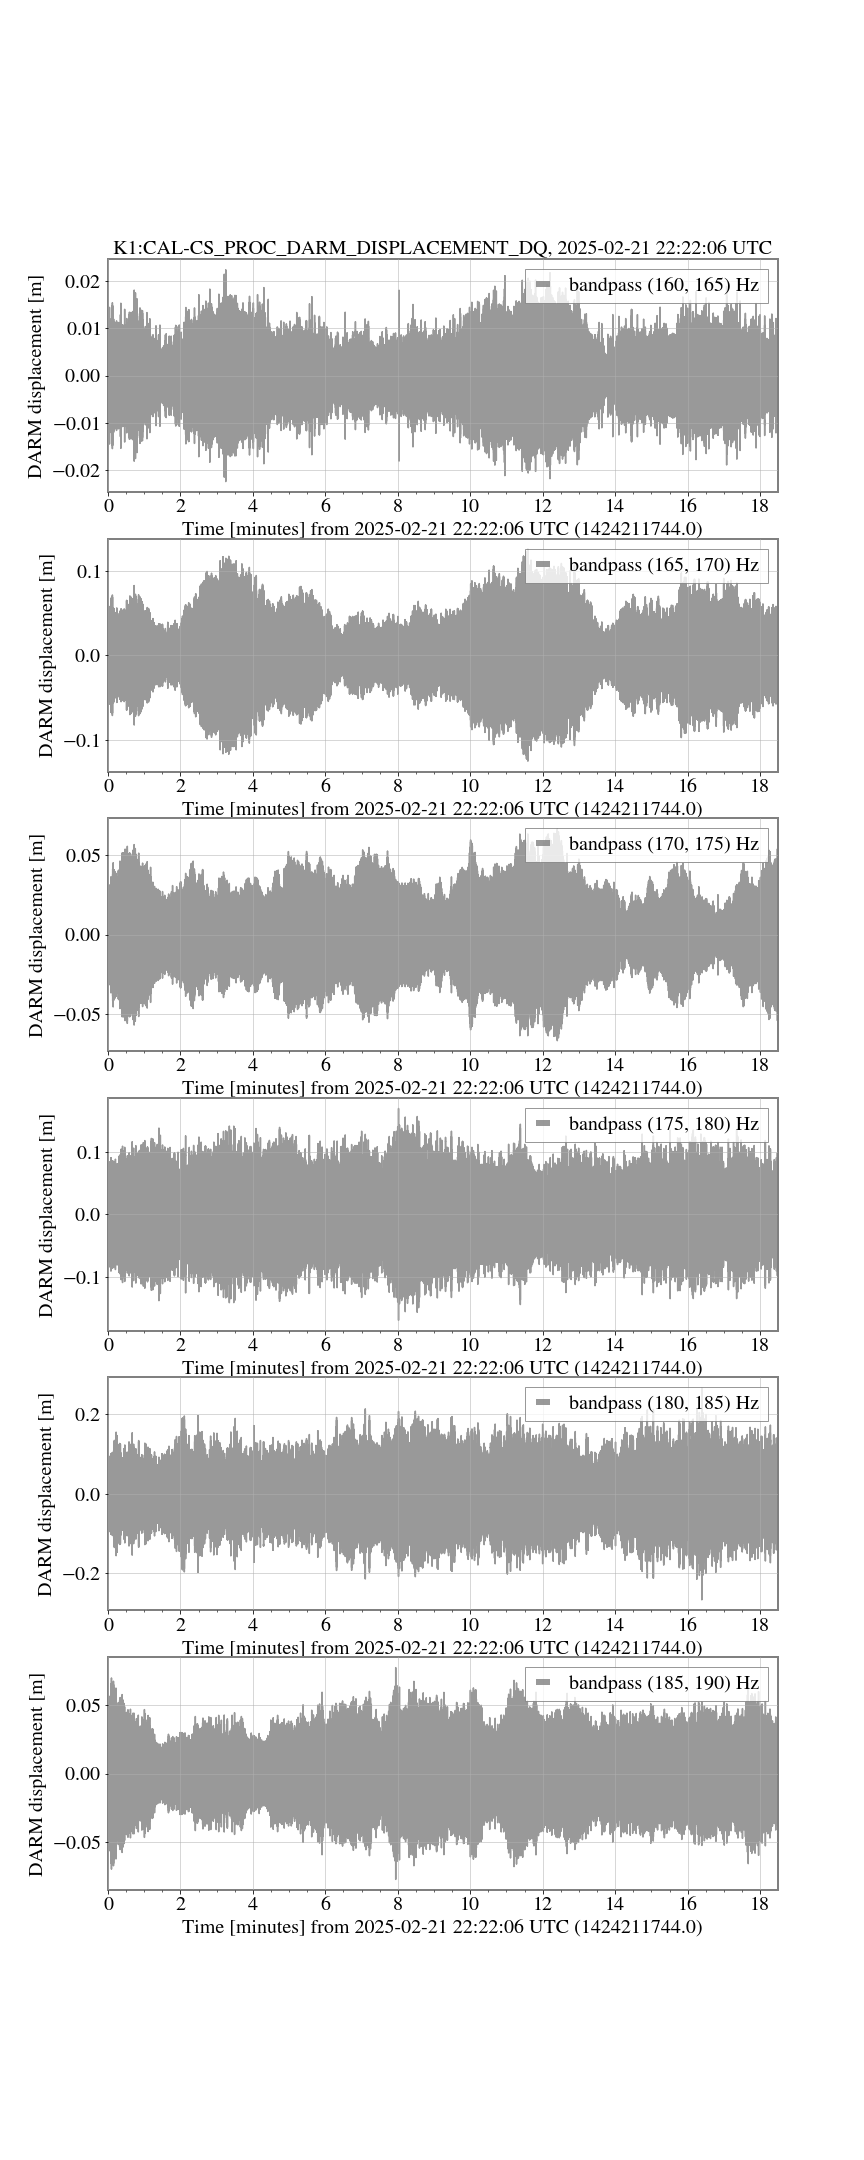
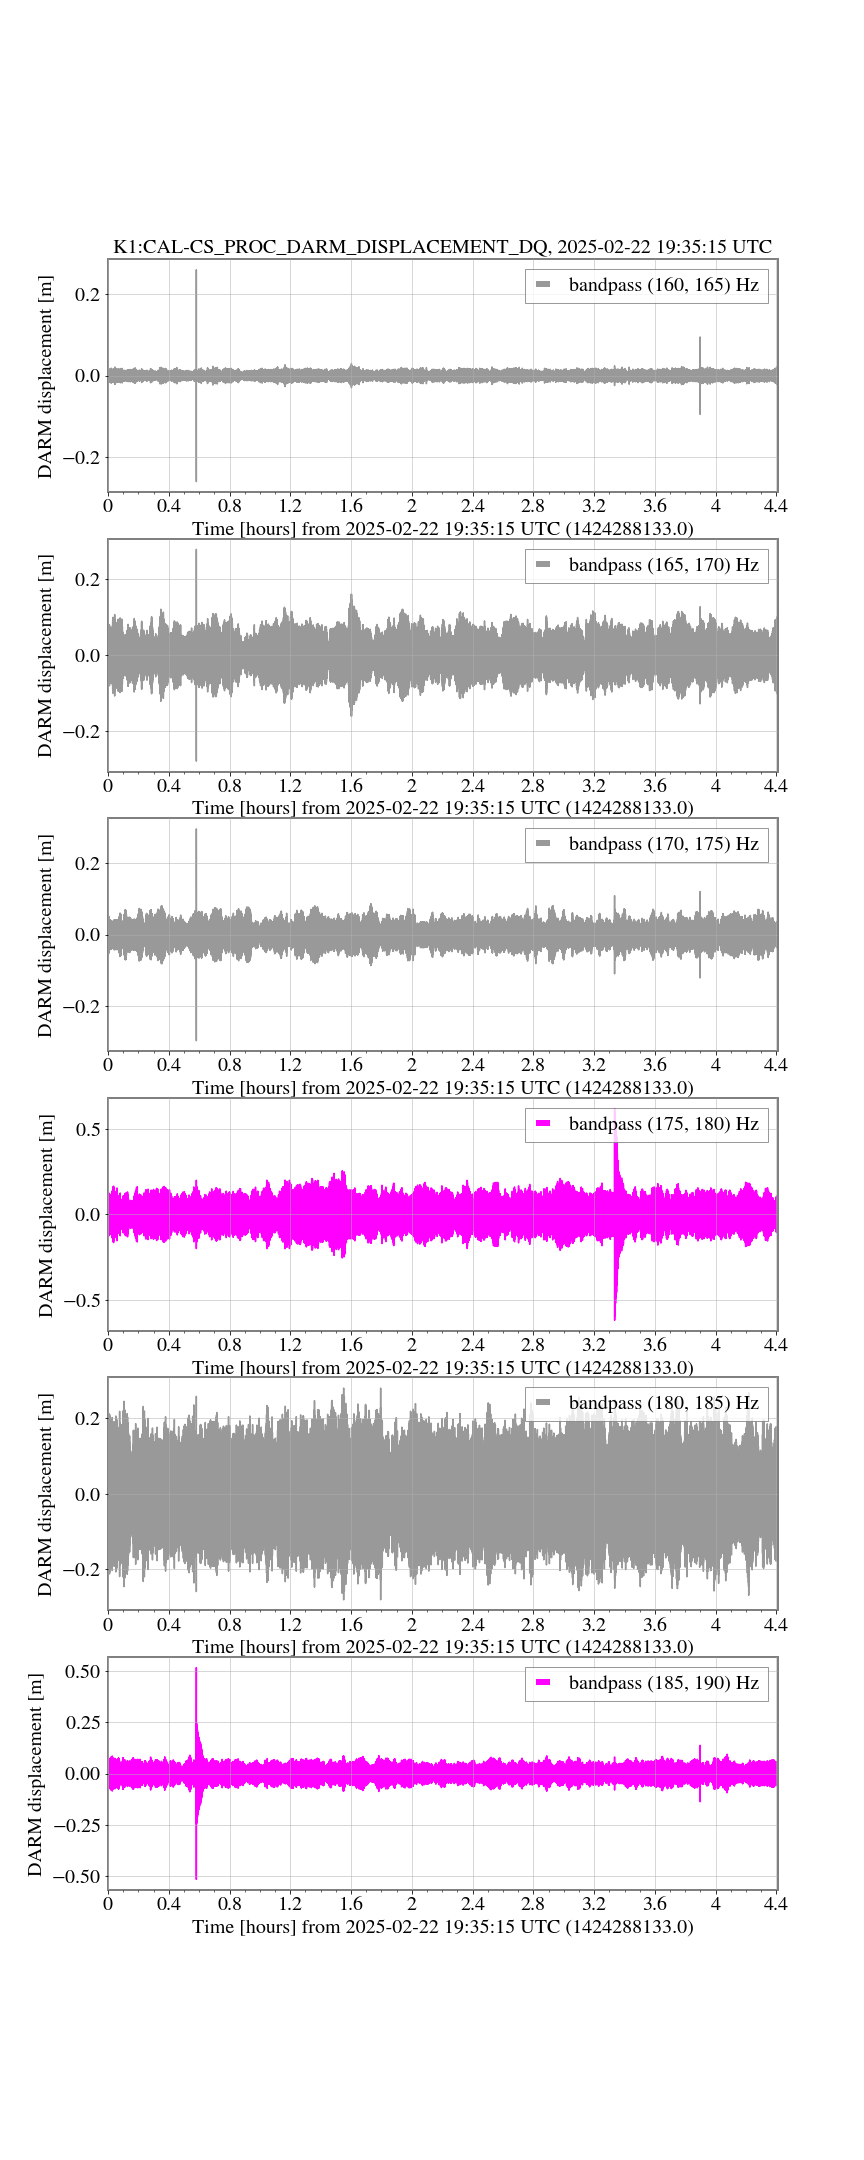
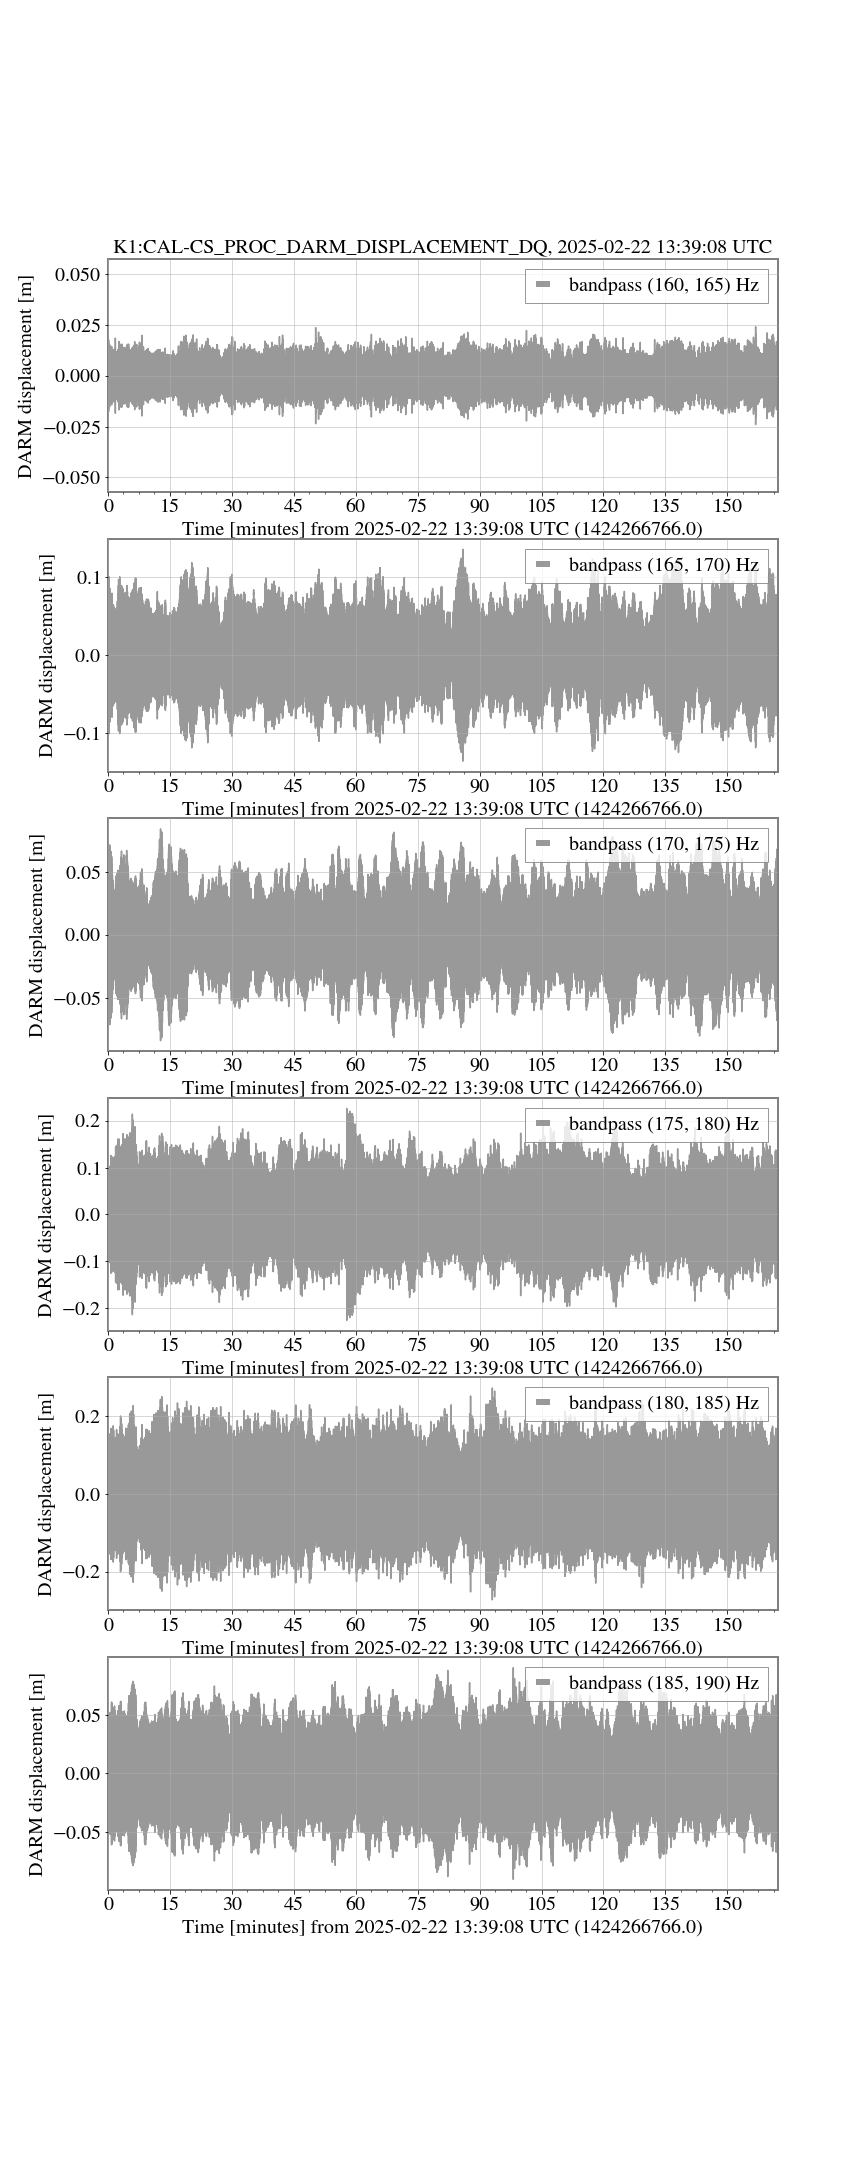
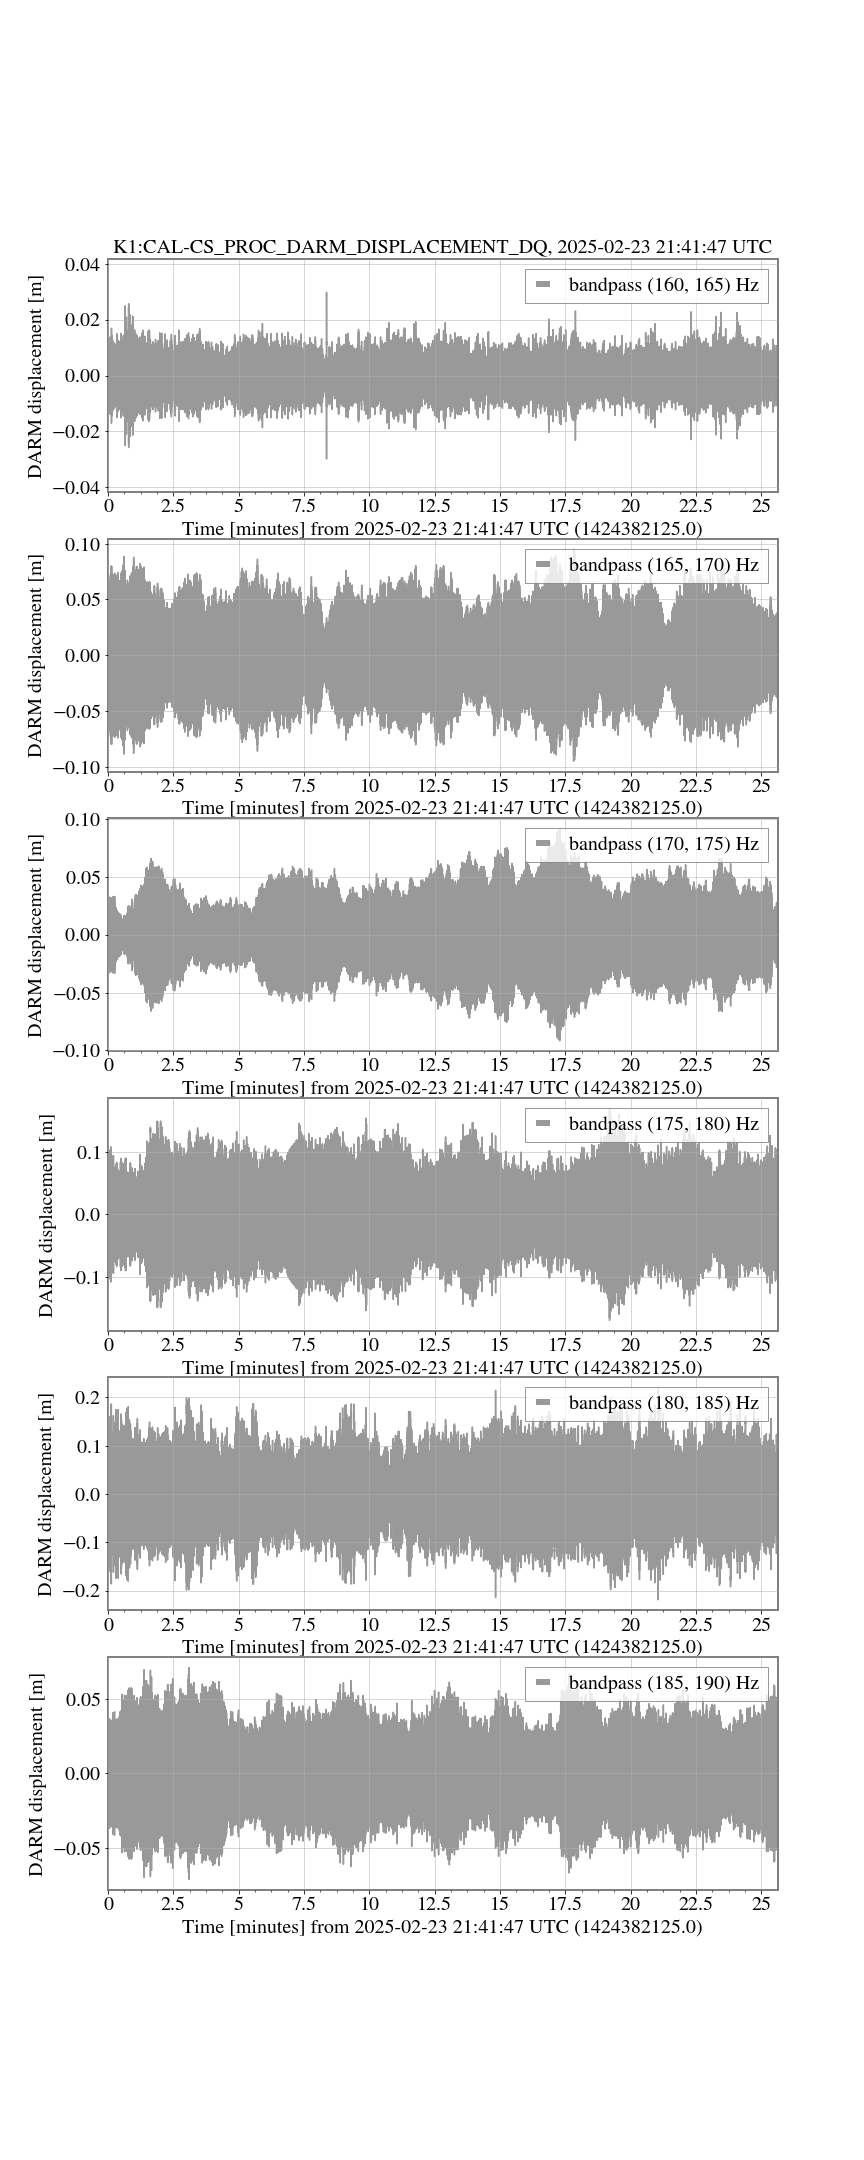
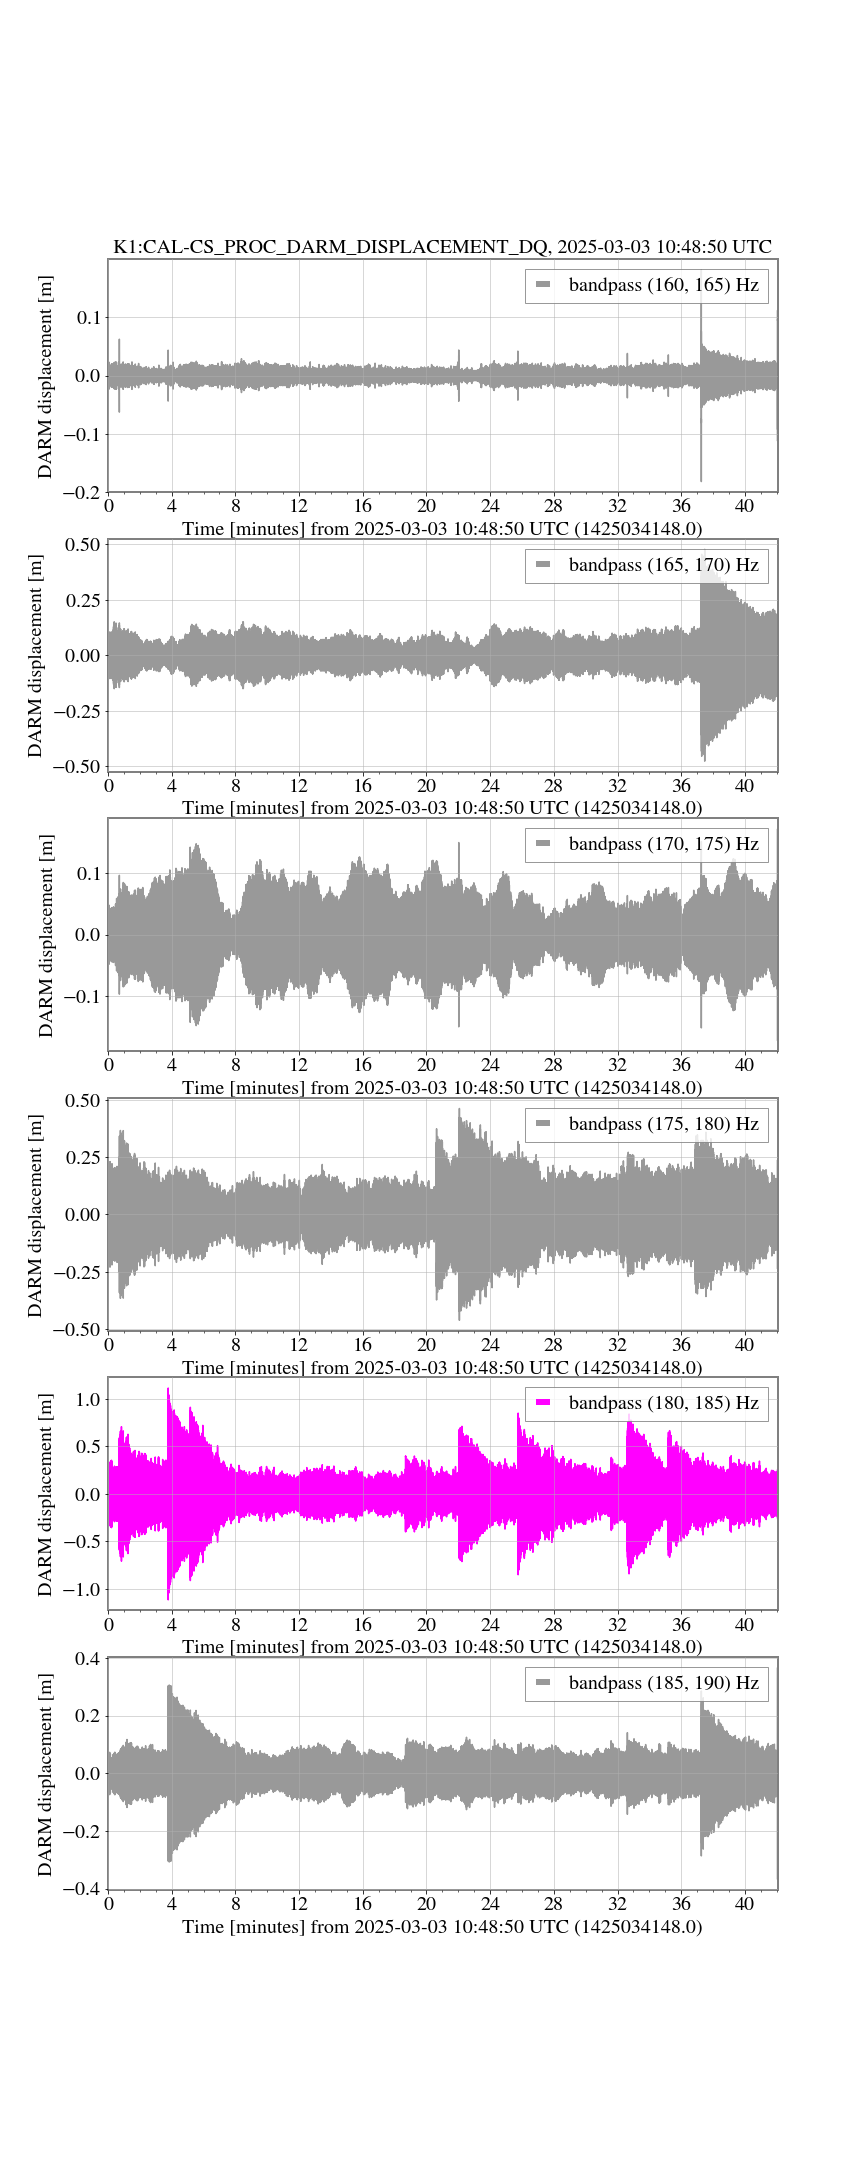
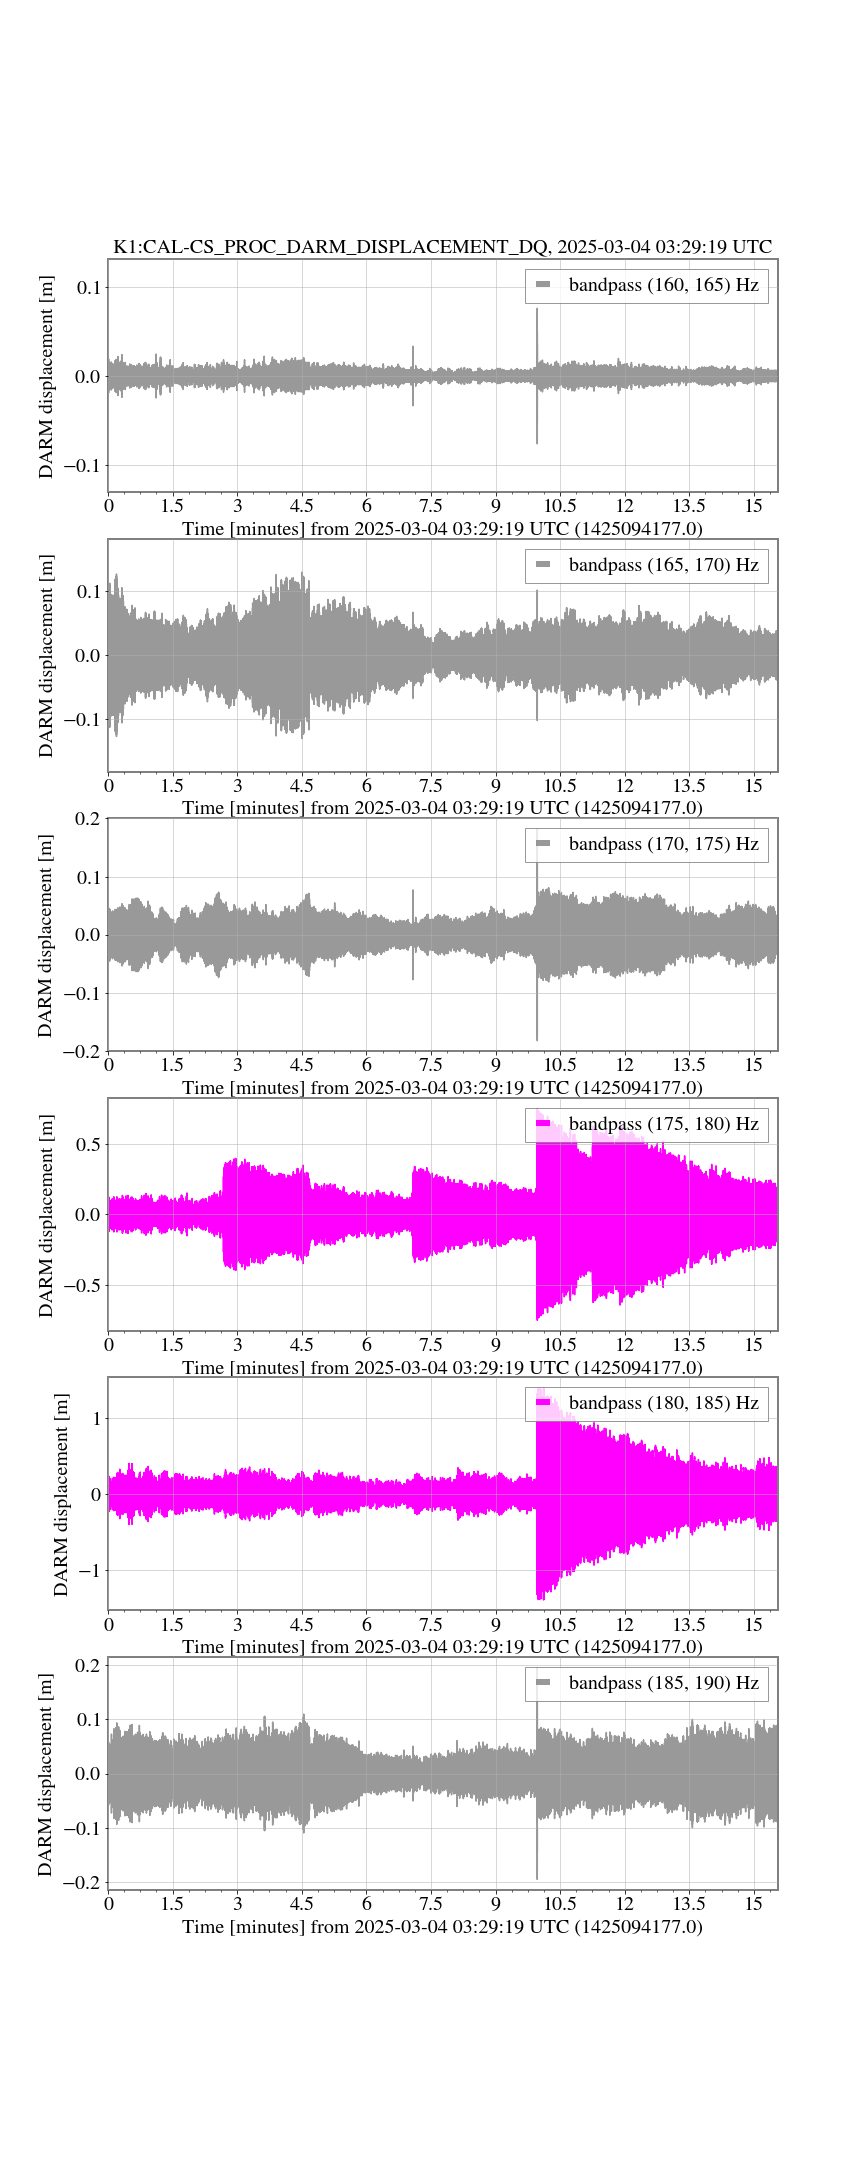
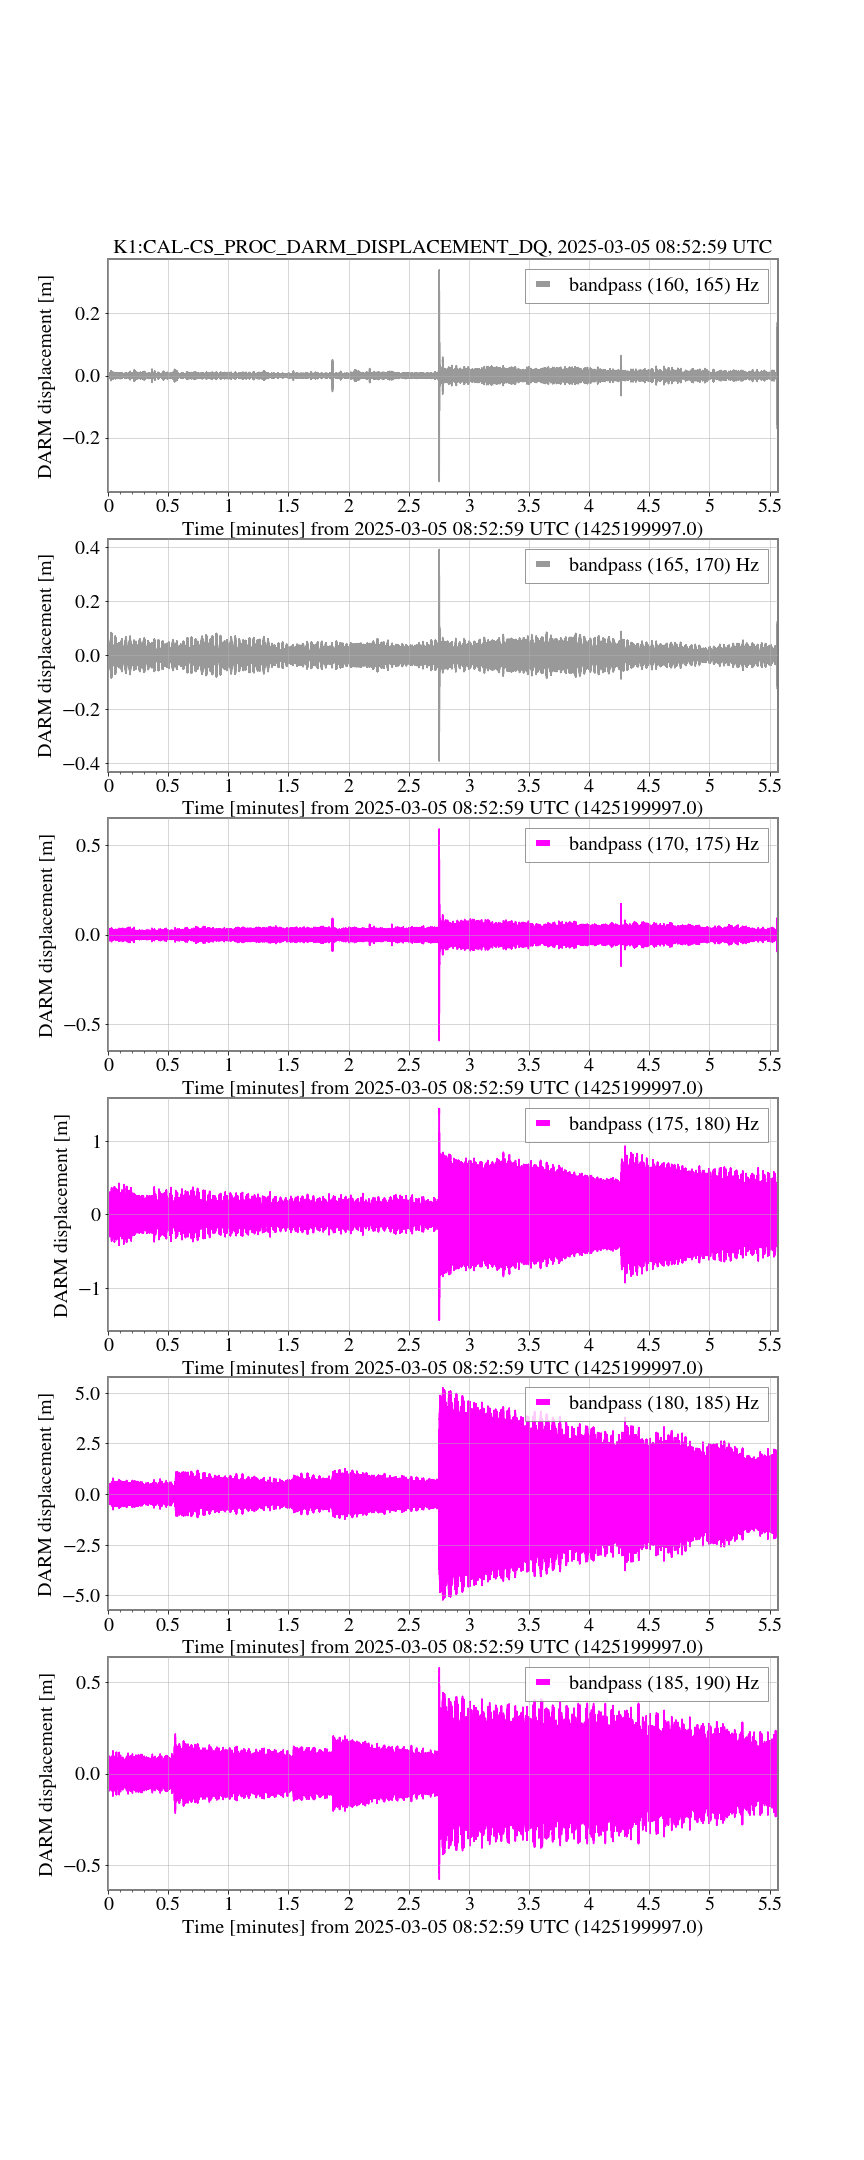
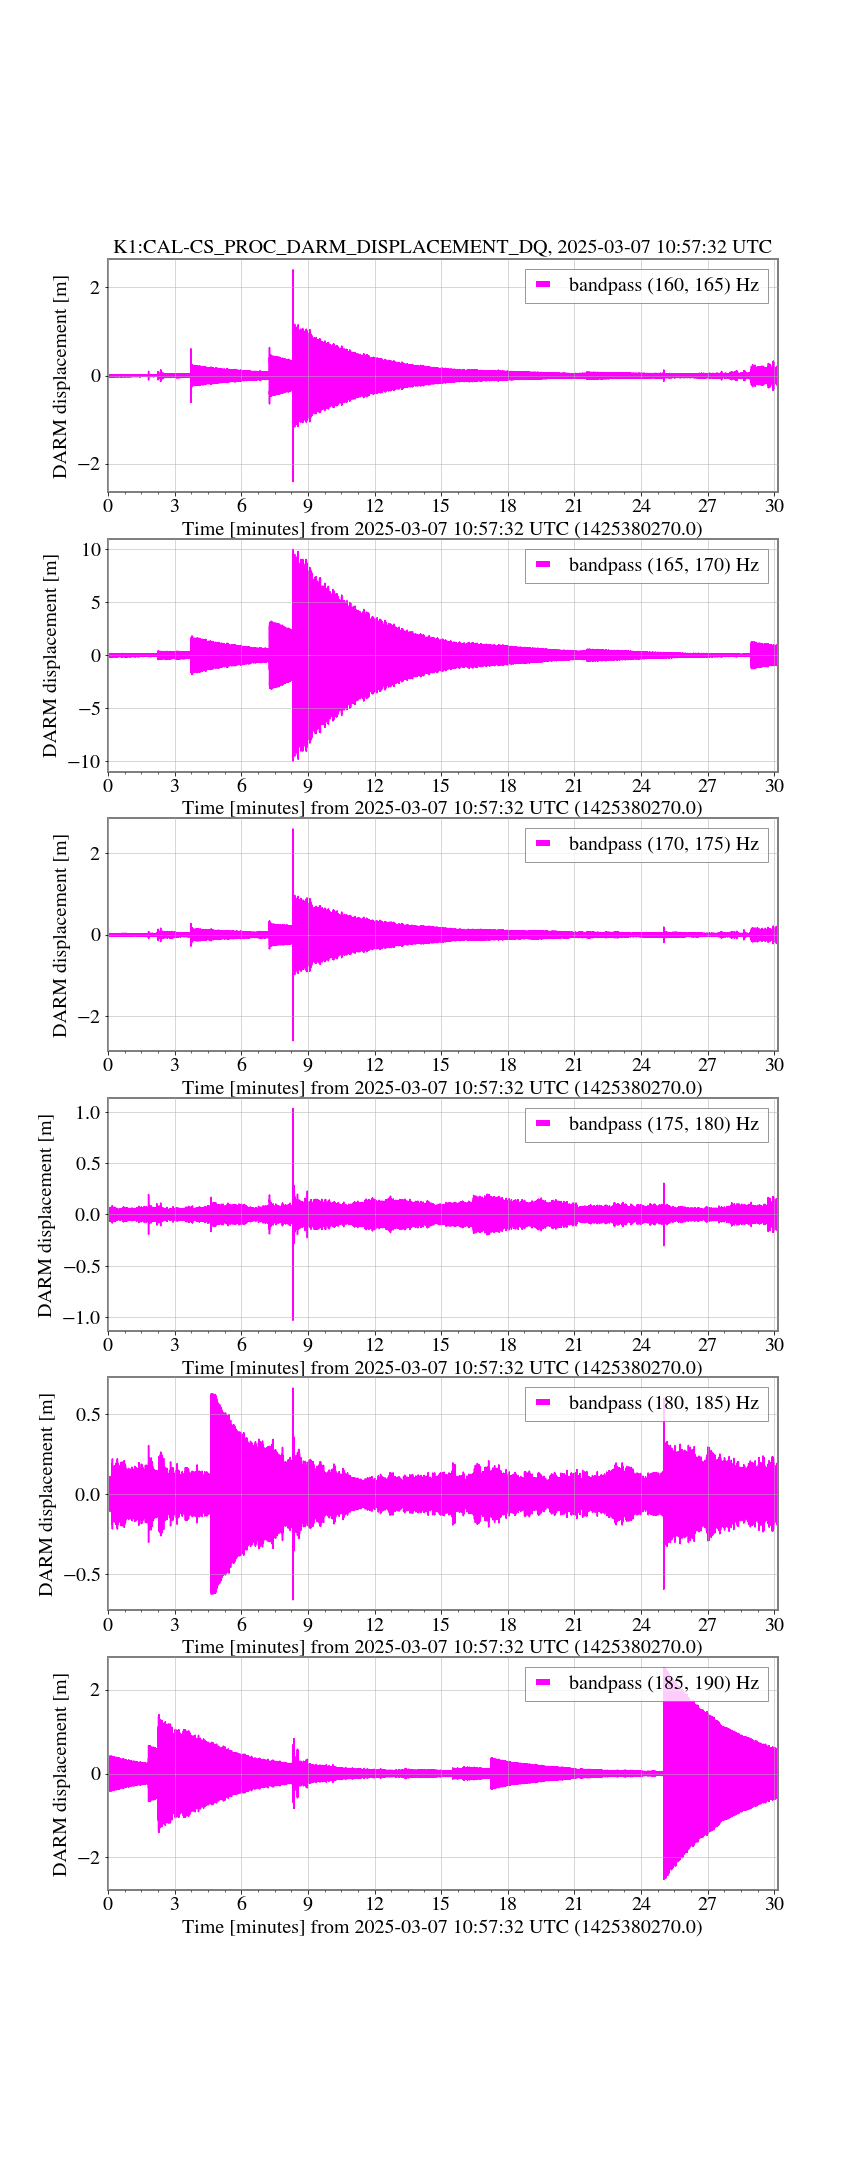
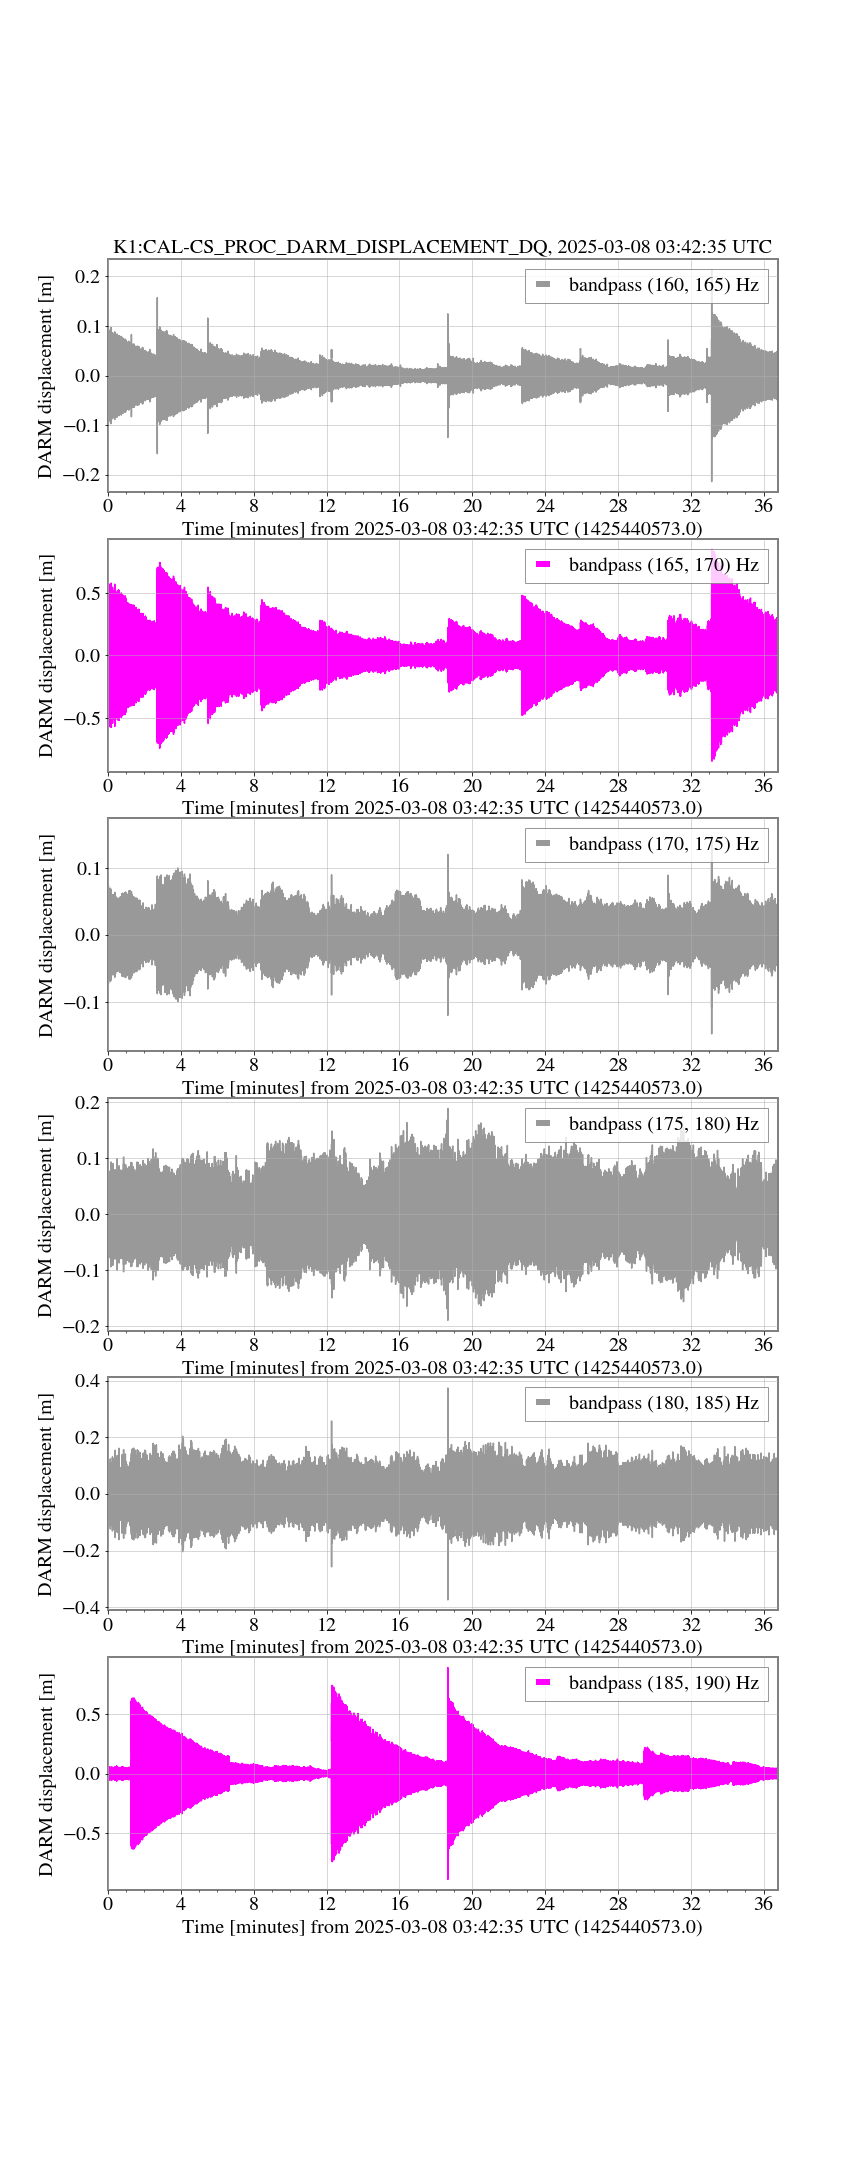
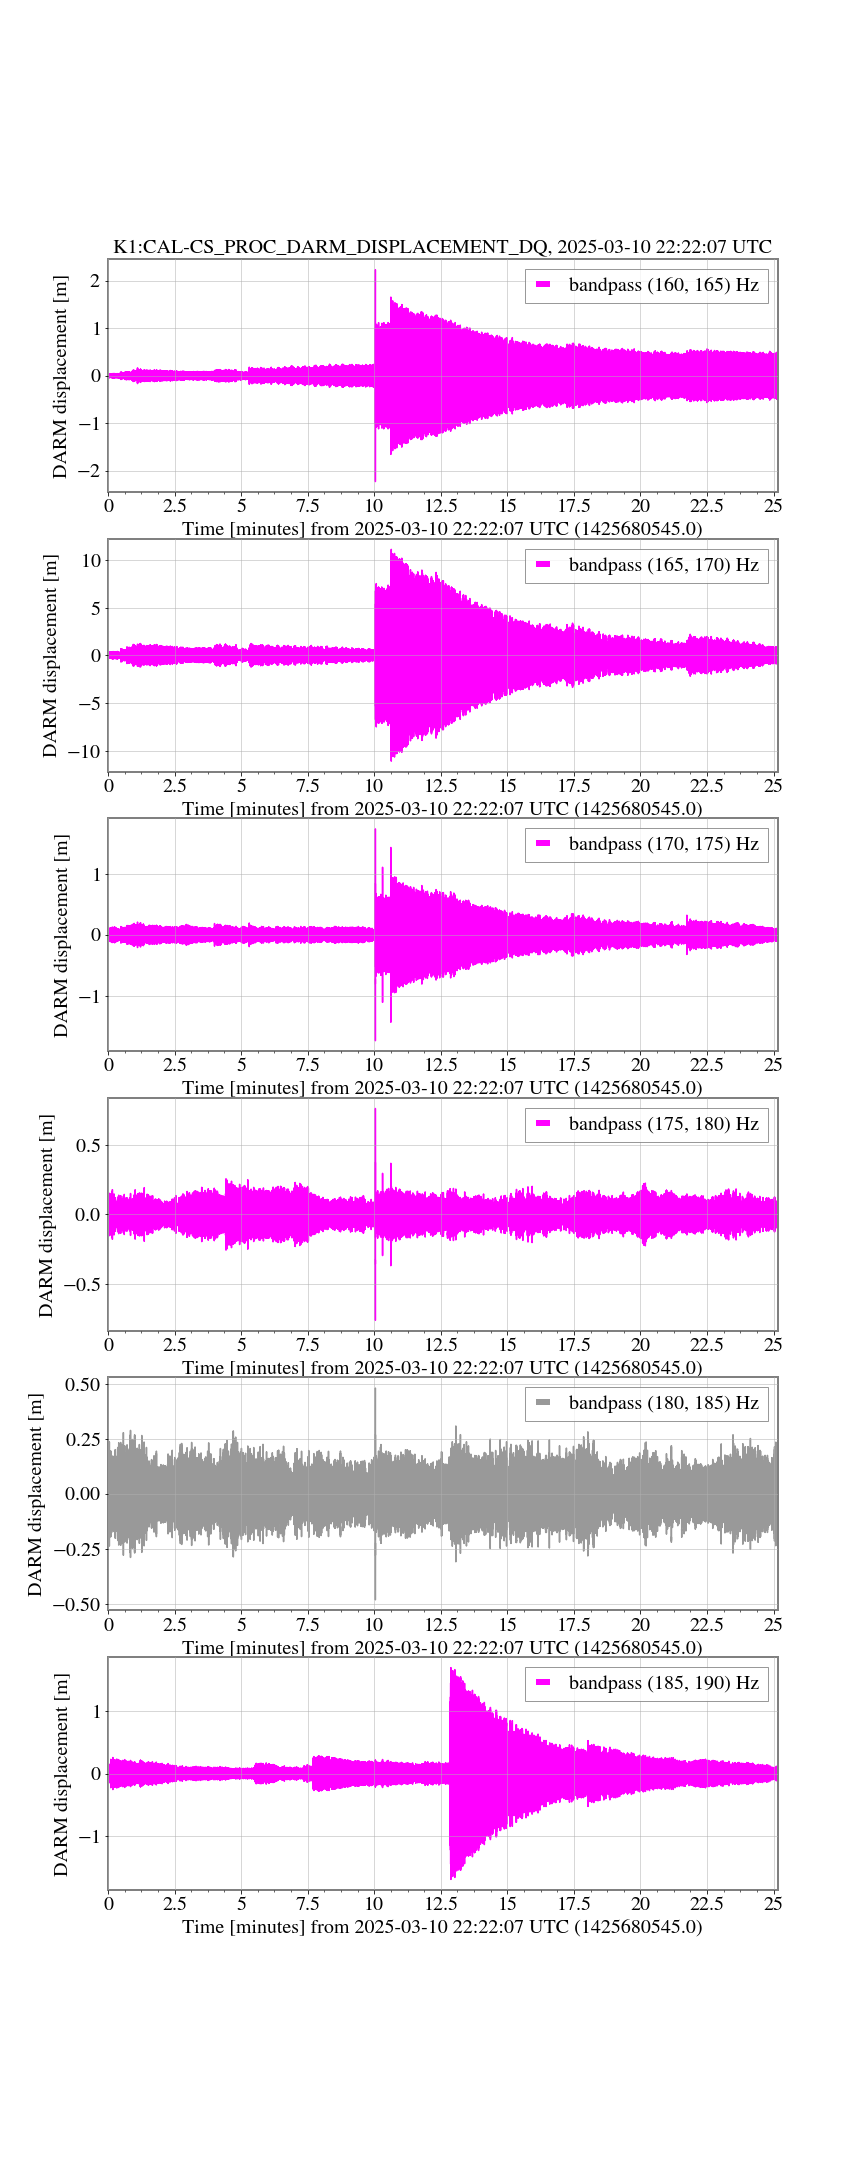
Here are the results of the additional analysis. If the magnitude is larger than 0.5, the curve is colored by magenta.
2/21~23
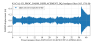
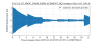
Figure 1, 3, 4 shows no apparent excitation of resonance.
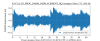
Figure 2 shows some dumped signals. But, the Q-value (dumping duration) looks different from other dumping signals. The amplitude of the signal looks smaller than other dumping signals. I guess the origin of the dumping signal is different from the others.
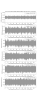
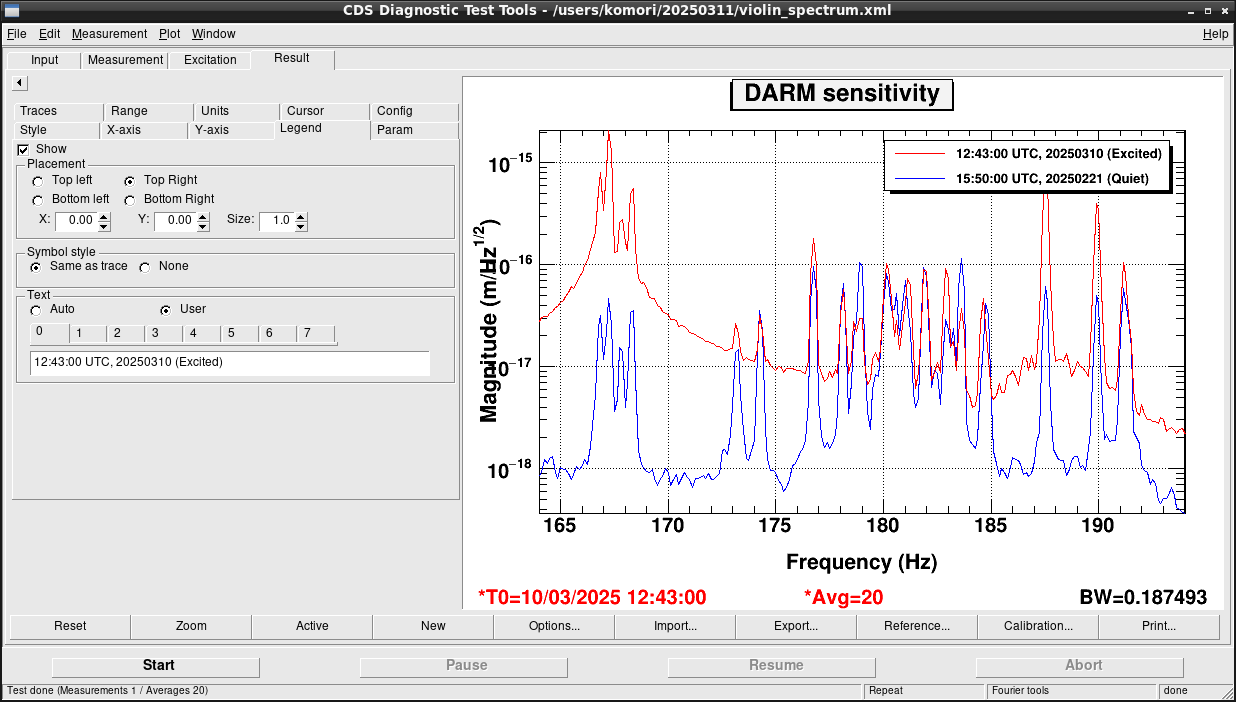
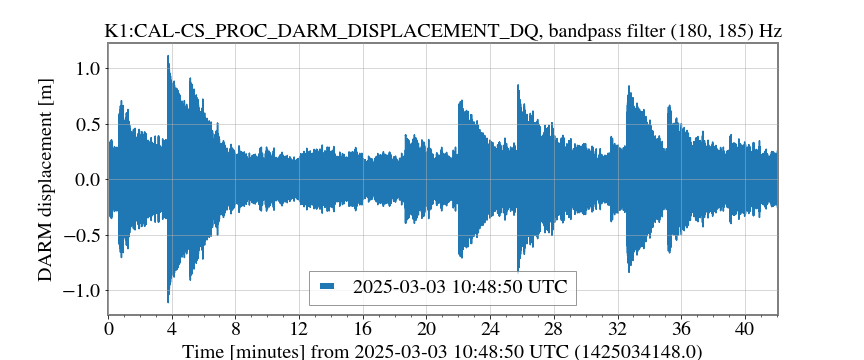
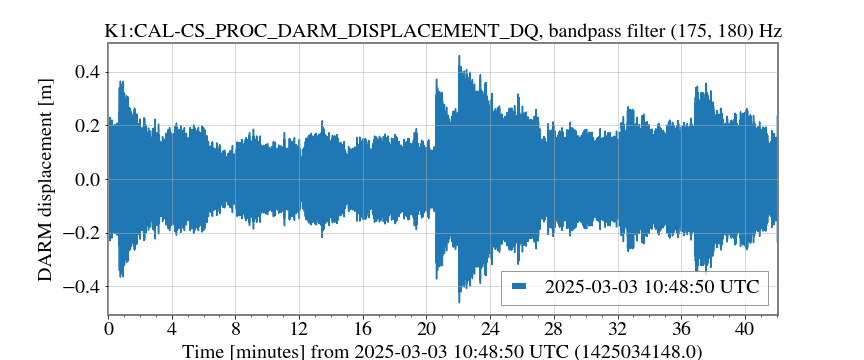
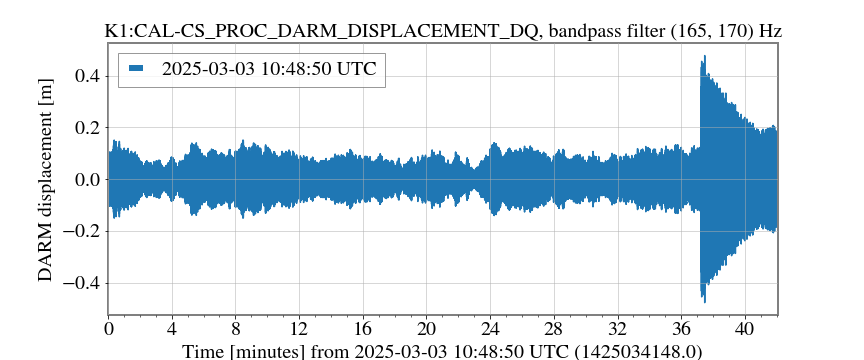
3/3~3/5
In Figure 5~7, we can see the dumping signal in 180~185 Hz, which seems to be related to ETMX. Although the neighbor frequency band has the large amplitude and the timeseries data is colored, it's due to the large tail of the line noise.
Note that on 3/6, the interferometer was not locked.
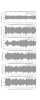
3/7
In Figure 8, we can see the dumping signal in 165~170 Hz, which seems to be related to ETMY, and 180~185 Hz, which seems to be related to ETMX. It's possible to be a mixture of these suspensions.
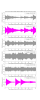
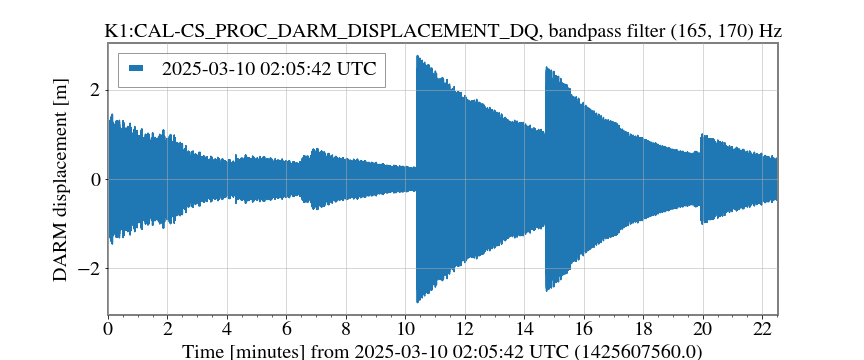
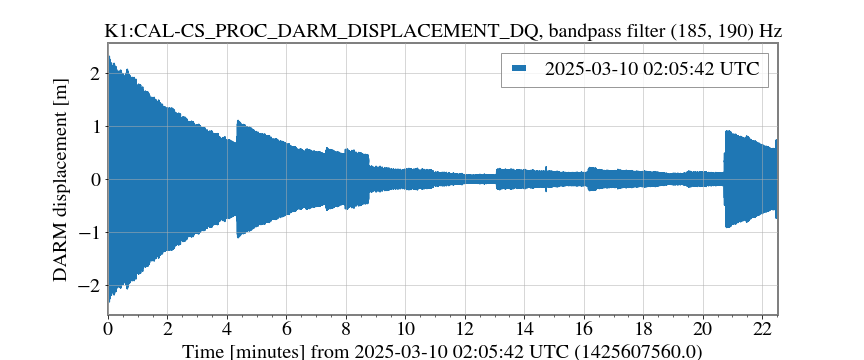
3/8~3/11
In Figure 9~12, we can see the dumping signal in 165~170 Hz and 185~190 Hz, which seem to be related to ETMY.
Although the neighbor frequency band has the large amplitude and the timeseries data is colored, it's due to the large tail of the line noise.


