Reports 1-1 of 1 Clear search Modify search
MIF (ASC)
hirotaka.yuzurihara - 16:44 Friday 27 September 2024 (31145) Print this report
Script for validation test of WFS sensing matrix

Based on Ushiba-san's request, I started to develop the script to perform the validation test of WFS sensing matrix. I will restart the code writing on Monday.

Details

  • Script:  /users/Commissioning/scripts/asc/validation_test_WFS_sensingmatrix.py
  • Usage
    • /users/Commissioning/scripts/asc$ ./validation_test_WFS_sensingmatrix.py --wfs PRC1_P
    • The other WFS dof are also selectable. You can see them by -h option.

 Steps in the script

  1. Read the current WFS sensing matrix values. If you want to add the WFS sensing matrix to read, add them in the dirctionary of `dict_channels`,
  2. Read the past data of the channels whose the sensing matrix has the non-zero value. The GPS time to read the data should be fixed as the time when the excitationw as done. So, the GPS time is specified in the script. Please edit it as necesary.
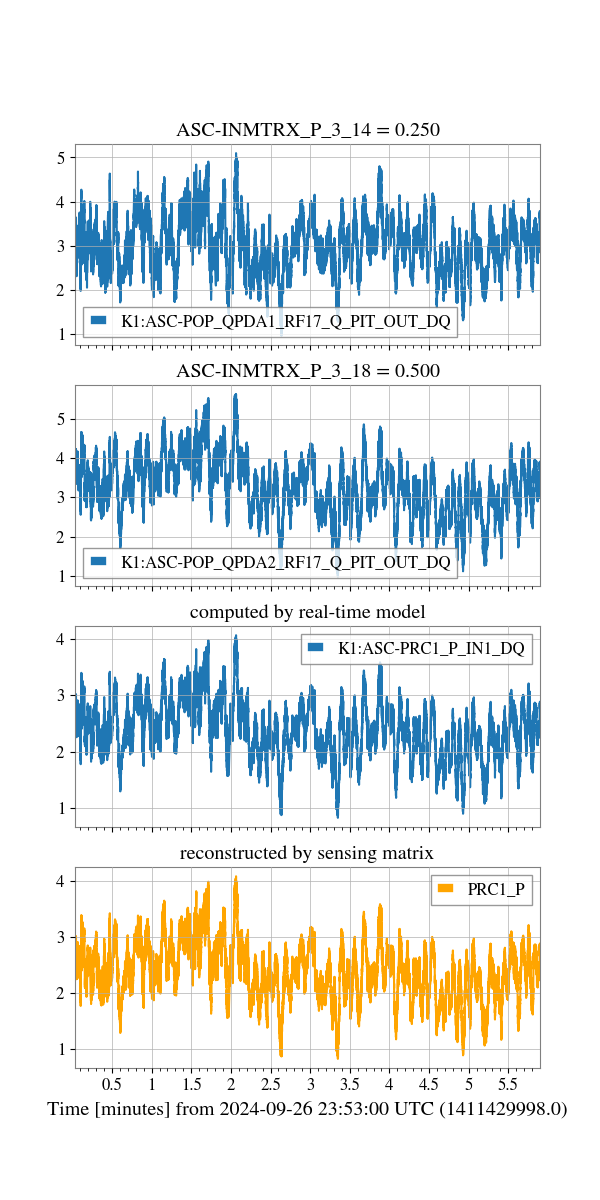
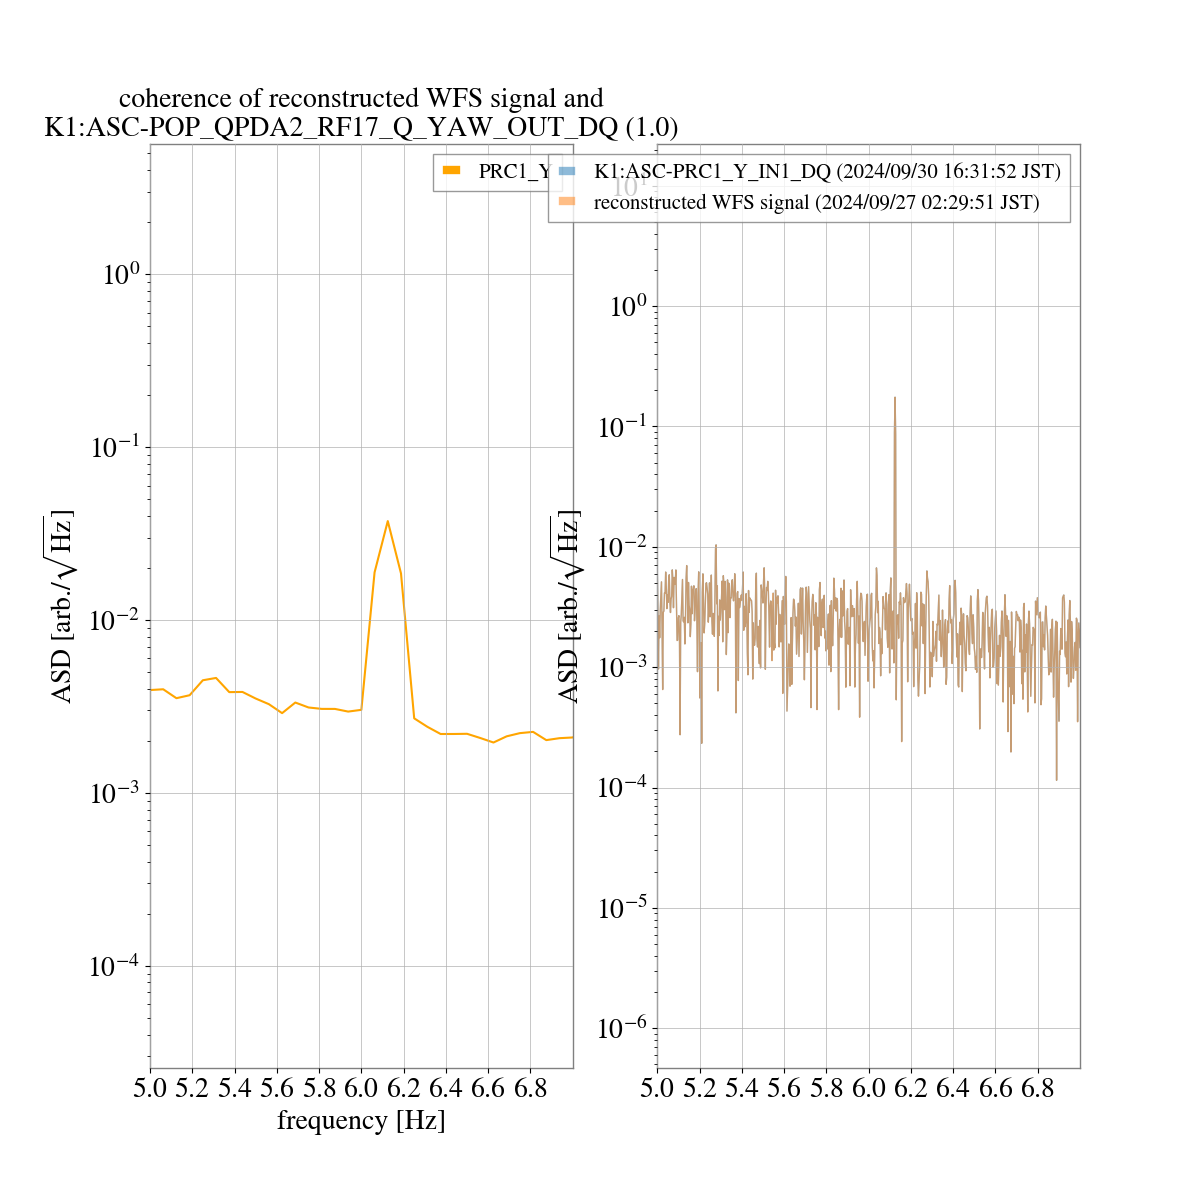
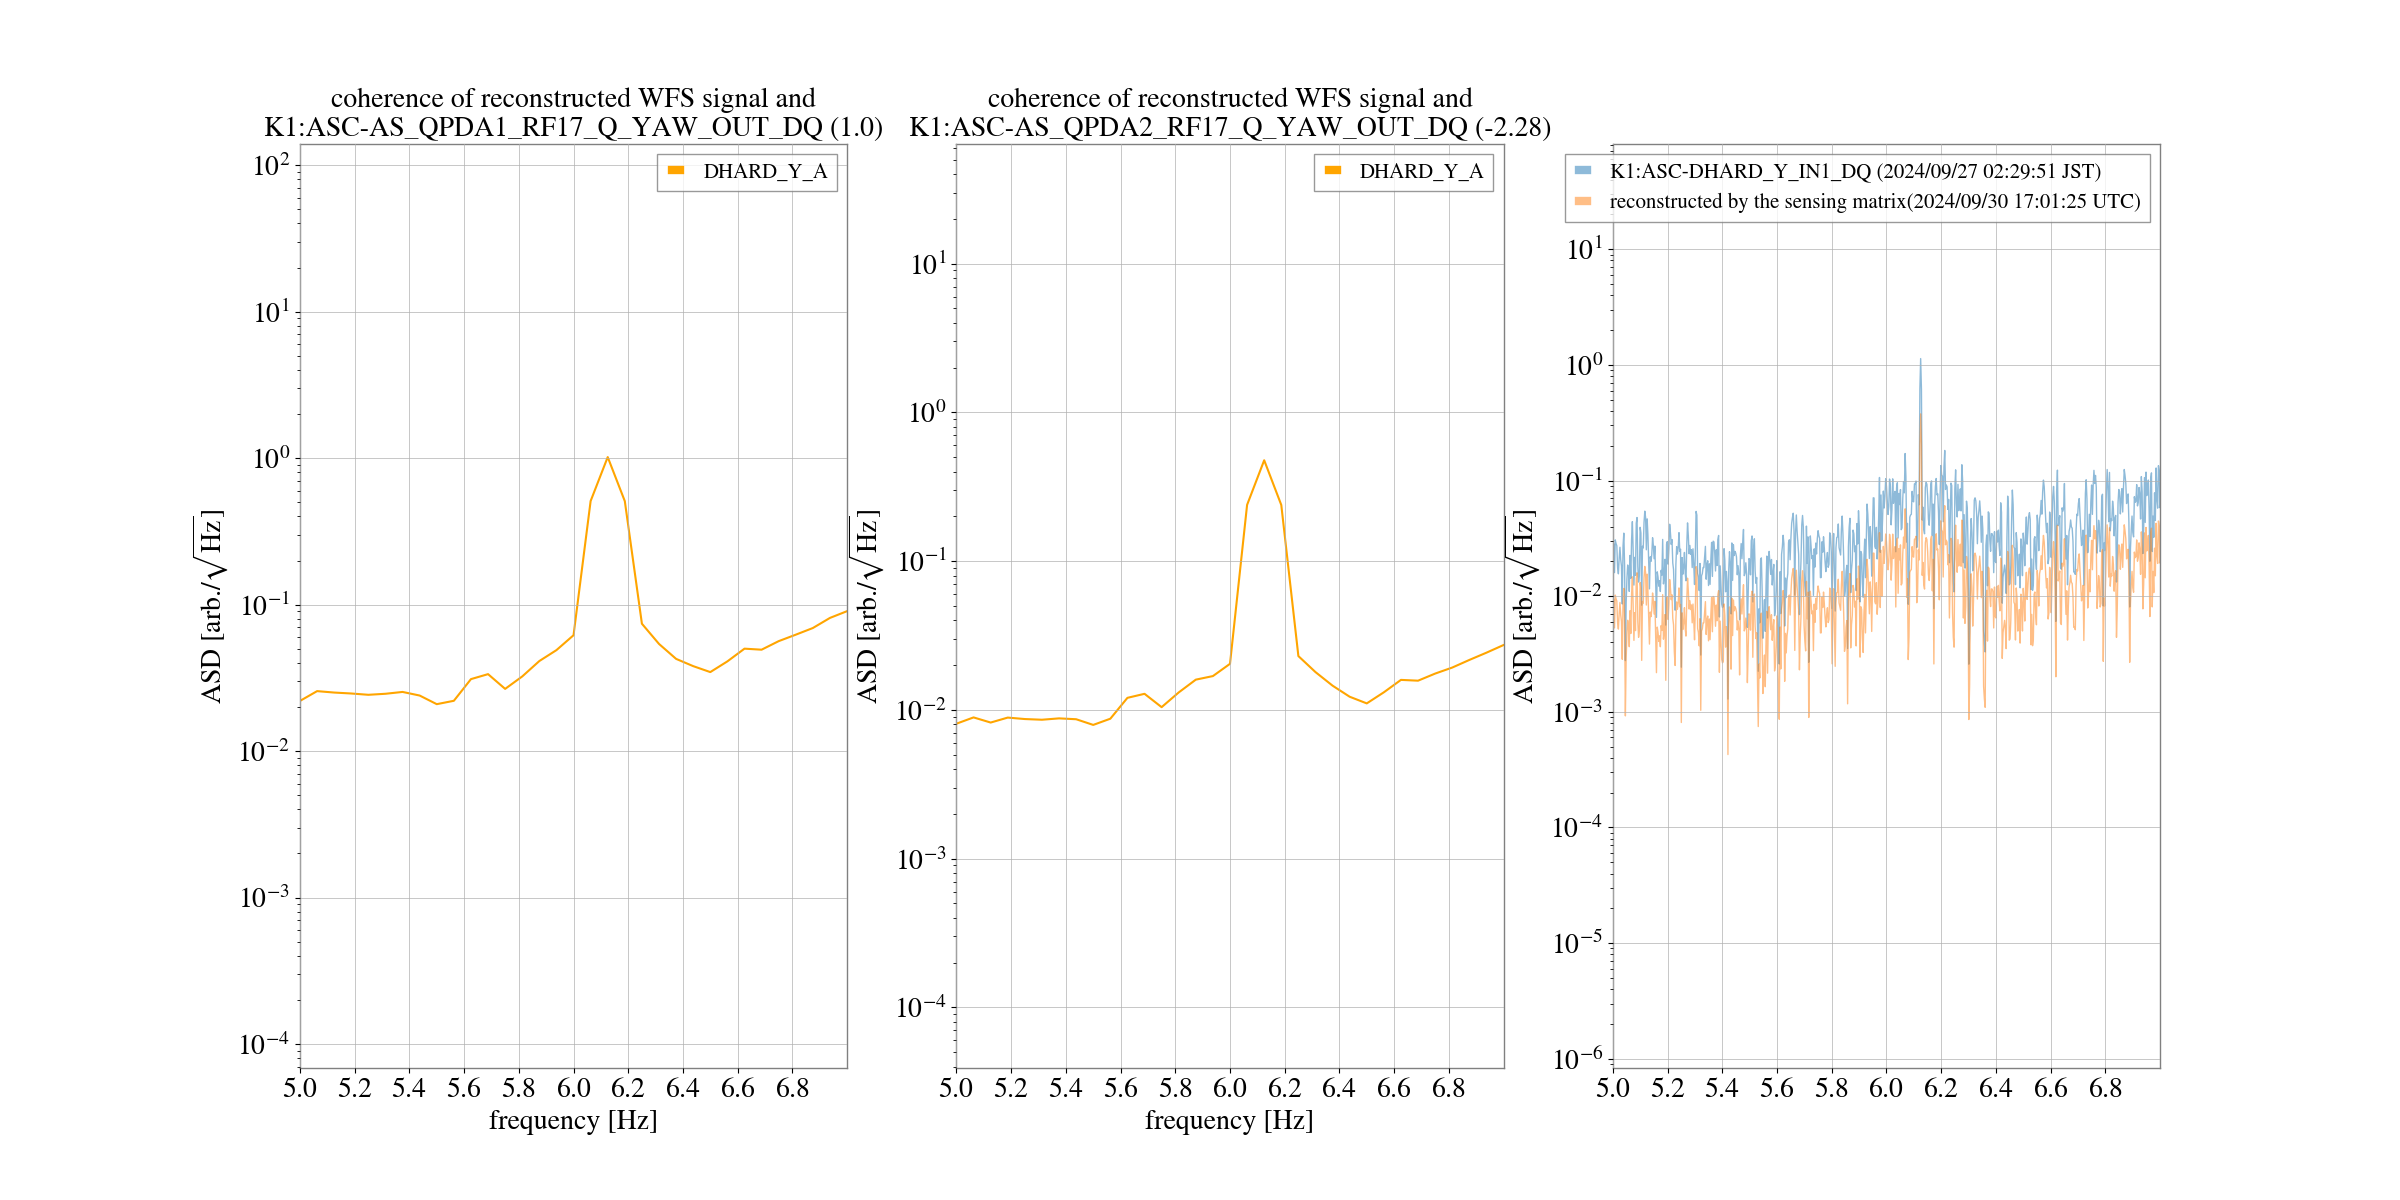
  3. Compute the reconstructed WFS signal
    y(t)=iAi*xi(t)y(t) = \sum_i A_i * x_i(t)
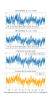
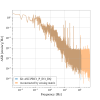
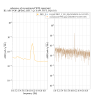
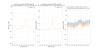
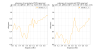
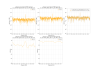
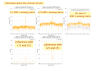
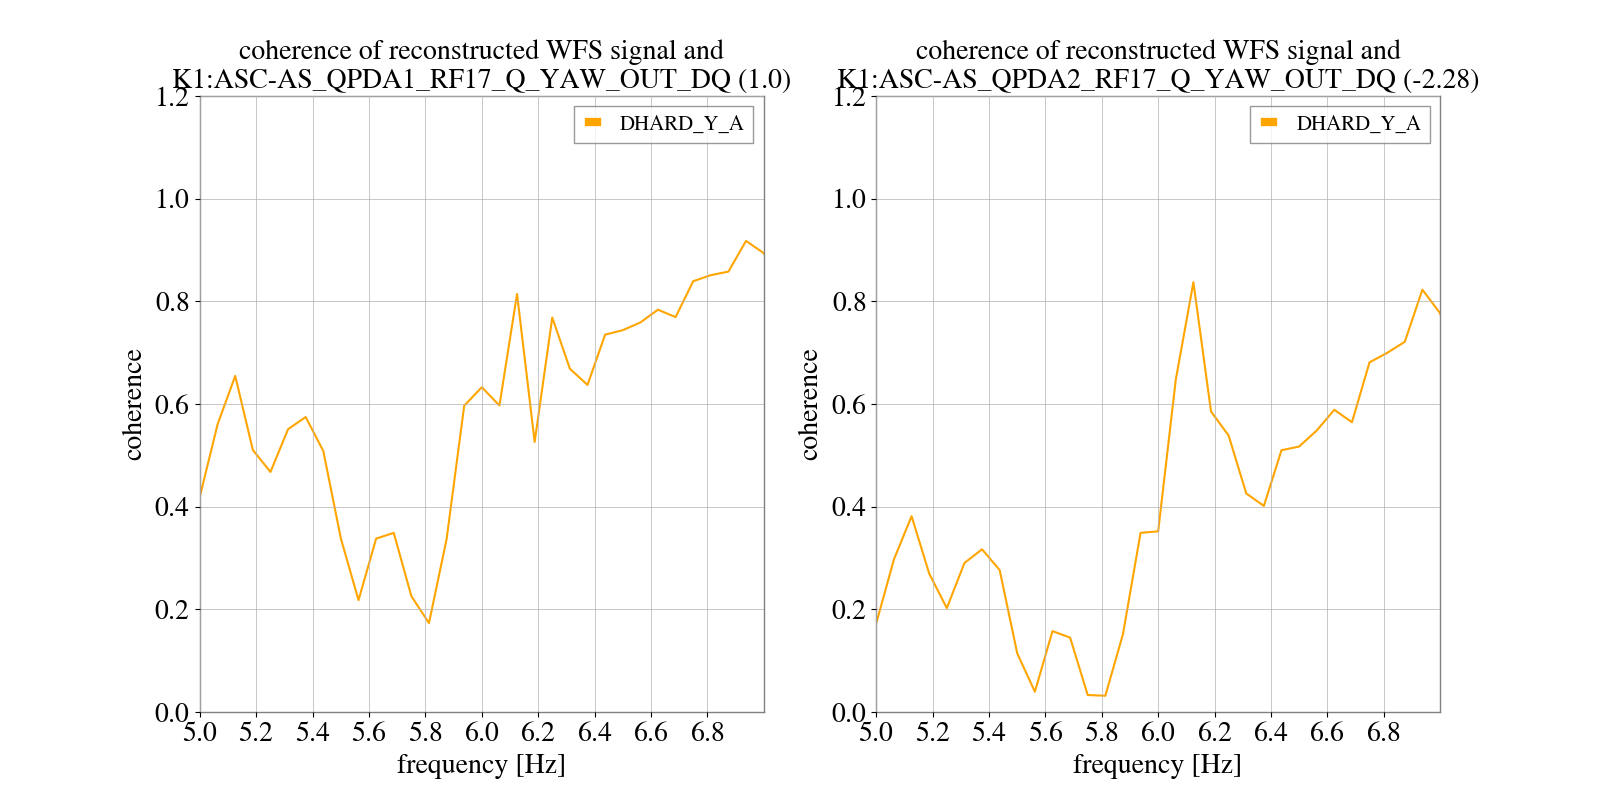
    where A_i is the sensing matrix value and x_i(t) is the RFPD signal for WFS.
  4. Plots the data, such as timeseries, spectrum, coherence.
    1. The genrated plots are stored in /users/Commissioning/data/ASC/2024/sensingmatrix/0927/fig . The directory path is decideded by the date of running the script.

I finished the implementation until the spectrum. I attached the plots. I will implement the coherence on Monday if possible.

Images attached to this report
Comments to this report:
hirotaka.yuzurihara - 17:03 Monday 30 September 2024 (31155) Print this report

This is a continuous work.

I finished the most part of the script development. The appearance has the room to improvement. Please let me know comments.

Details

  • I added the plots of coherence between the RFPD (or DCPD) signal and the reconstructed WFS signal by usingt the current sensing matrix.
  • I used the past data under the excitation at 2024/09/27 2:29:51 UTC.
    • This time was picked up from the xml file: /users/Commissioning/data/ASC/2024/sensingmatrix/0930/DHARD_Y_6-125Hz_100-cnt_resG.xml 
  • The generated plots are stored in /users/Commissioning/data/ASC/2024/sensingmatrix/0930/fig/
    • I attach the several plots.
    • For PRC1 [fig], the reconstruction seems working well.
    • For DHARD-Y [ASD] [coherence], the reconstructed data is not matched the WFS signal computed by the real time mode (see the third panel of [ASD]). I guess that's because the sensing matrix values and locations are different from the current ones. I will check it tomorrow.
  • The validation of the reconstructed is not yet done. I will perform it tomorrow.

Note for future

  • In the list of RFPD or DCPD signal, there are non-DQ channels such as 'K1:ASC-OMMT2_TRANS_QPDA1_DC_PIT_OUT_DQ' and 'K1:ASC-OMMT2_TRANS_QPDA2_DC_PIT_OUT_DQ', These channels are necessary to reconstruct the OMMT2 TRANS 1 and 2 in future. Currently, I commented out these channels in the script.
  • Now, the Kashiwa cluster is under the maintanance. So, I read the past data by using k1nds0 temporary. So, we can't reconstruct the WFS signals earlier than 2 weeks. After the Kashiwa cluster is available, the past data will be available.
Images attached to this comment
hirotaka.yuzurihara - 12:32 Tuesday 01 October 2024 (31164) Print this report

I attach one of the example reconstructed by the script (fig). I confirmed that the used sensing matrix was not updated from 2024/9/27, and the reconstructed signal is consistend with the signal computed by the real time model (see right top panel).

Images attached to this comment
hirotaka.yuzurihara - 12:36 Tuesday 01 October 2024 (31165) Print this report

Usage of the script

  1. Edit the script to fit the startuing time of the excitation for each dof
  2. Enter the conda environment. Any environment is OK if gwpy is installed. for example,  conda activate igwn-py39
  3. run the command: /users/Commissioning/scripts/asc/validation_test_WFS_sensingmatrix.py -w CSOFT_P_A
    1. The available dof can be seen with -h optiuon.
  4. After running the script, automatically firefox will open the directory which stores the generated plots.
    1. If you want not to open the firefox, use -n option.

Contents of plot

Images attached to this comment
Search Help
×

Warning

×