Reports 1-1 of 1 Clear search Modify search
VIS (General)
ryutaro.takahashi - 16:59 Tuesday 20 August 2024 (30871) Print this report
Check of TAMA stack

I checked the status of the stack in the MC2 chamber of TAMA.

  • The MCe suspension, two steering mirrors, and a beam dumper are on the optical bench.
  • All screws to fix the bellows are not touching the lower SUS blocks.
  • The optical bench sits on two stack legs directory and one stack leg through the support bolt with a small gap.
  • The cables from the suspension are anchored on the SUS blocks.
Images attached to this report
Comments to this report:
ryutaro.takahashi - 17:45 Tuesday 03 September 2024 (30959) Print this report

[Komori, Takahashi]

We started the test of the stack in TAMA.

  • The small optics (two steering mirrors and a beam dumper) were removed from the optical bench. The MCe mirror was locked with the EQ stoppers.
  • The support bolt lifting the optical bench was removed. The optical bench is sitting on the three stack legs directory.
  • The cables from the suspension and the anchors on the SUS blocks were removed.
  • The shaker and an accelerometer (TEAC 707LFZ) were set vertically on the baseplate with an M12 bolt. The other accelerometer (TEAC 710) was set vertically on the optical bench with a M6 stop screw.
Images attached to this comment
kentaro.komori - 0:04 Wednesday 04 September 2024 (30966) Print this report

We will use geophones (L4Cs) for the transfer function measurement tomorrow.
Two horizontal L4Cs are located at NAOJ, and I will bring two vertical ones from Hongo.

I checked the performance of the two vertical L4Cs (named V2 and V3) by placing them in nearly the same location and measuring seismic noise.
The displacement spectra are shown in Fig.1, and the relative gain and coherence are represented in Fig.2.
Since these sensors should behave identically, the gain should be 0 dB, and the coherence should be unity at all frequencies.

Below 100 Hz, the coherence is nearly unity, and the gain remains constant at around 0.3 dB.
However, some structures and low coherence are observed above 100 Hz.
We expect that these structures will flatten out and the coherence will improve with a small shaker injection.

Images attached to this comment
ryutaro.takahashi - 19:01 Wednesday 04 September 2024 (30976) Print this report

[Komori, Takahashi]

We rearranged the sensor locations as follows.

  • Geophone (L4-C) V2, H1, and ACC (TEAC710) were put on the baseplate.
  • Geophone (L4-C) V3, H2, and ACC (TEAC710Z) were put on the optical bench.

We measured the transfer functions (V3/V2, H2/H1, 710(vertical)/710Z(Z),  710(horizontal)/710Z(Y)) in the following cases. The results will be reported later.

  • 3-layer stack: Original
  • 2-layer stack: The upper two SUS blocks were connected with the sidebars.
  • 1-layer stack: The three SUS blocks were connected with the sidebars.
Images attached to this comment
kentaro.komori - 1:28 Thursday 05 September 2024 (30981) Print this report

We would like to quickly report the main tentative results.

Figure 1 shows the measured and modeled vertical transfer functions of the stack with 1, 2, and 3 stages.
Figure 2 represents the corresponding coherence data.

To reconstruct these results, we needed to apply compensation factors of 19, 17.5, and 15, respectively, to the designed spring constants (SC).
These factors are similar to that used to reconstruct the transfer function of the current OMC stack, suggesting that the underlying mechanism may be the same.

The important implications are as follows:

  • We can still model the vertical transfer functions using a point-mass approximation.
  • It is possible to shift the second peak, which is around 80 Hz and overlaps with other sharp resonances around the OMC, to above 100 Hz.
  • The sidebars do not introduce additional resonances, at least below 200 Hz.

We will measure the gain difference between the two sensors used to estimate the transfer functions tomorrow.
The currently shown transfer functions should be divided by that to compensate for the sensor difference.

Images attached to this comment
ryutaro.takahashi - 15:26 Thursday 05 September 2024 (30994) Print this report

[Komori, Takano, Takahashi]

The explanation of the ACC locations was incorrect yesterday. TEAC710Z was put on the baseplate and TEAC710 was put on the optical bench. We measured the transfer functions (V3/V2, H2/H1, 710(vertical)/710Z(Z),  710(horizontal)/710Z(Y)) of the 2-layer stack that the lower two SUS blocks were connected with the sidebars. Finally, we compared V2&V3, H1&H2, and 710&710Z putting them in the same place. The results will be reported later. 

Images attached to this comment
kentaro.komori - 2:03 Friday 06 September 2024 (31004) Print this report

[Takahashi, Takano, Komori]

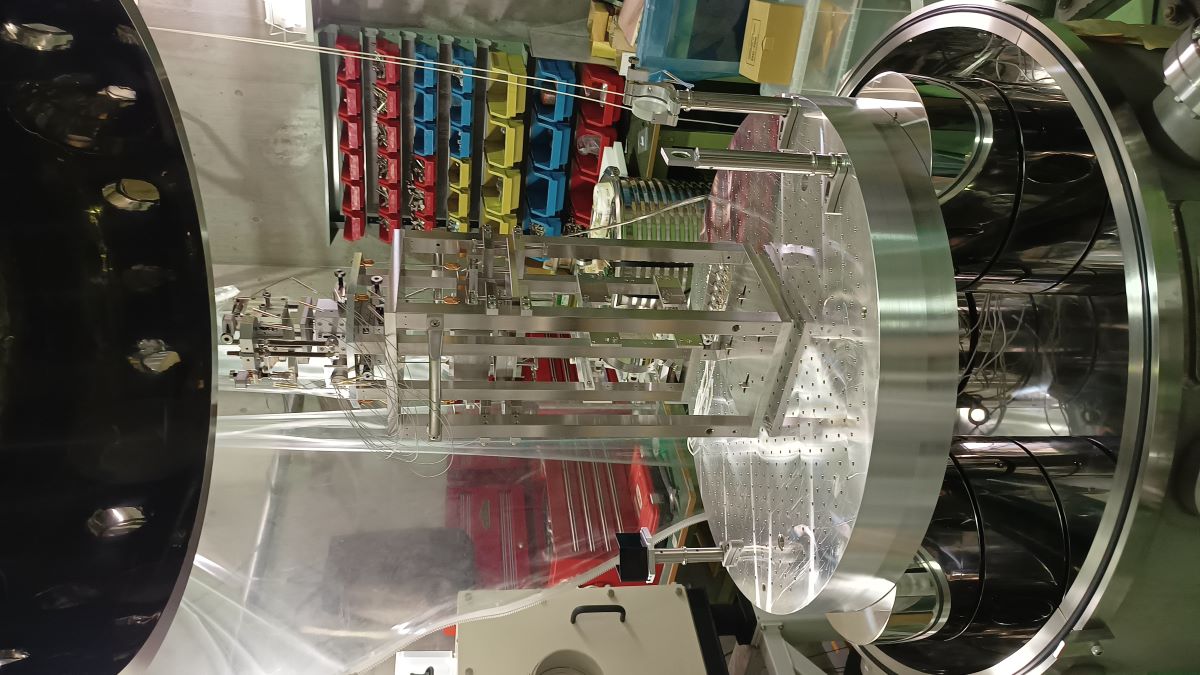
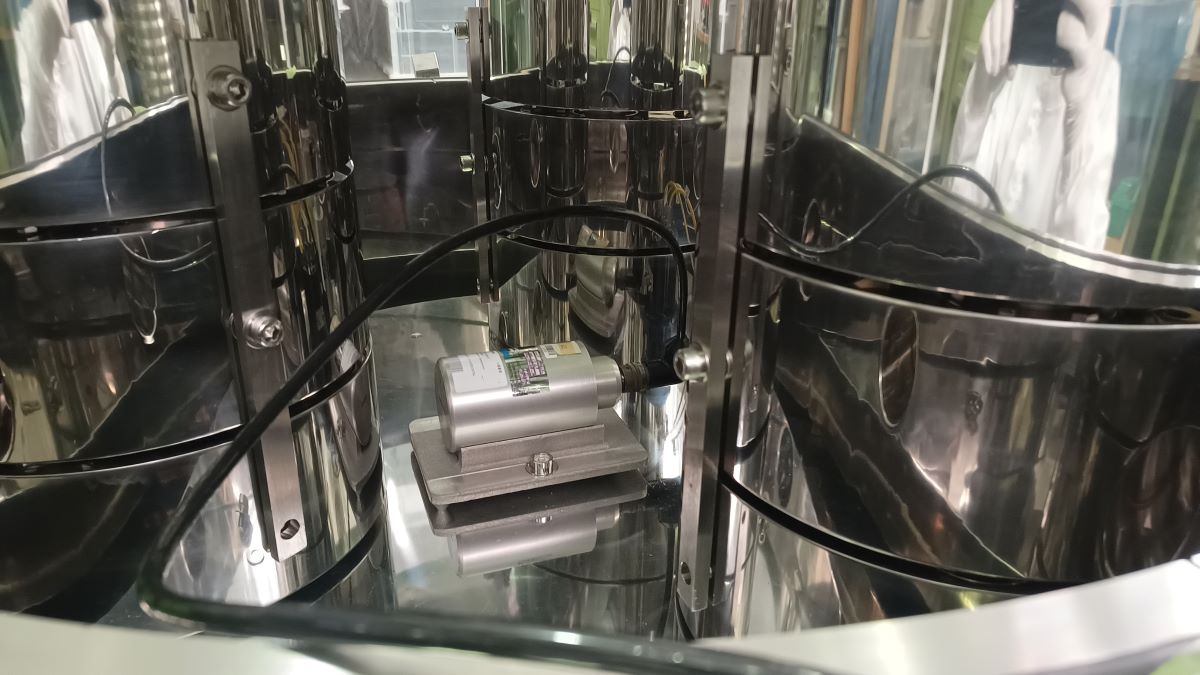
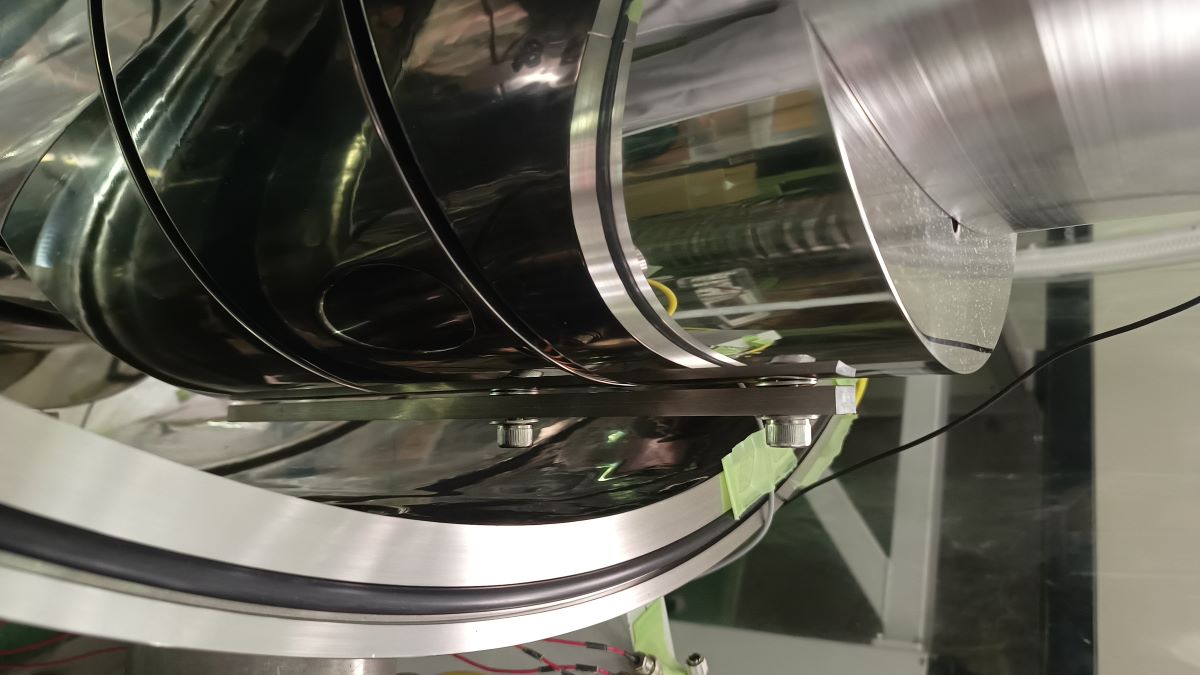
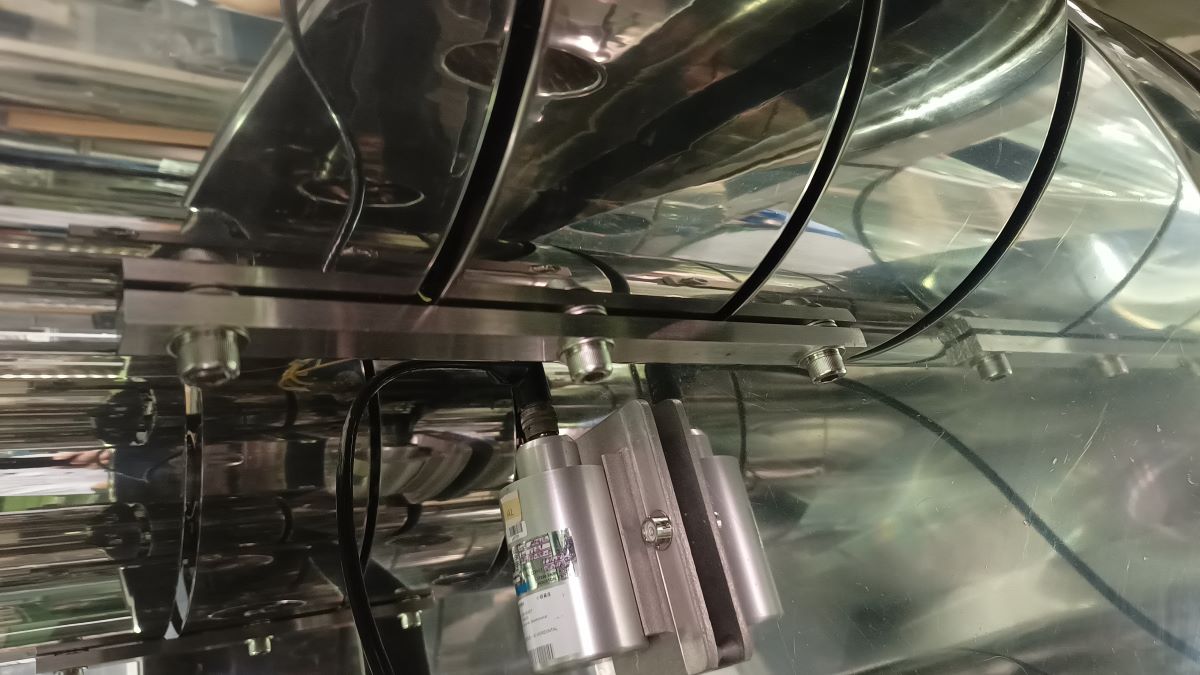
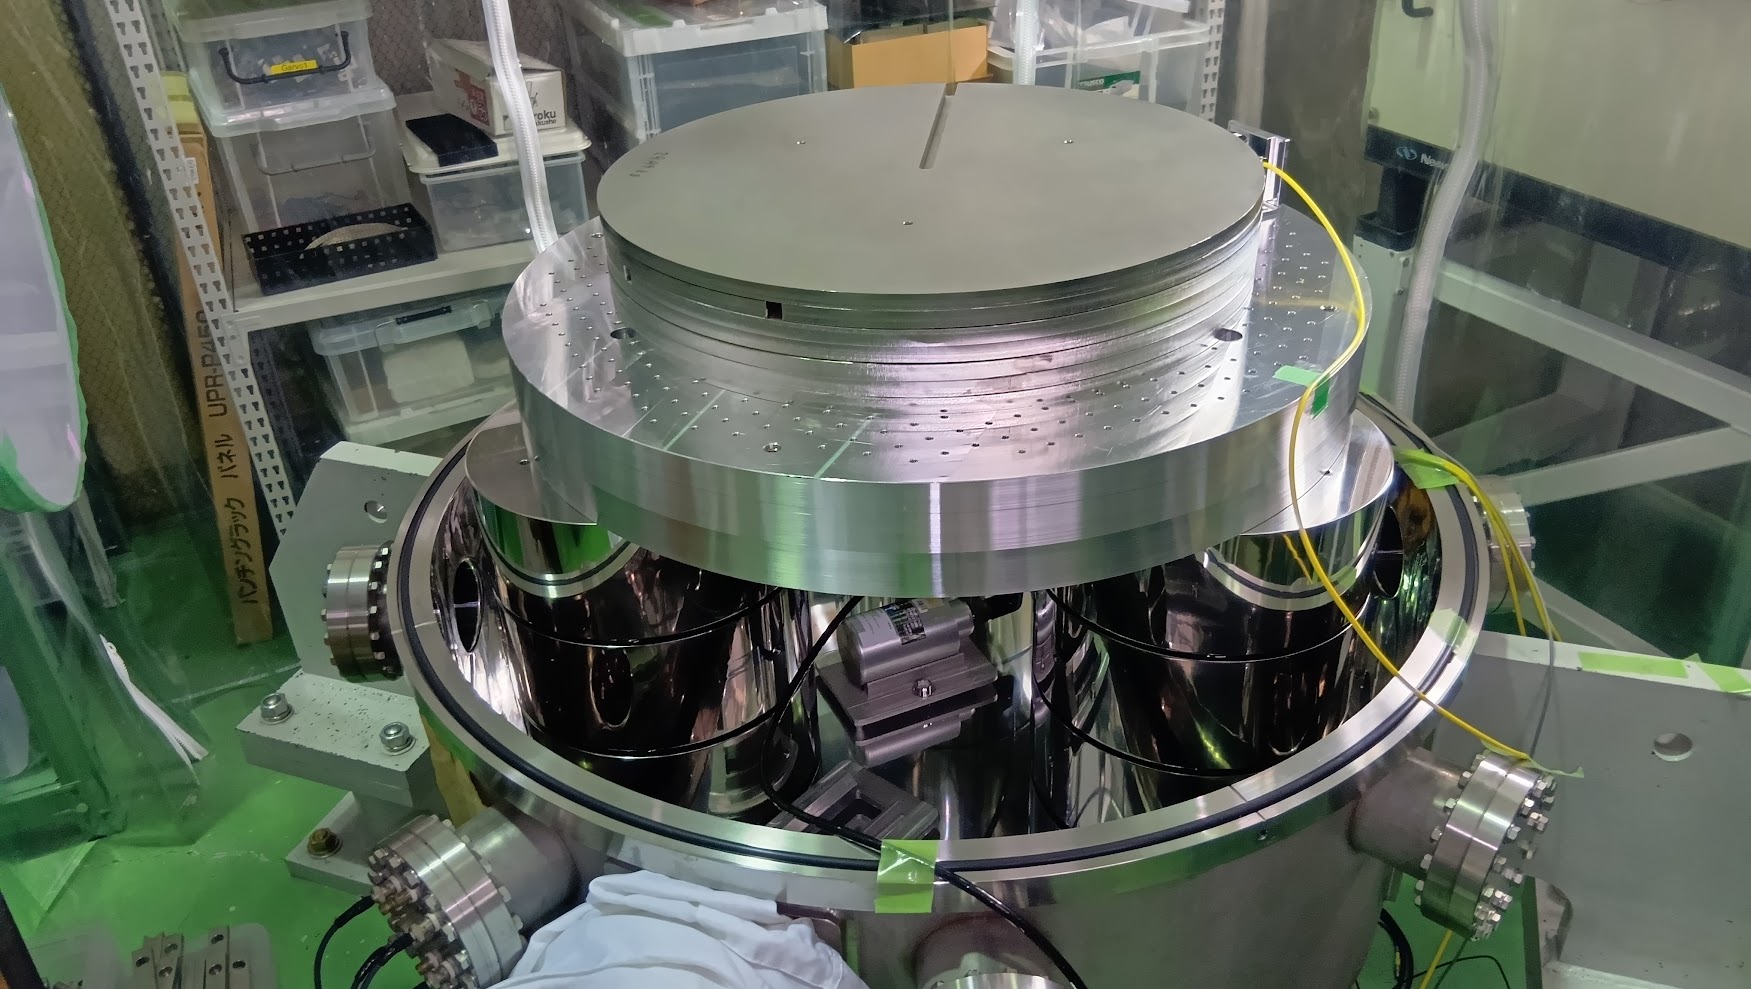
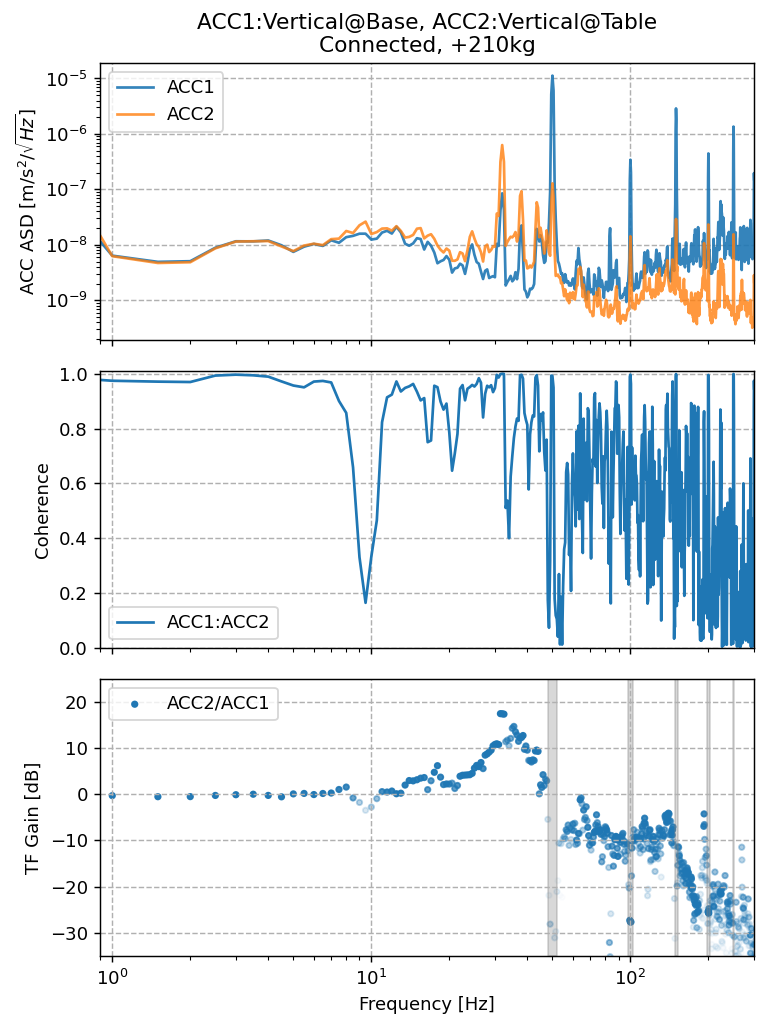
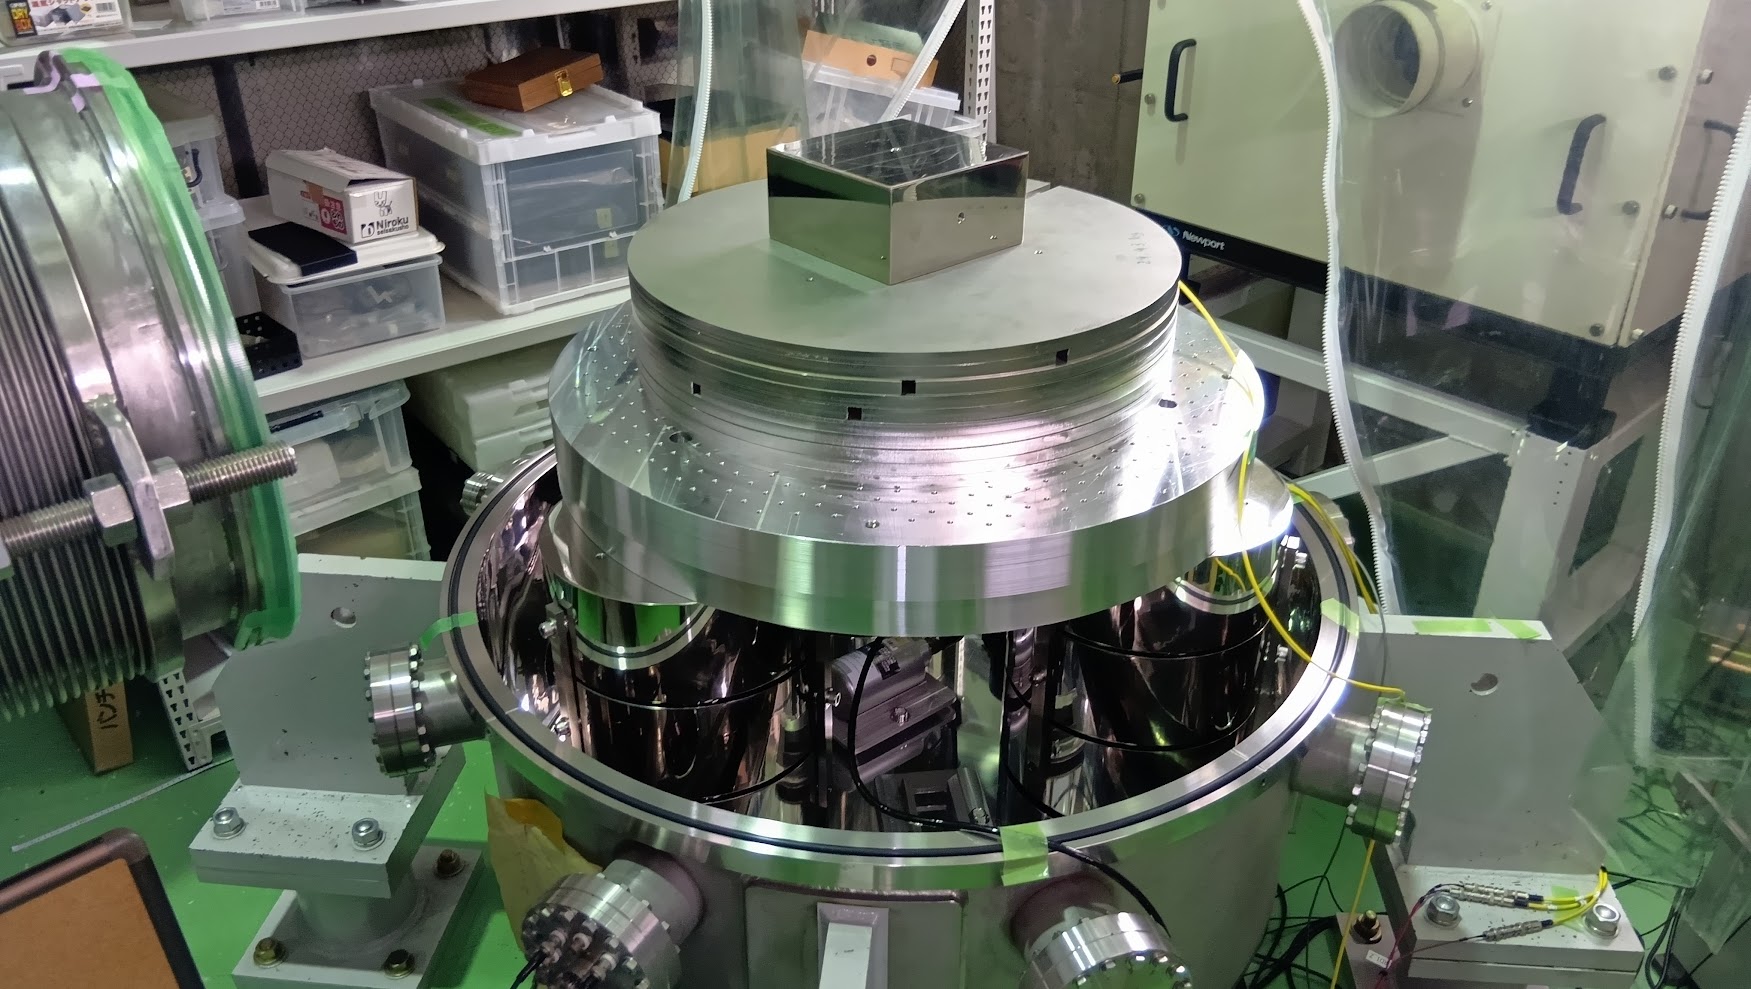
We measured additional transfer functions with the lower two stages of the stack connected.
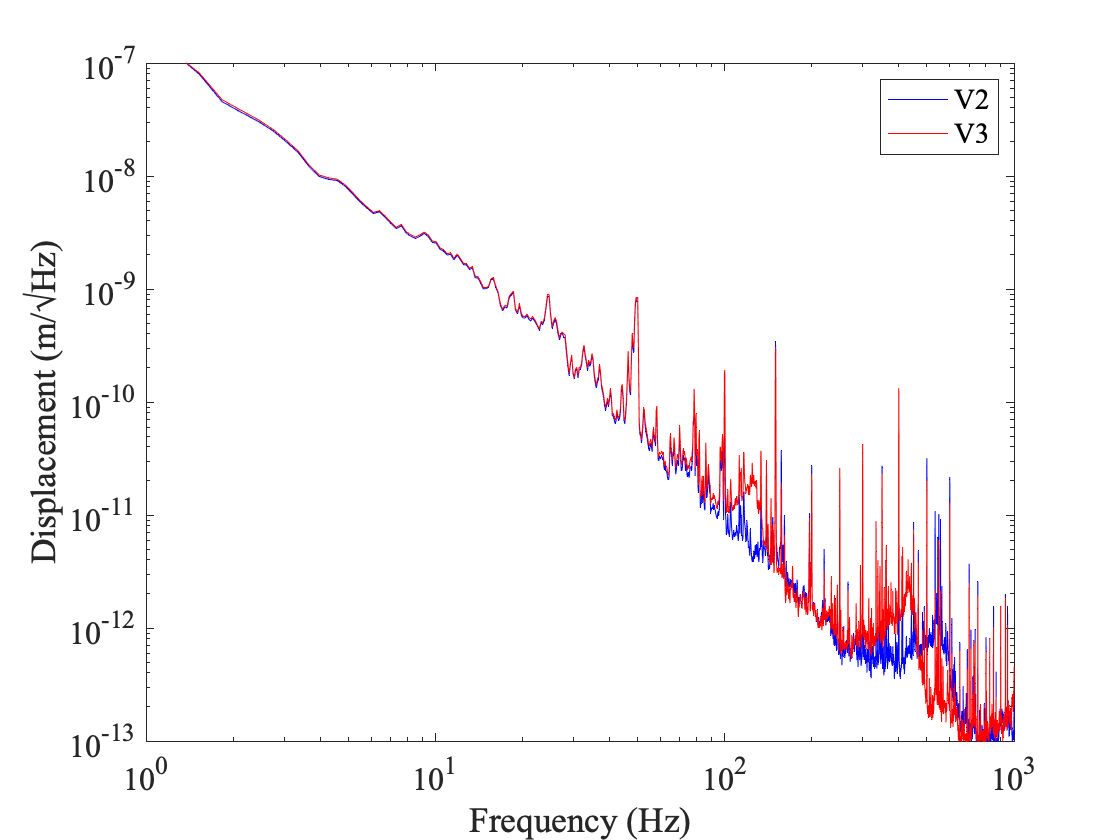
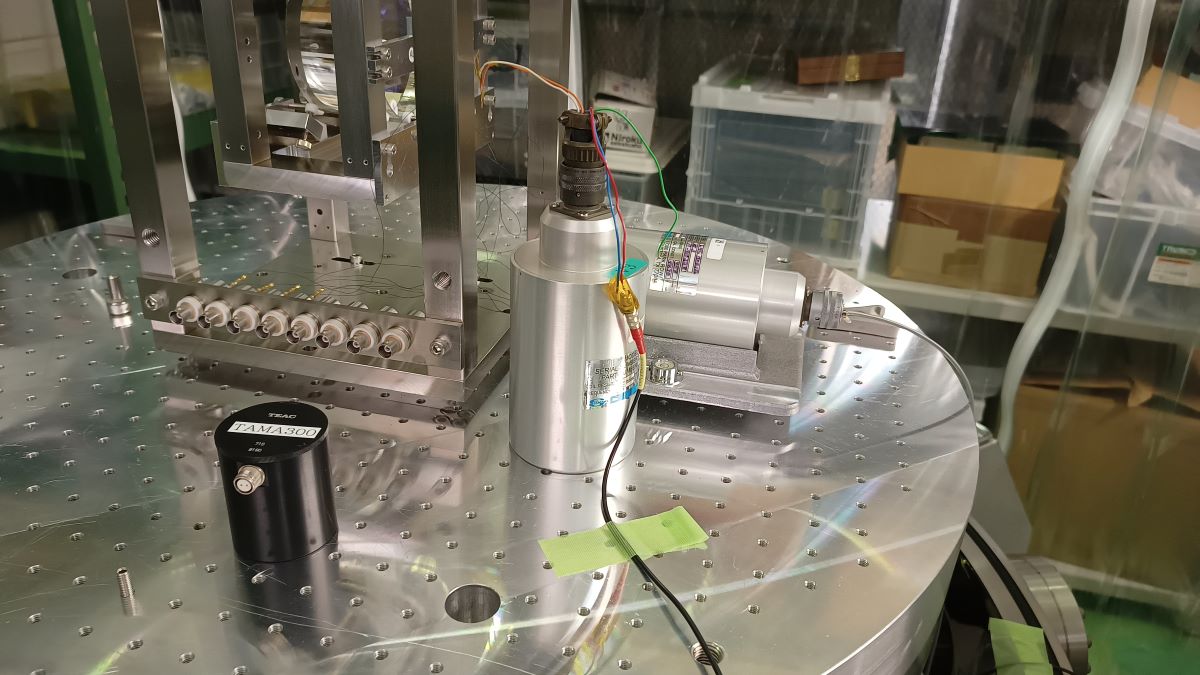
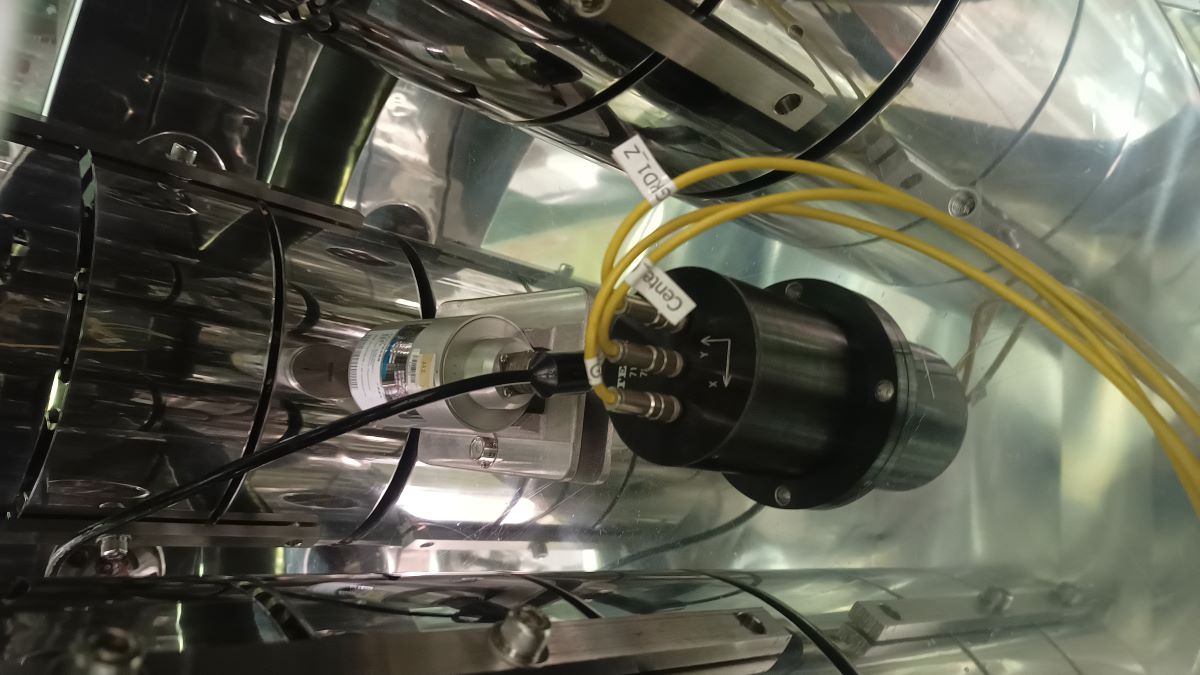
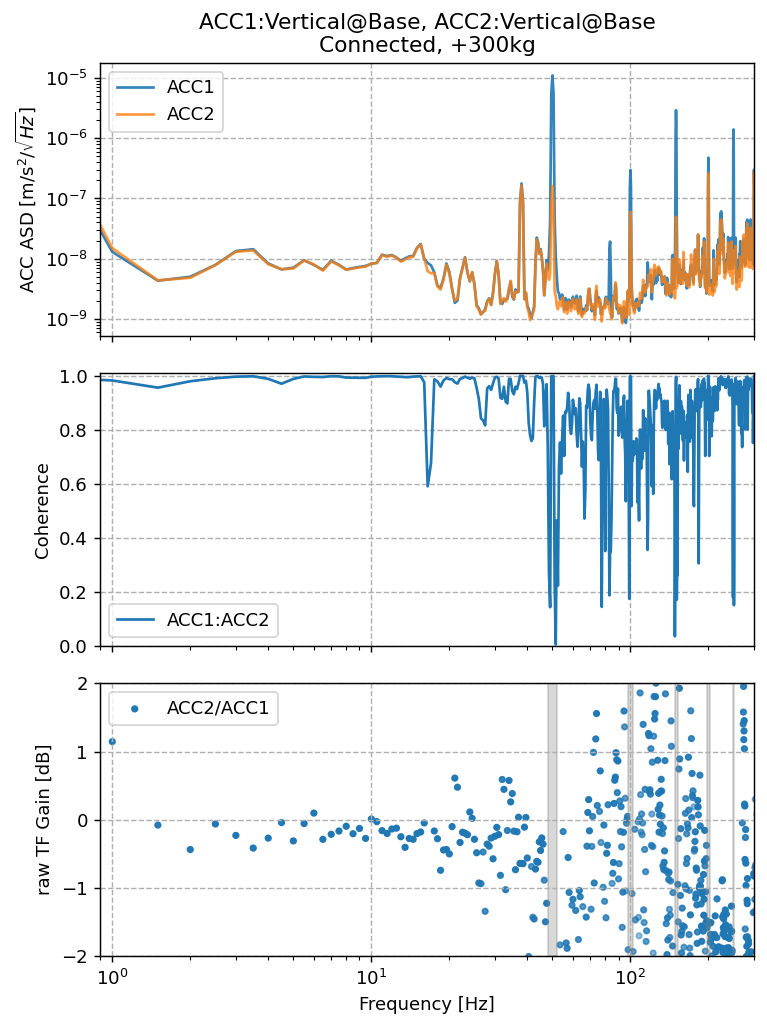
In addition, we compared the spectra of the two sensors by placing both on the floor.
These data were used to compensate for the sensor differences when measuring the stack's transfer functions.

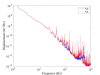
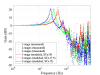
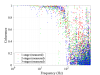
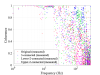
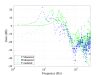
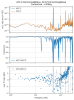
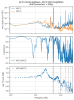
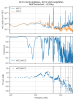
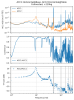
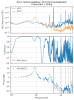
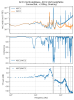
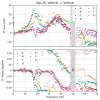
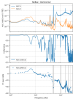
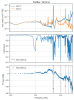
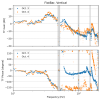
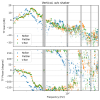
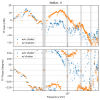
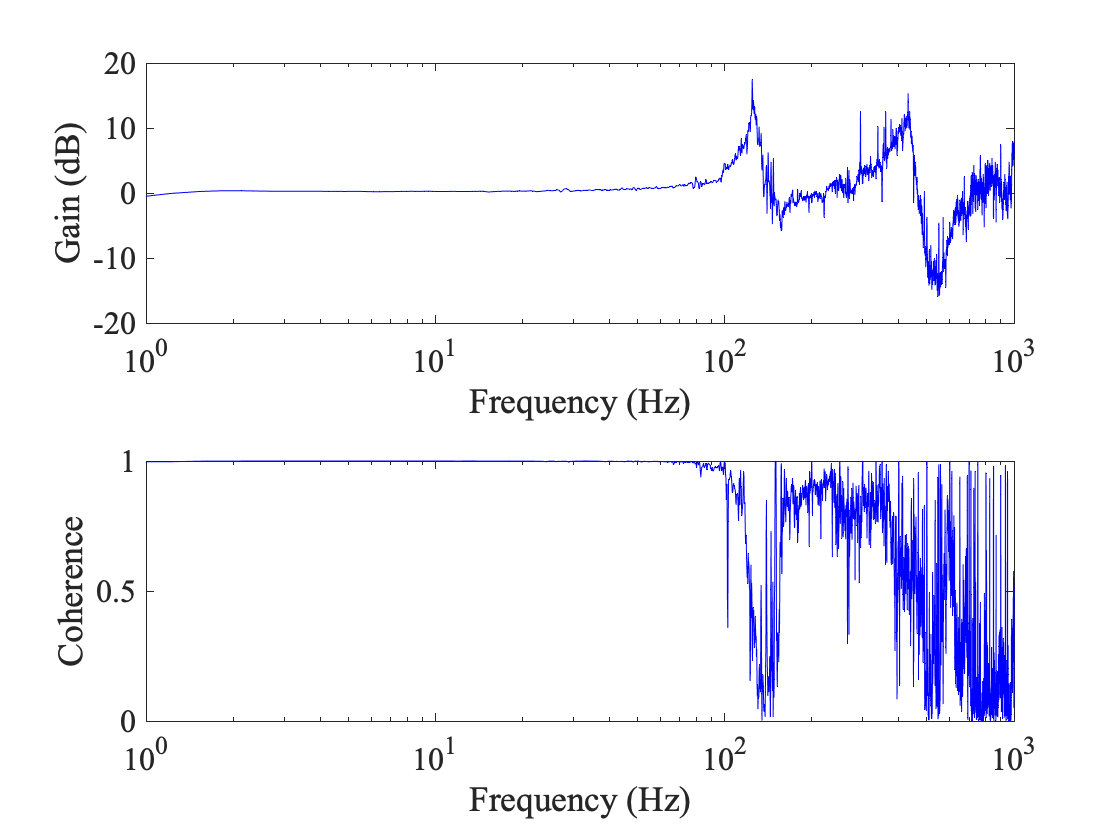
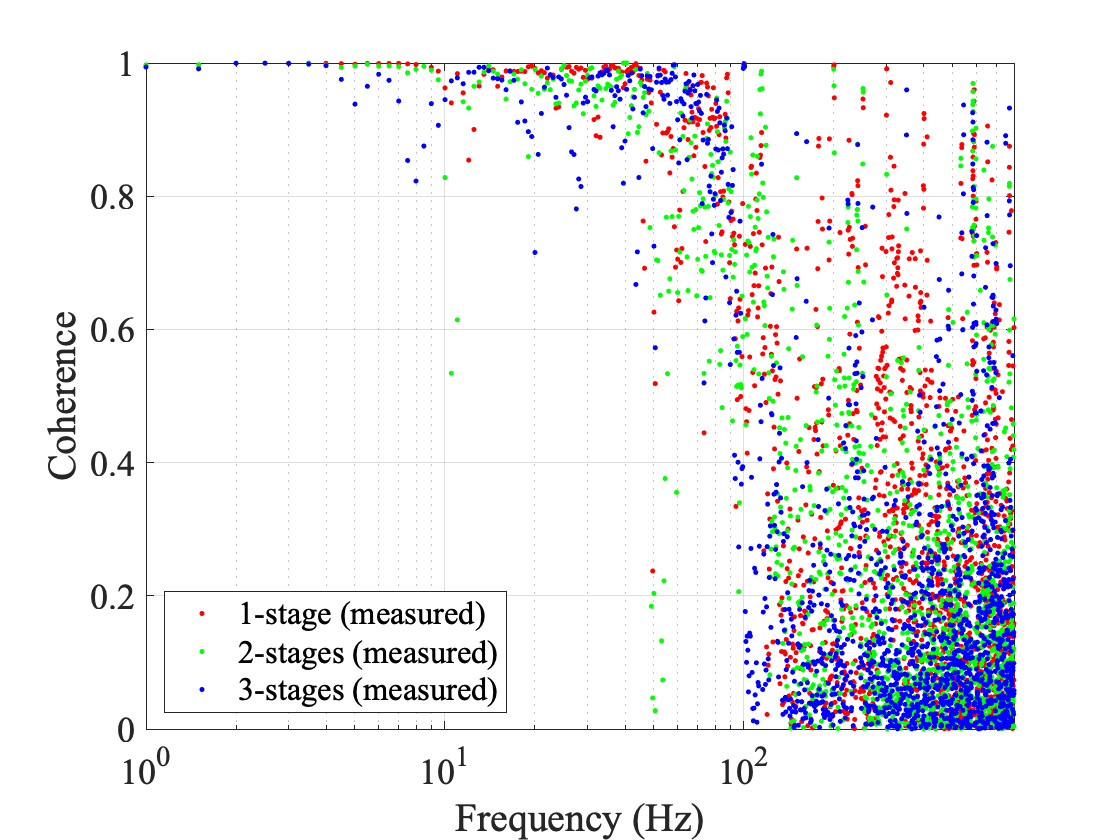
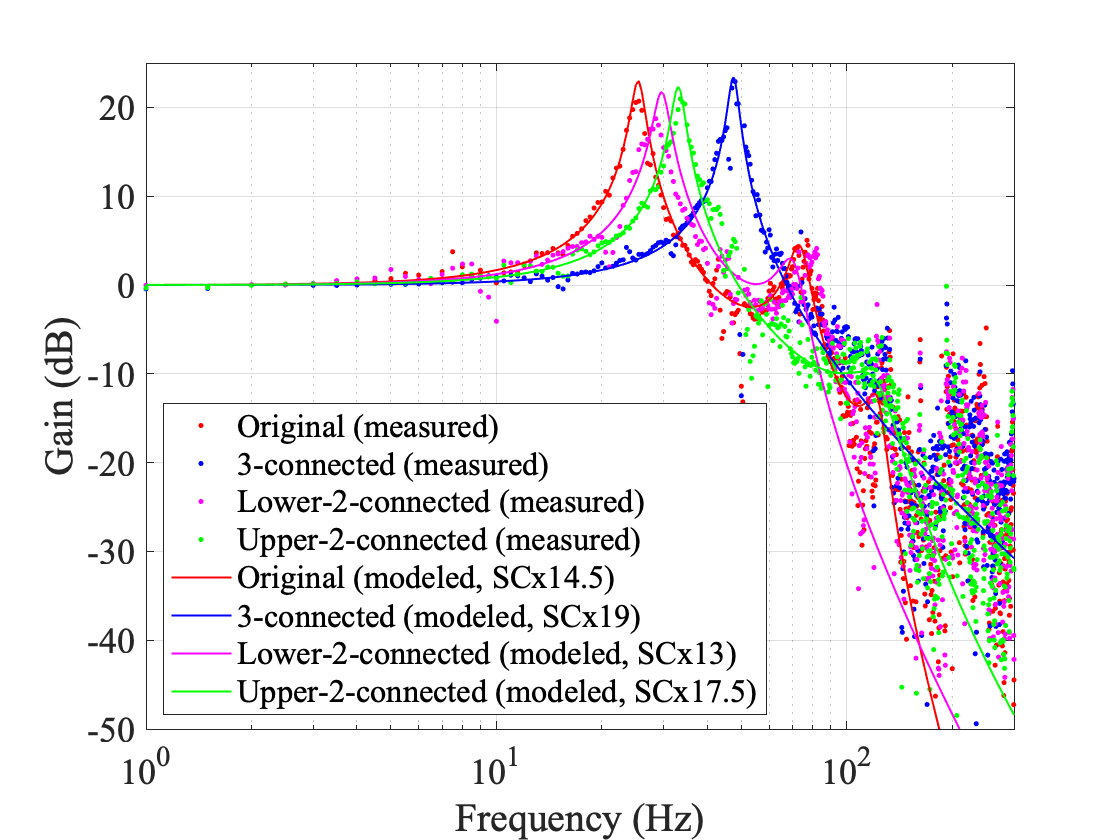
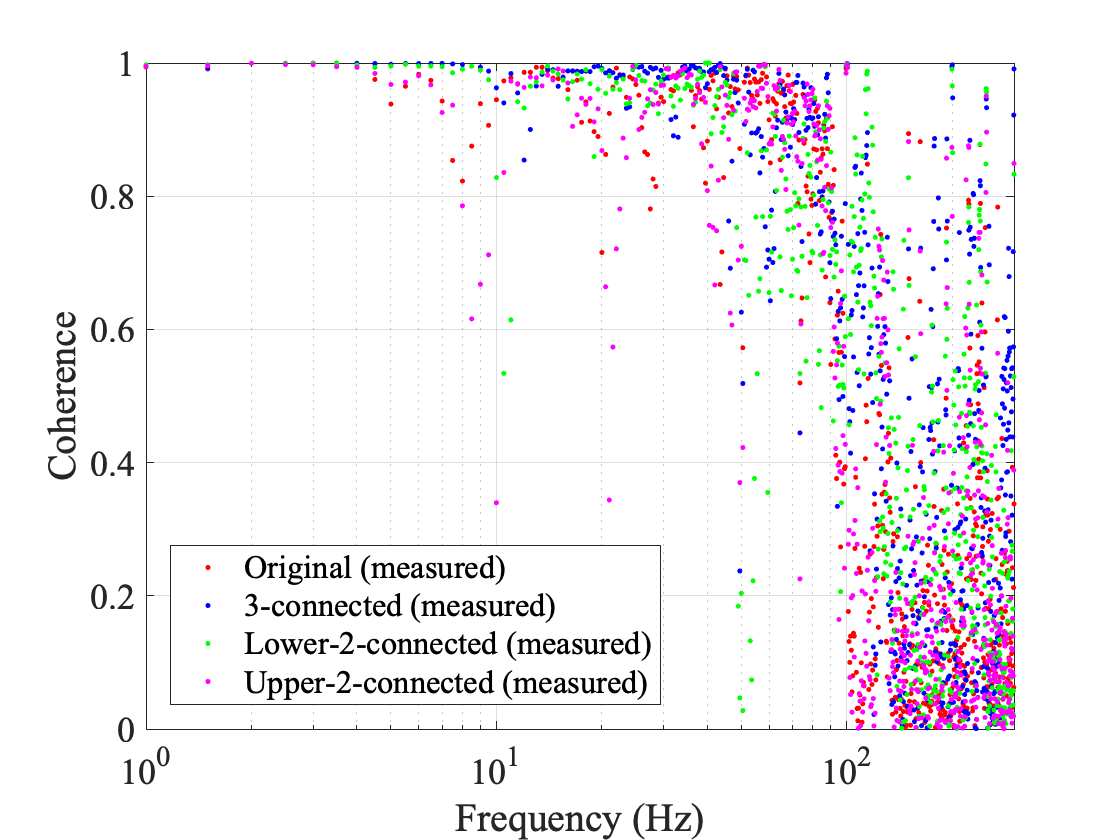
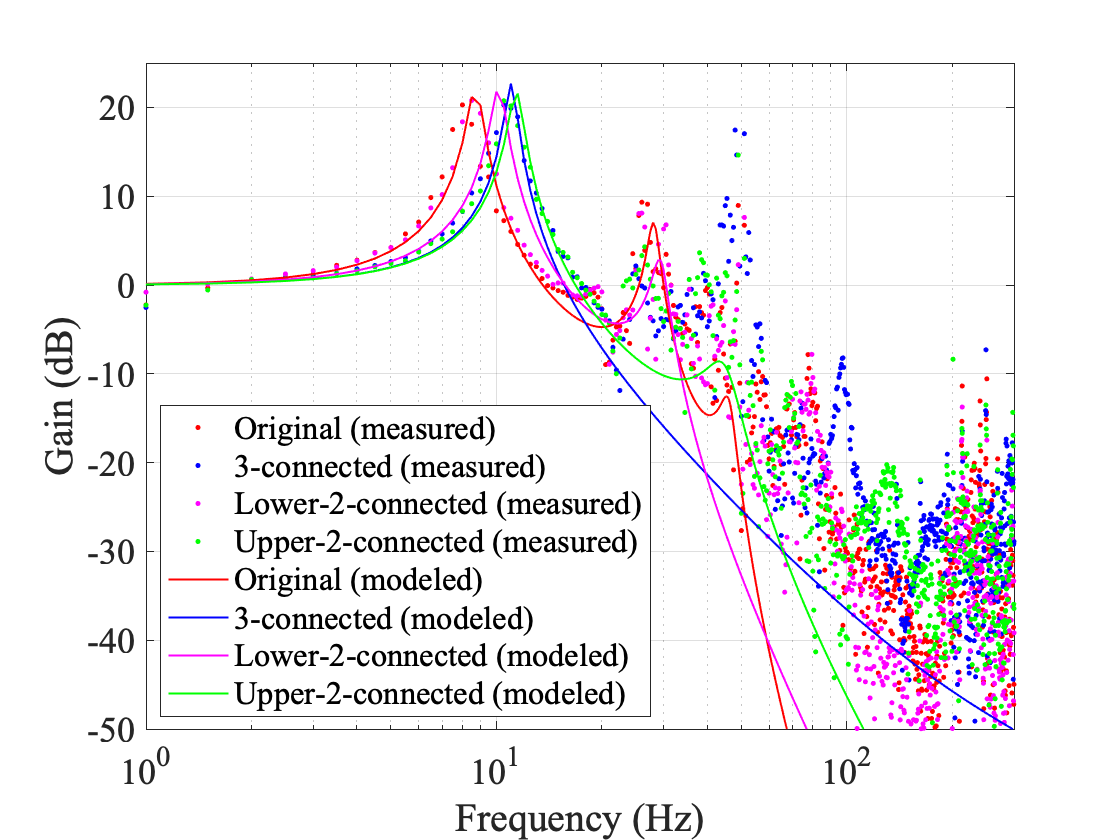
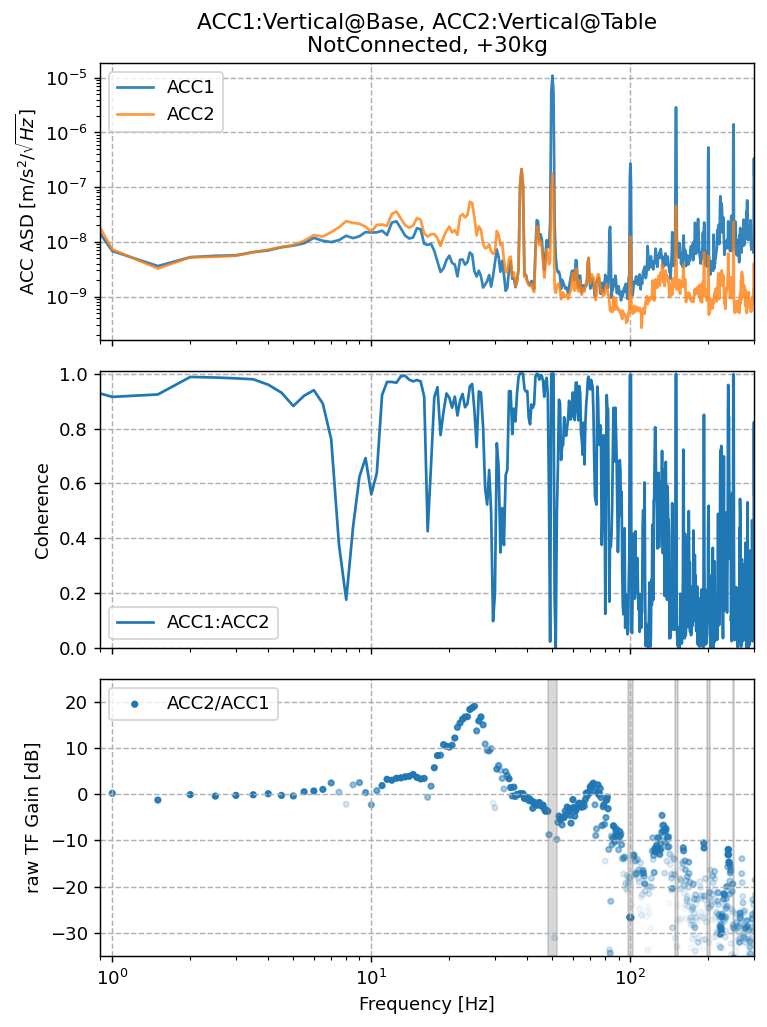
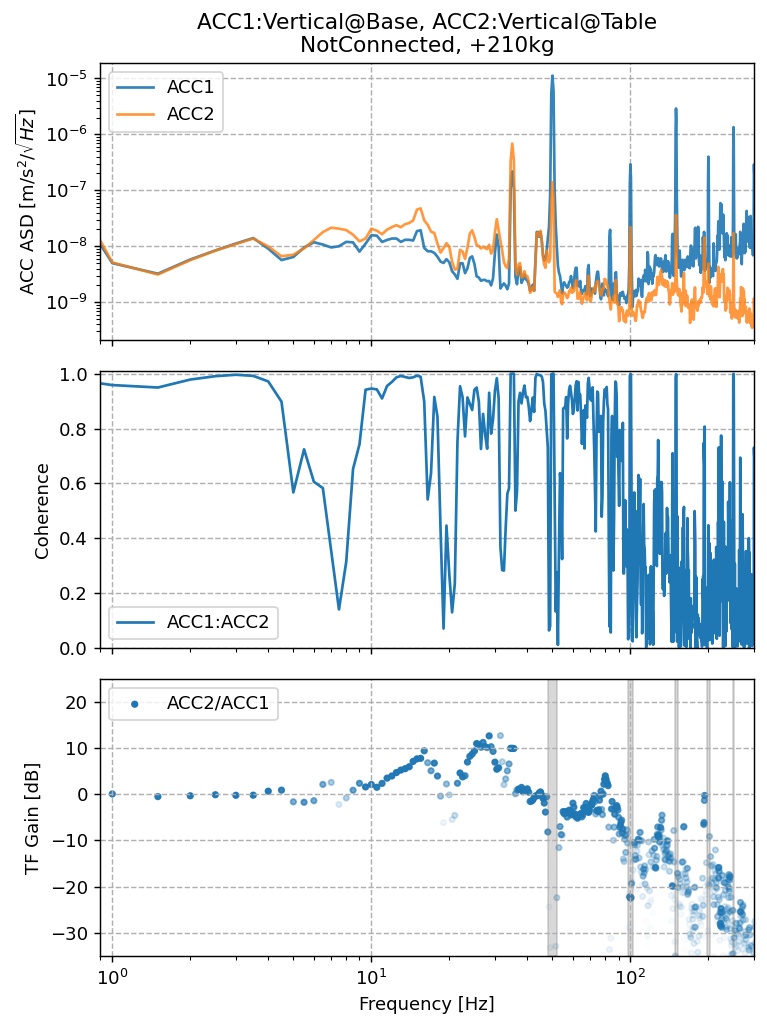
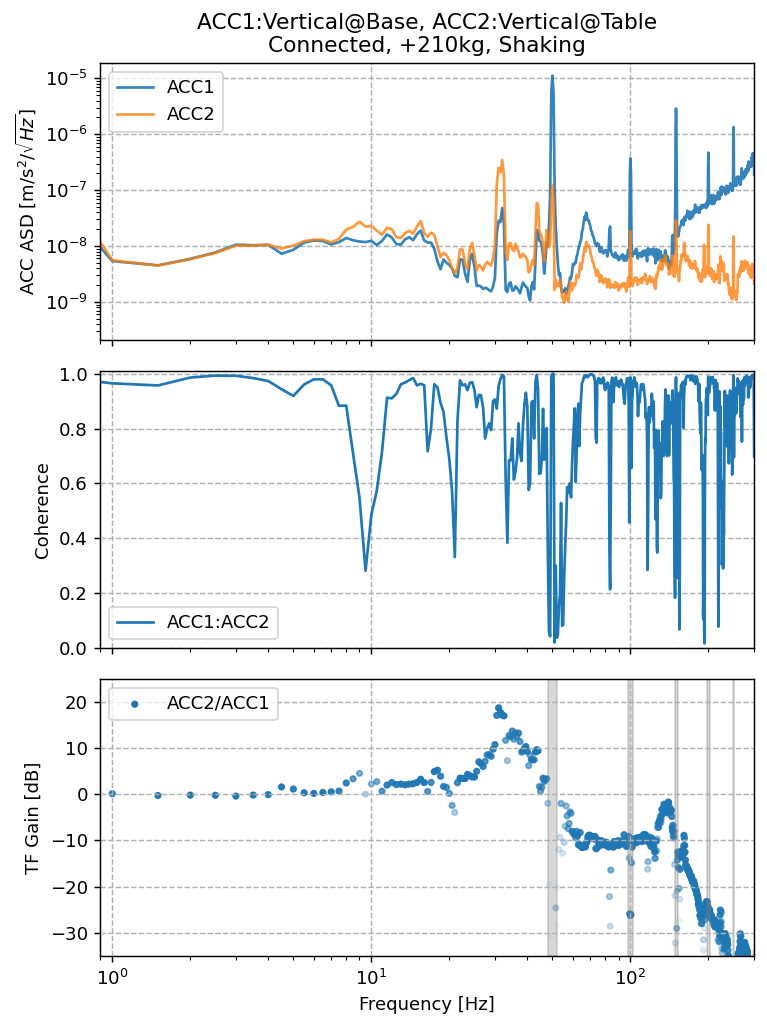
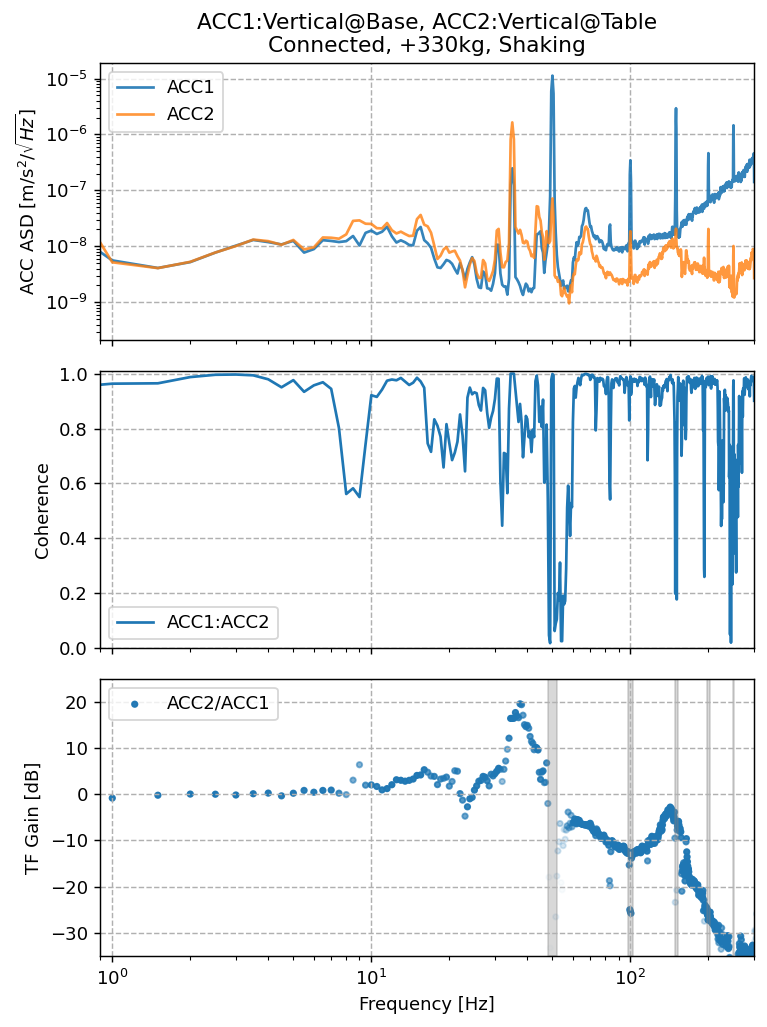
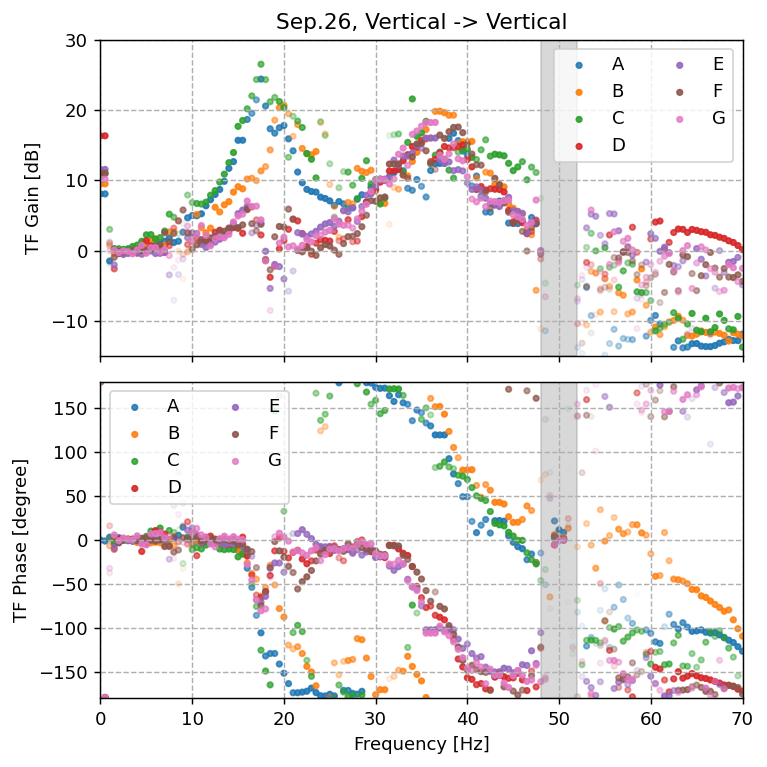
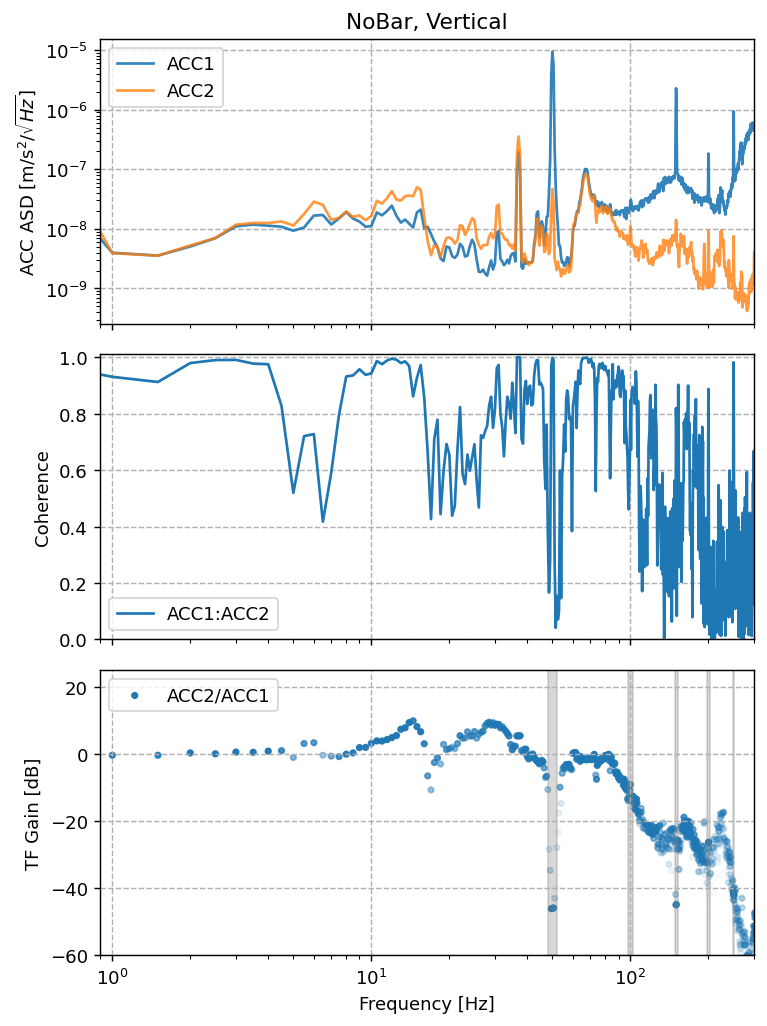
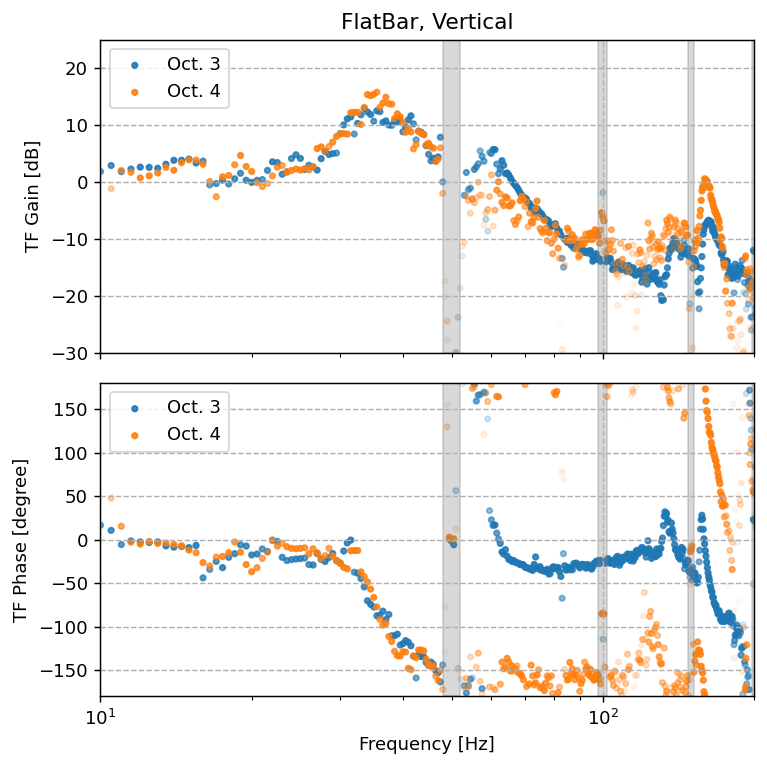
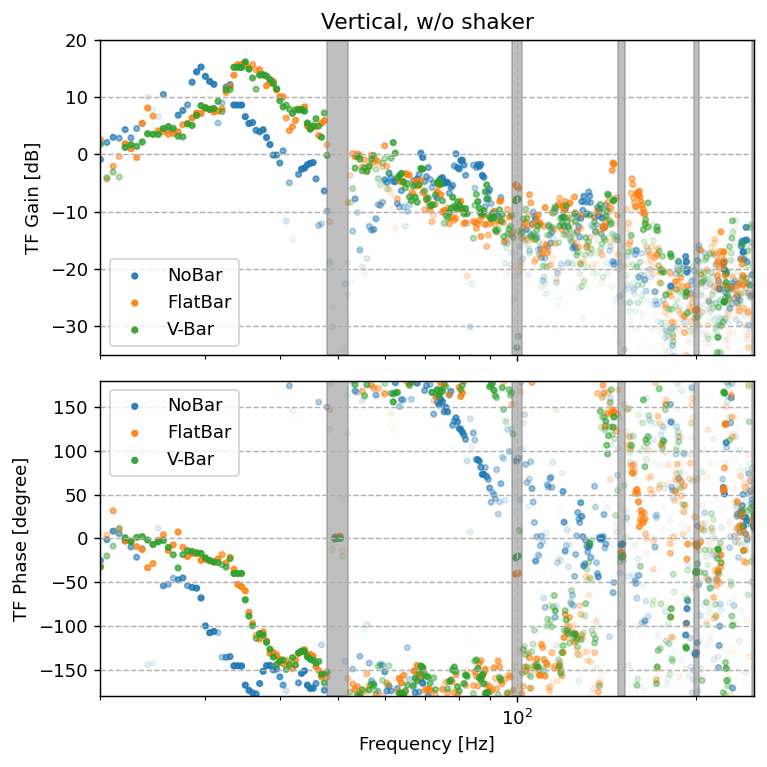
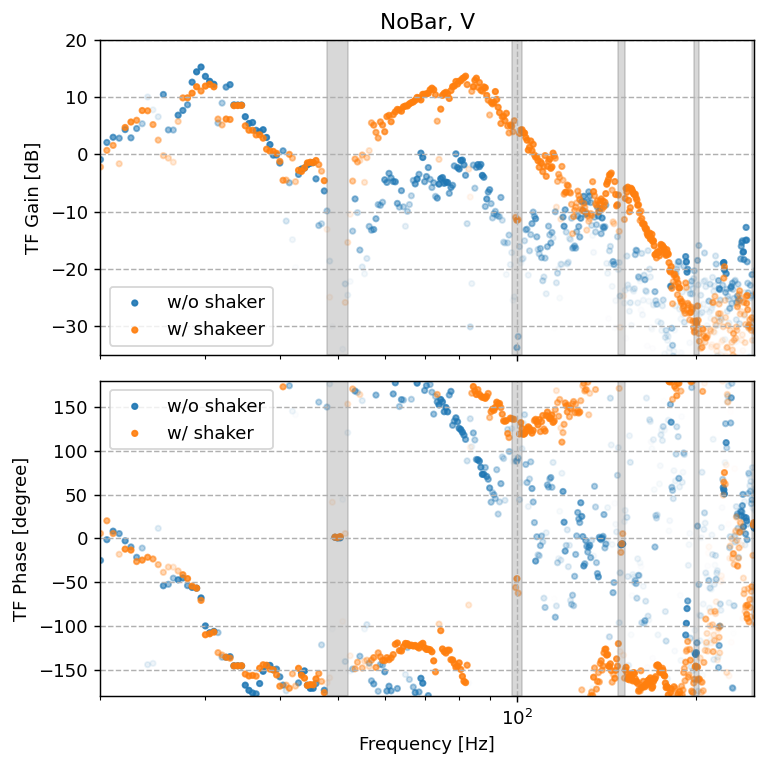
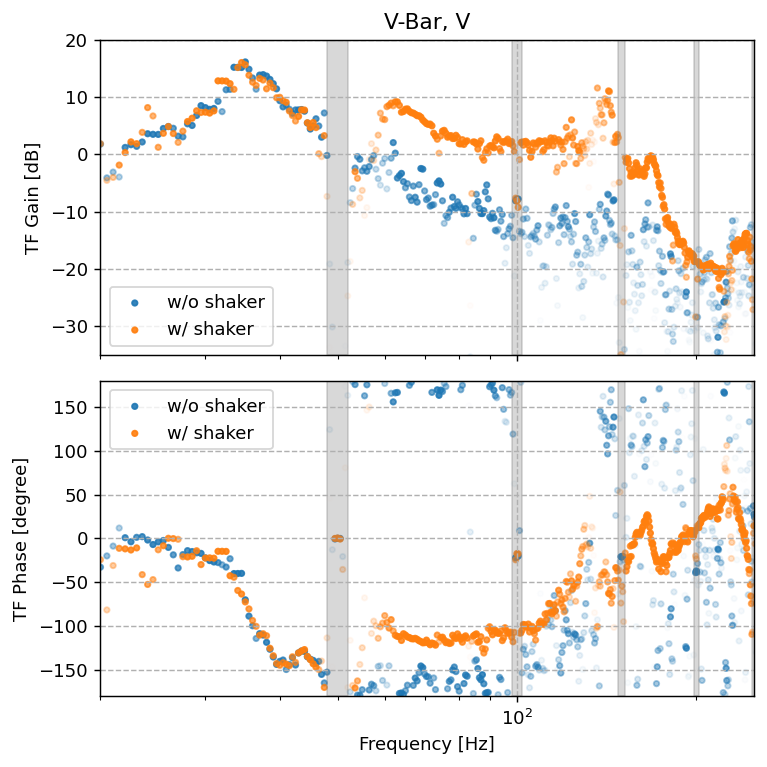
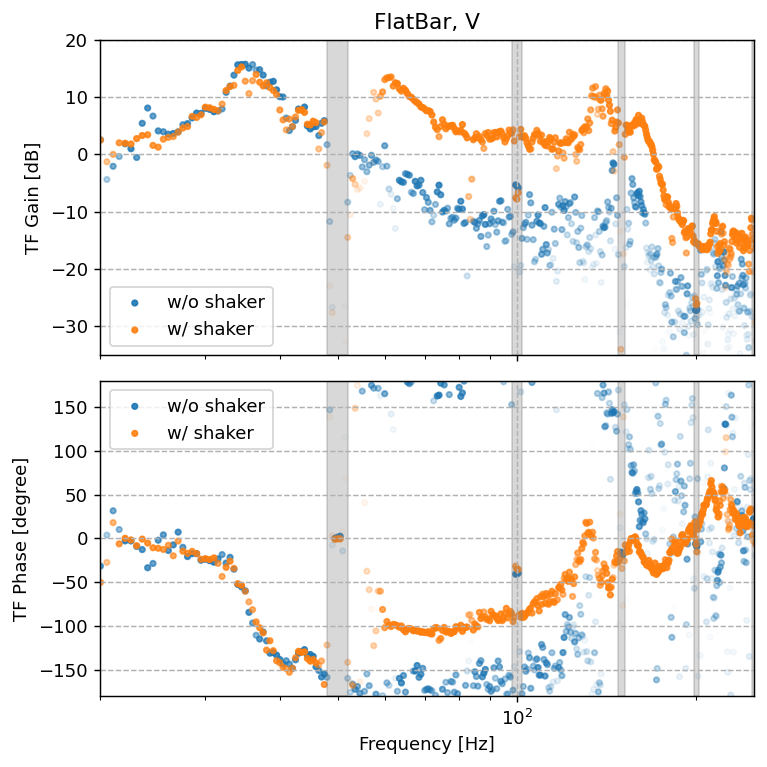
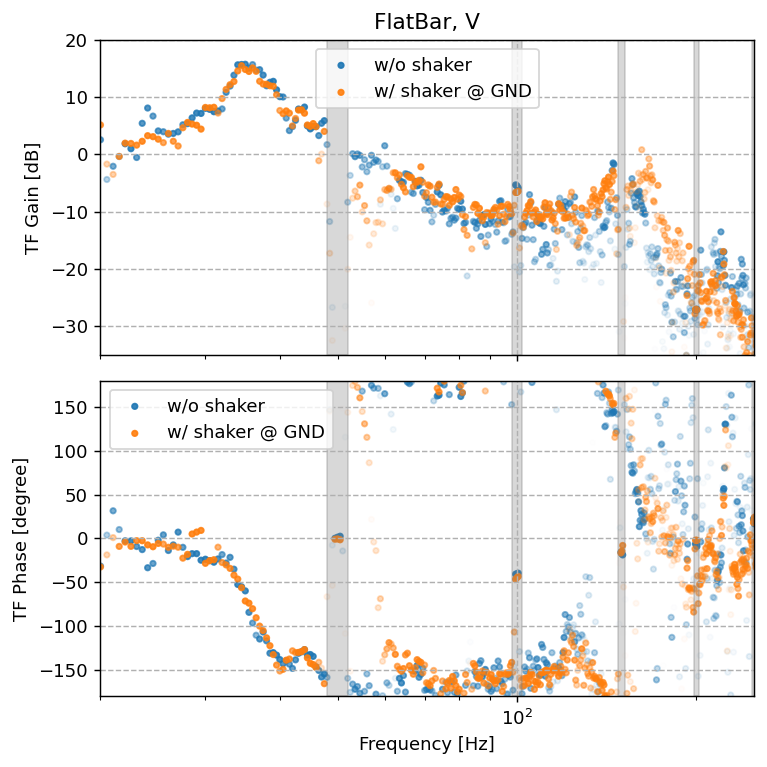
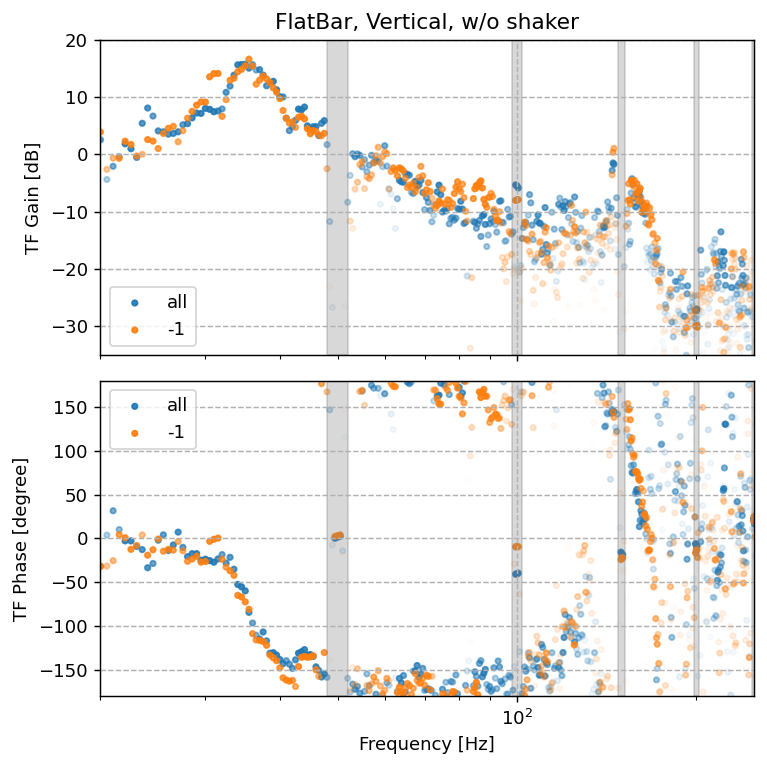
The vertical transfer functions and corresponding coherence are shown in Fig. 1 and 2, respectively.
The original transfer function of the three-stage stack has a second resonance around 70–80 Hz (red).
As reported yesterday, we successfully shifted this resonance to 120 Hz, as expected, by connecting the upper two stages (green).
On the other hand, as expected, the second resonance remains by connecting the lower two stages (magenta).
In these models, the Q-values were tuned to fit the measured data to the modeled curves.

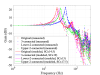
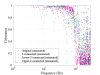
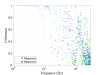
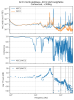
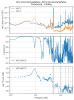
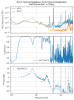
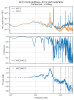
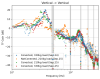
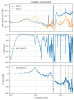
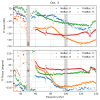
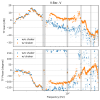
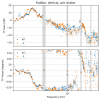
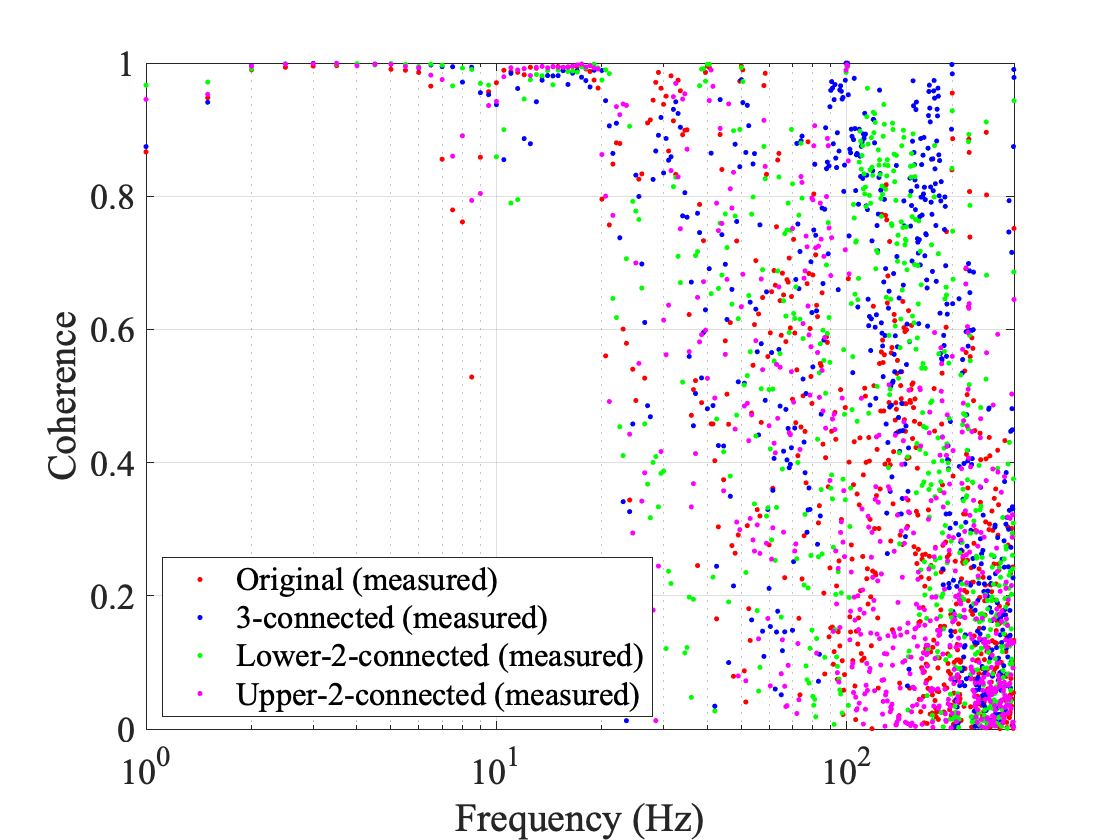
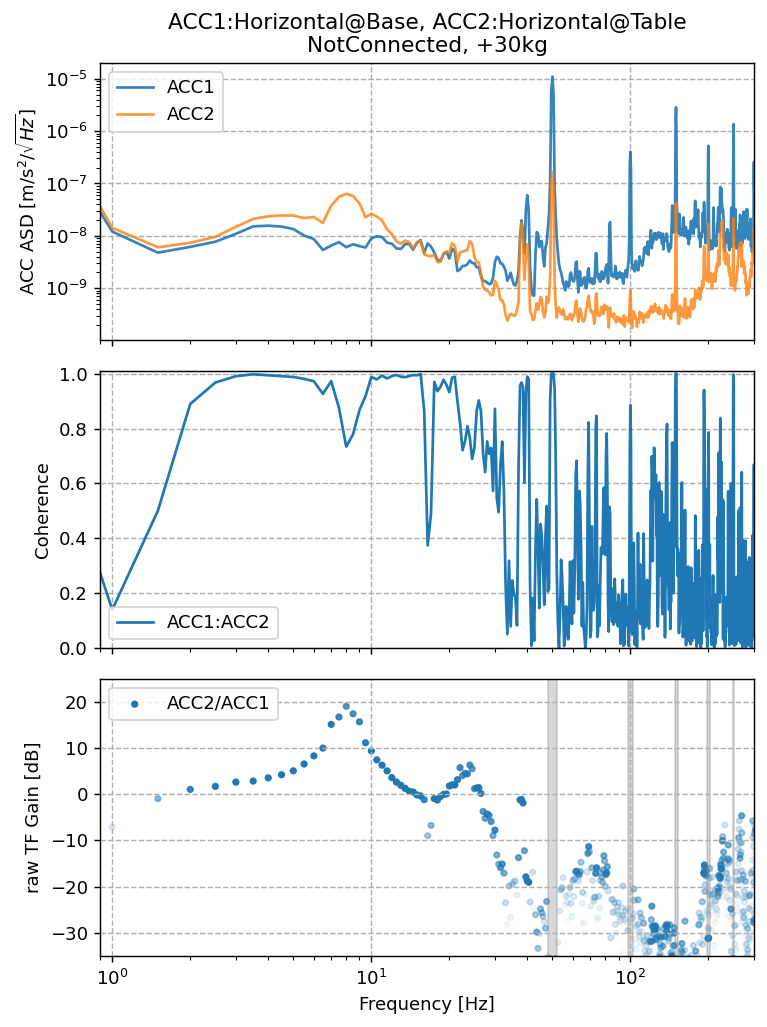
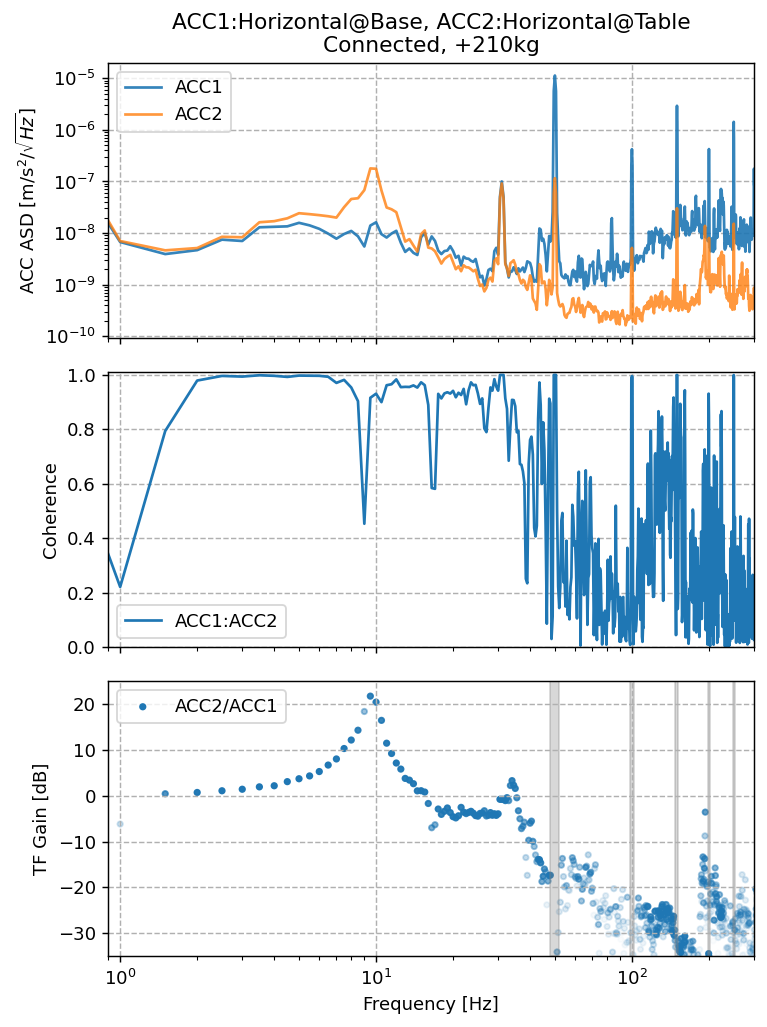
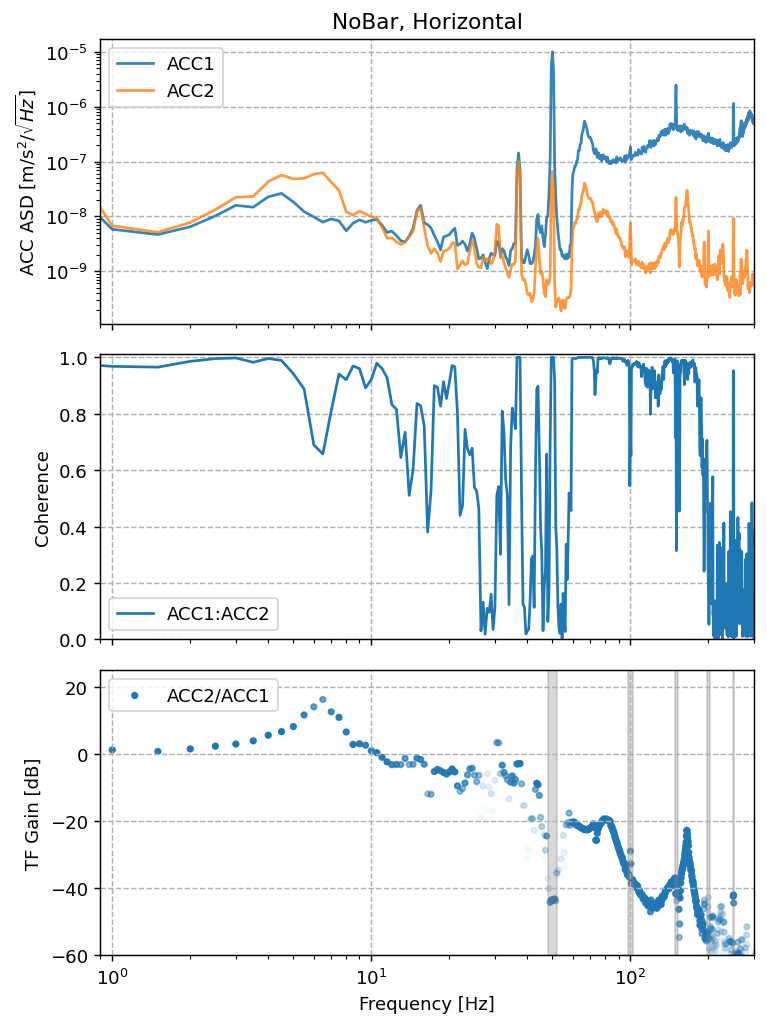
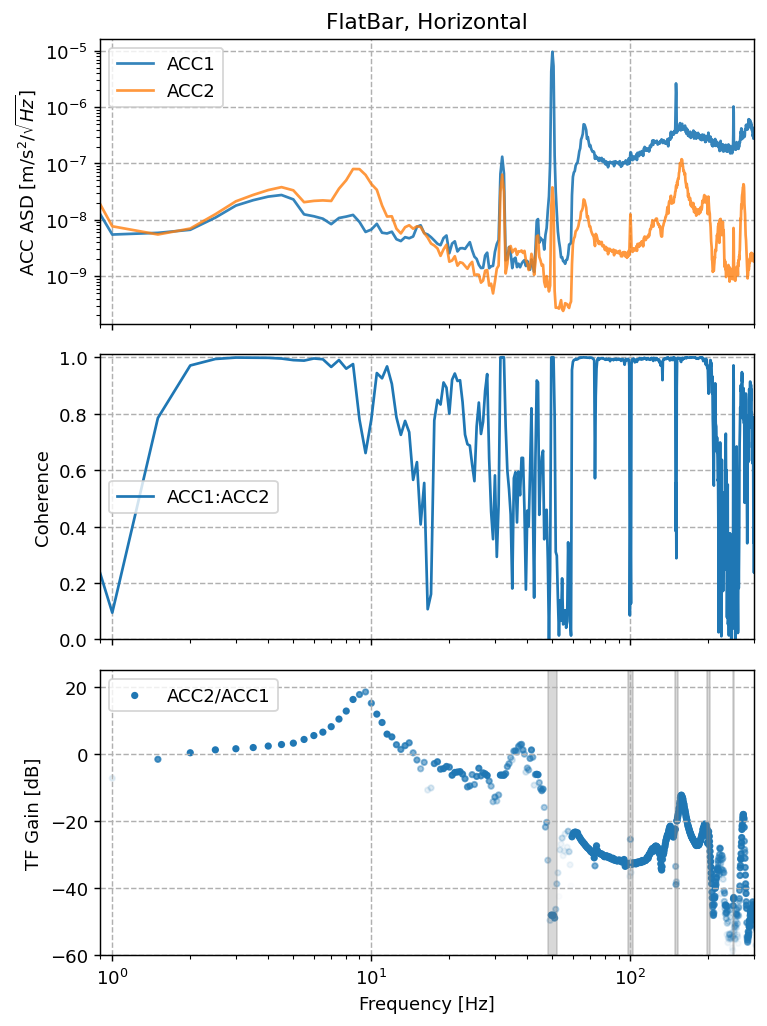
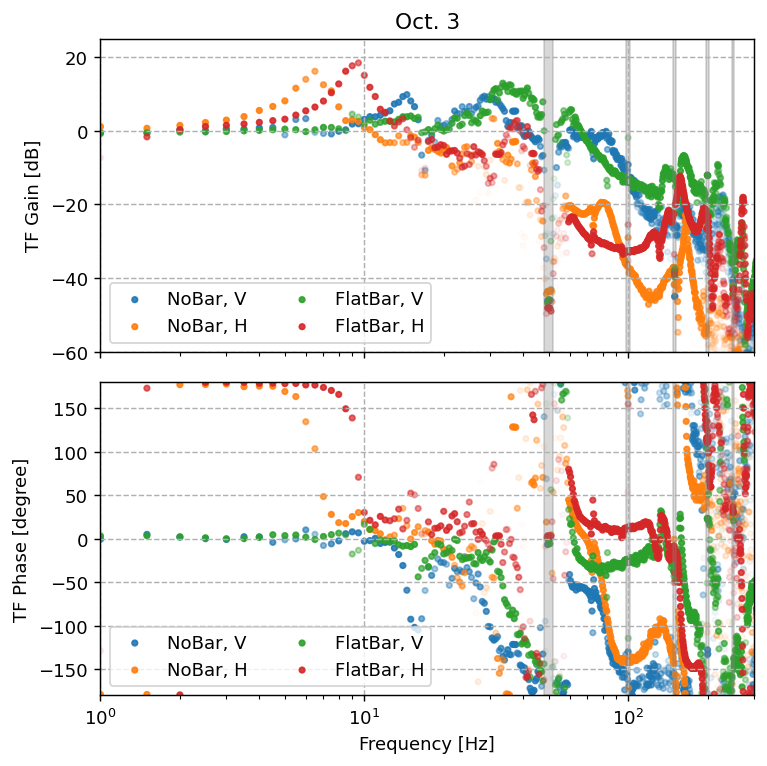
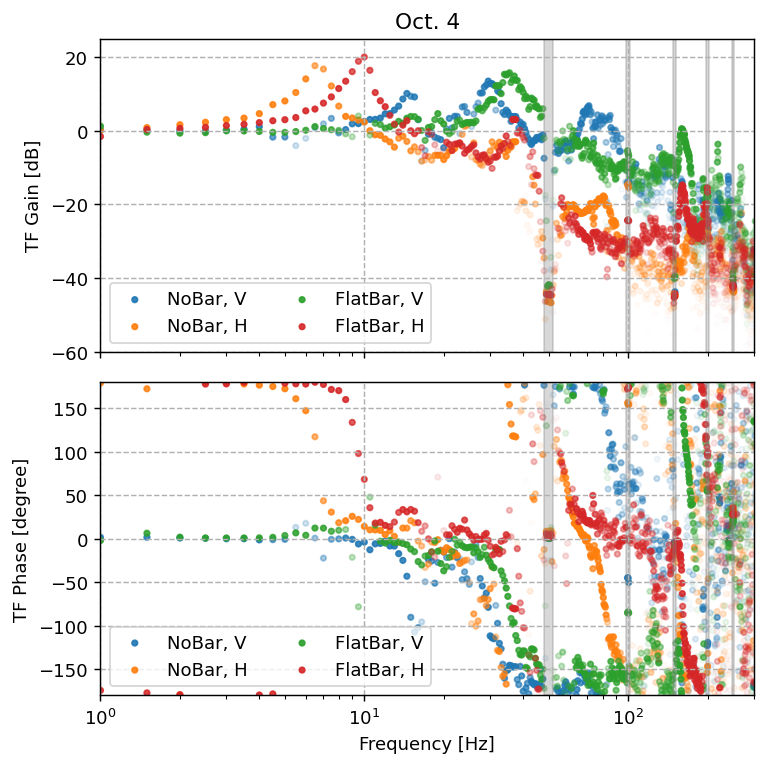
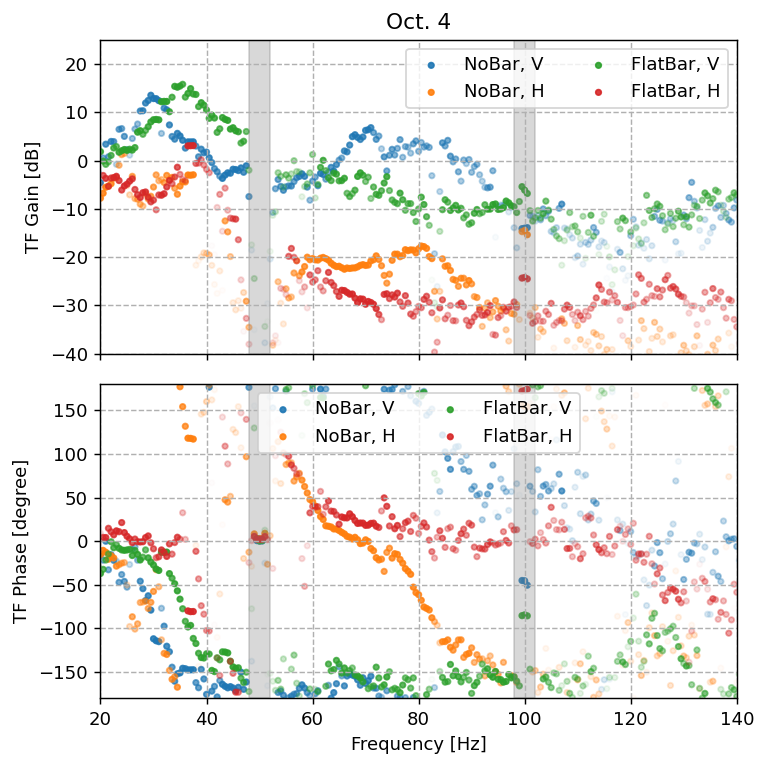
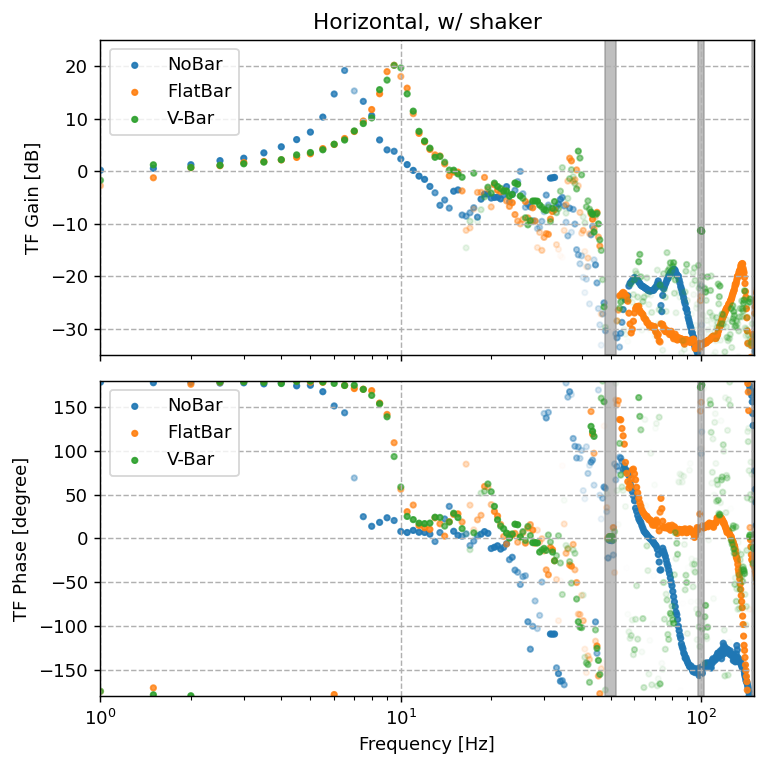
The horizontal transfer functions and corresponding coherence are shown in Fig. 3 and 4, respectively.
The coherence disappears above 20 Hz, likely due to couplings from other degrees of freedom.
Although we cannot draw reliable conclusions from this measurement, there are no significant excesses above 0 dB in the most critical frequency region (60–200 Hz). Considering both the better isolation of the OMC suspension and the better common mode rejection of the OMC monolithic structure, horizontal seismic noise should not be a significant issue compared to the vertical one.

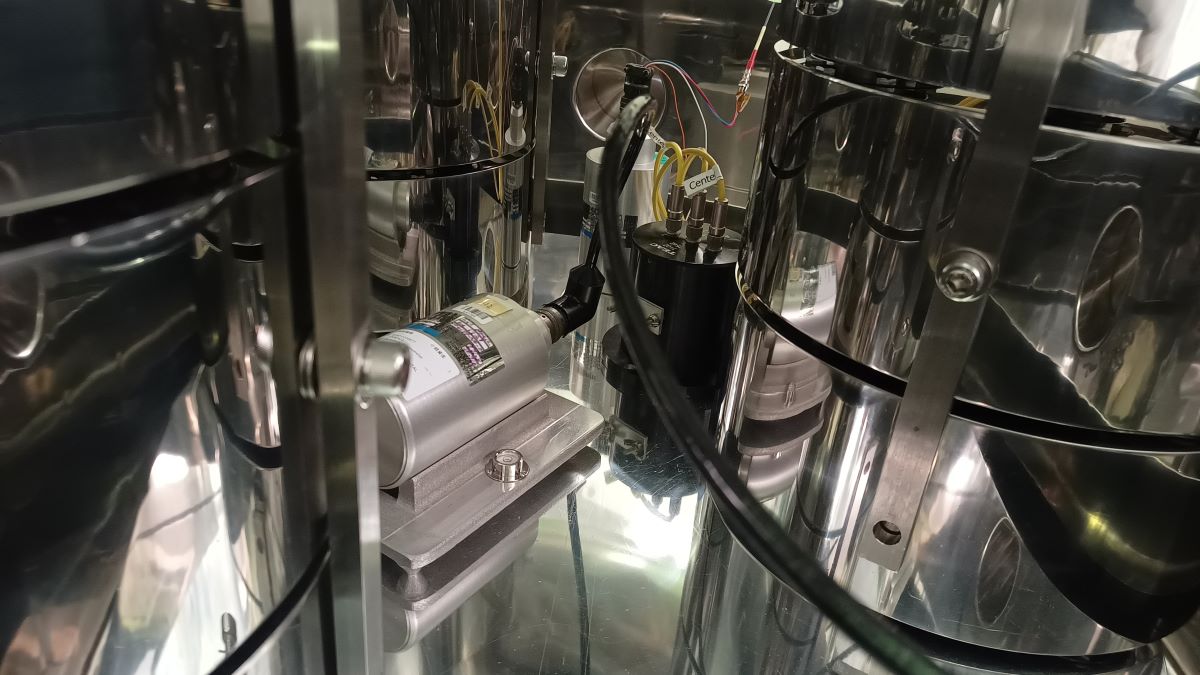
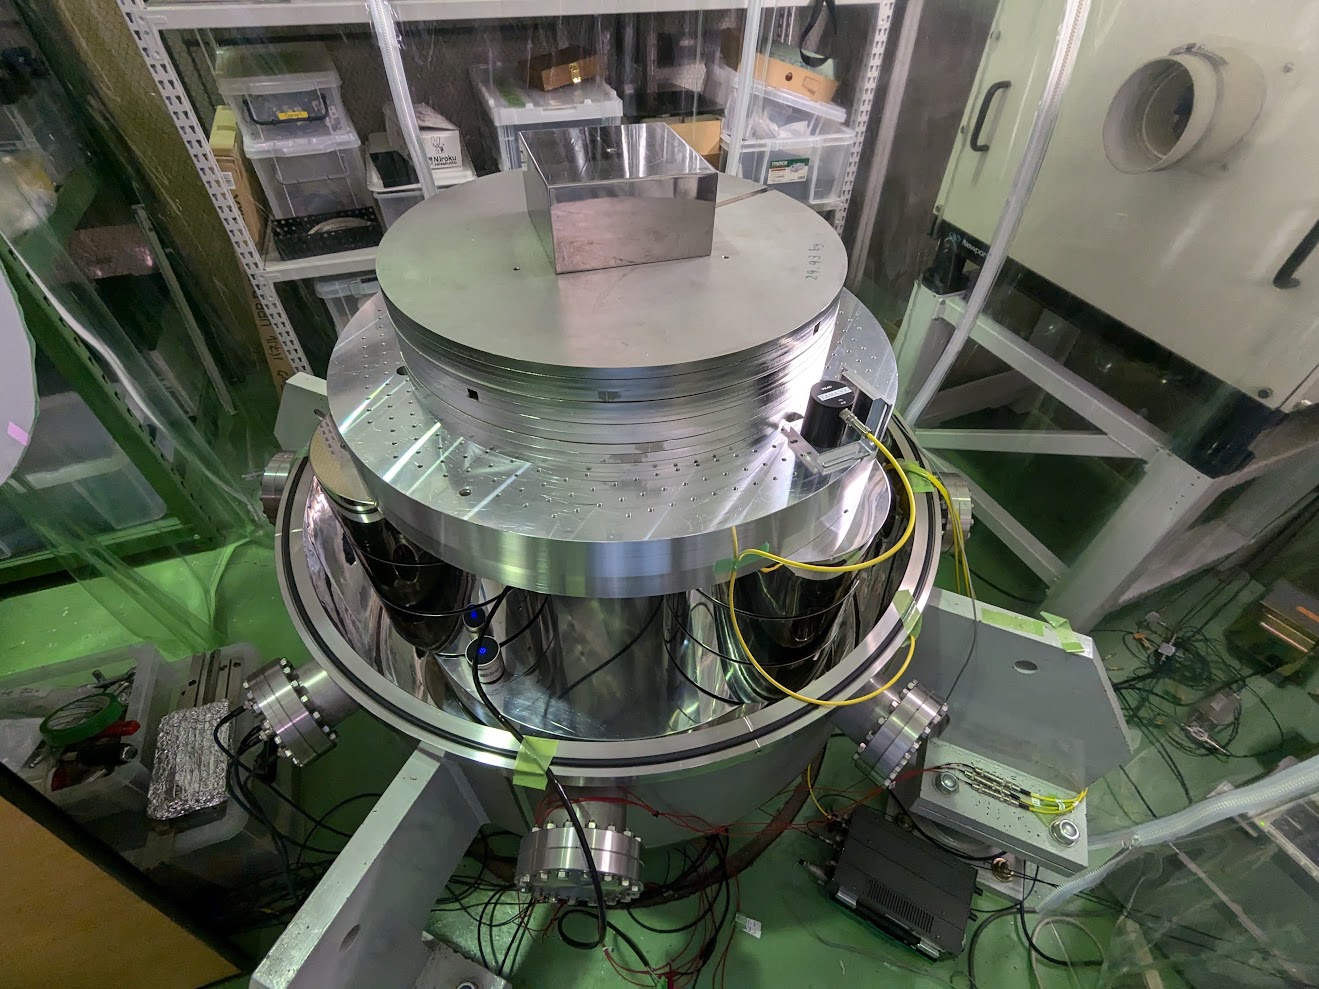
These measurements were performed at TAMA instead of the KAGRA OMC, but the resonant frequencies are similar.
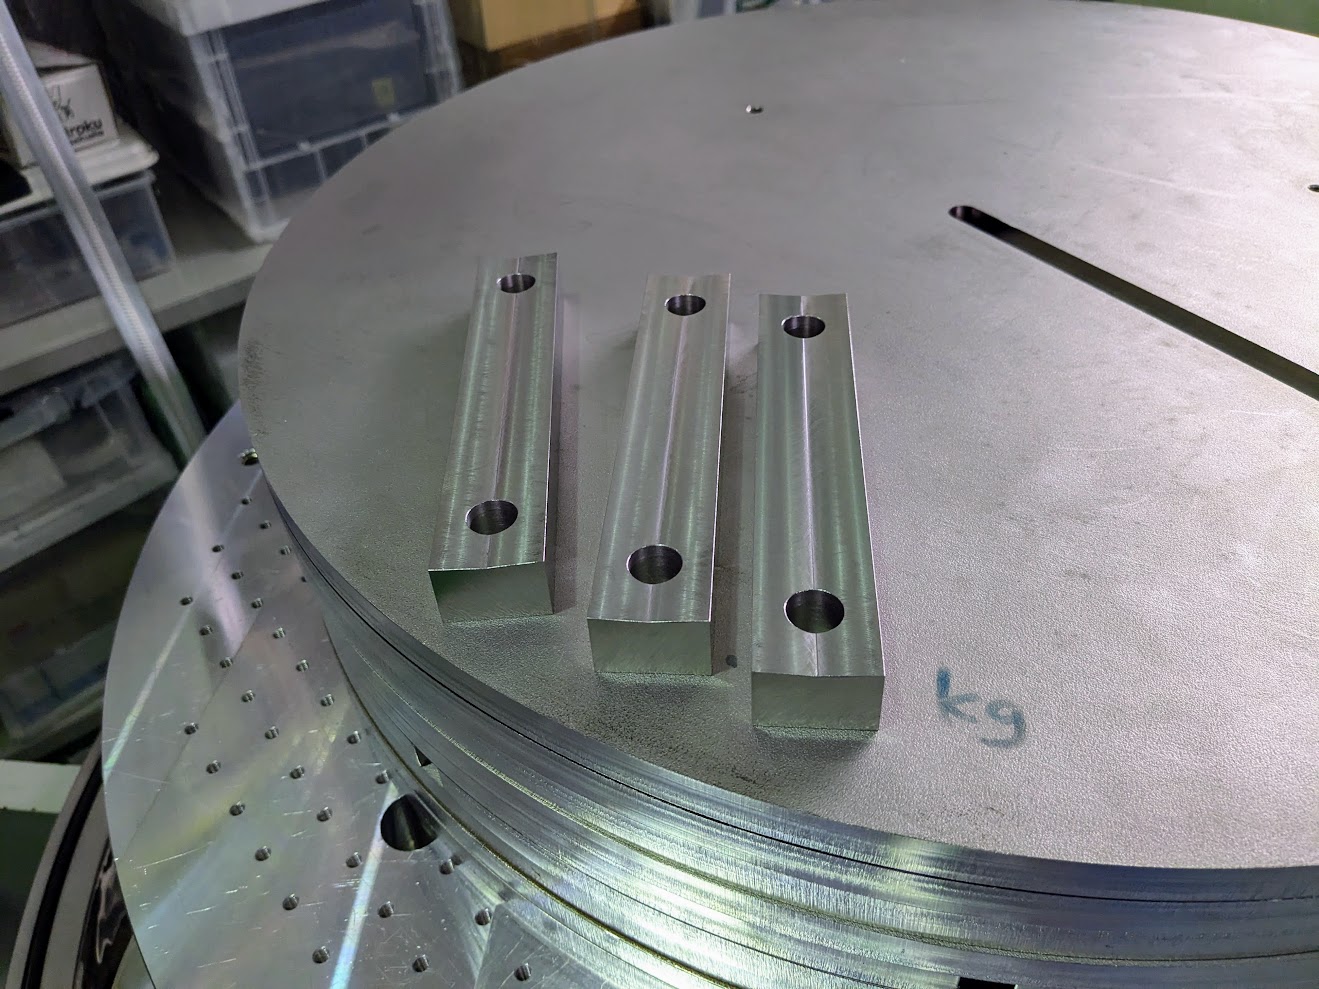
I would like to propose following tasks related to the KAGRA OMC stack:

  • Connect the upper two stages and confirm whether the shifted resonance above 100 Hz does not cause any adverse effects.
  • If the shifted resonance introduces new noise, we can attempt to connect all three stages and evaluate the resulting noise levels.

On a related note, rubbers are often modeled as a combination of parallel and series springs/dampers.
(e.g. https://lup.lub.lu.se/search/files/160169822/web1009.pdf )
This model could explain the larger spring constants at AC than that at DC, as currently observed.
We will investigate this further.

Images attached to this comment
satoru.takano - 4:30 Friday 06 September 2024 (31005) Print this report

> On a related note, rubbers are often modeled as a combination of parallel and series springs/dampers.

This model (Zener model) is widely used to describe viscoelastic property of rubber (and other materials). Takahashi-san suggested the existence of this model. Thank you.

ryutaro.takahashi - 16:26 Thursday 19 September 2024 (31092) Print this report

(Log on the 18th.)

I added 300kg to the weight of the optical bench to create a condition similar to the OMC stack.

  1. Removed the MCe suspension.
  2. Connected the upper two SUS blocks with the sidebars.
  3. Put the additional weight of 300kg (30kg x10) and the dummy weight of 30kg for the removed suspension onto the optical bench.
  4. The screw heads for the bellows were not touching the surface of the lower SUS blocks.
  5. Set the ACC (TEAC 710Z) and the geophone (L-4C H1) on the baseplate.
  6. Set the ACC (TEAC 710) and the geophone (L-4C H2) on the optical bench.
  7. Measured the transfer functions (H2/H1, 710(vertical)/710Z(Z),  710(horizontal)/710Z(X)).

The results will be reported later.

Images attached to this comment
kentaro.komori - 15:01 Monday 23 September 2024 (31106) Print this report

I analyzed the data measured by Takahashi-san using additional 300-kg masses.
The gain and coherence are shown in the first and second figures, respectively.
The green and blue dots represent the measured vertical and horizontal data.
The green line indicates the modeled vertical gain, assuming the same compensation factor as in klog:31104.

Both transfer functions maintain the isolation ratio below 0 dB between 60-100 Hz, without any significant peaks.
However, we observe two peaks in the vertical data below 50 Hz, where only one peak should be present.

Additionally, the coherence was unexpectedly low, even around a few tens of Hz in this measurement.
It is possible that some factors contributing to this low coherence may have resulted in the additional resonant structures.

Images attached to this comment
tatsuki.washimi - 8:48 Wednesday 25 September 2024 (31121) Print this report

[R.Takahashi, Washimi]

Yesterday we continued the vibration measurements (ASDs, Coherence, and TF) for the TAMA MCe stacks, with accelerometers (TEAC 710, TEAC 710Z)

  1. Measurements with locating both ACCs  on the Base Plate
  2. Measurements with locating the ACC2  on the Optical Table, for the Connected stacks & +300kg load
  3. Removed the load (270kg) and the connection bars
  4. Measurements with locating the ACC2  on the Optical Table, for the NotConnected stacks & +30kg load
  5. Put load (30+240 kg) by keeping enough gap, to not make stress on the bars
  6. Waiting for the compression drift through the night

Note that the plots attached to this klog are just raw data, not calibrated.
In yesterday's results, the strange split-peaks like klog31106 Vertical were not found.

Images attached to this comment
Non-image files attached to this comment
tatsuki.washimi - 15:28 Wednesday 25 September 2024 (31122) Print this report

I calibrated yesterday's data:

  • ACC sensitivity : 300mV/(m/s2)
  • Amplifier gain : x500
  • Difference between two ACCs: factor 1.2
Images attached to this comment
tatsuki.washimi - 16:24 Wednesday 25 September 2024 (31123) Print this report

[R.Takahashi, Washimi]

We continued the vibration measurements (ASDs, Coherence, and TF) for the TAMA MCe stacks, with accelerometers (TEAC 710, TEAC 710Z).

  1. Measurements for the NotConnected stacks & +300kg load (Fig.1, Fig.2, Fig.3)
    • The 1-st mode peak in vertical was split, but we found it after finishing today's work
  2. Connected the top and the middle stages with bars (Fig.4)
  3. Measurements for the Connected stacks & +300kg load (Fig.5, Fig.6)
  4. Measurement with vertical with a shaker
    • Coherence was improved over 70Hz (Fig.7)
  5. Add more load, total 330kg (Fig.8, Fig.9)
  6. Measurements for the Connected stacks & +300kg load (Fig.10, Fig.11)
  7. Measurement with vertical with a shaker (Fig.12)
Images attached to this comment
tatsuki.washimi - 16:51 Wednesday 25 September 2024 (31124) Print this report

We compared the Vertical TF between each measurement.

  • The blue (added all load after connecting) and the red (added 210kg before connecting, and added 90kg load after connecting) look consistent. So the compression for the connecting bars is not a matter.
  • The 1-st mode peak in the green looks shifted to LF or split.
  • The structure around 20Hz looks like a dip coming from other DoF coupling
  • The structure over 200Hz might came from bad coherence

So the current ACC position, at the edge of the optical table, might be bad (coupling with tilt?)
We will try to put the ACC at the center as much as possible.

Images attached to this comment
tatsuki.washimi - 14:37 Thursday 26 September 2024 (31130) Print this report

[R.Takahashi, Washimi]

We investigated the strange peak around 20Hz in the vertical TF, by locating the upper ACC at many places (A~G).
This peak was found when the ACC was located on the load (SUS plate/block). The behavior was independent of the clockwise angle in the horizontal plane.
At the 1-st mode peak of the stack, 37Hz, the phase differed 180deg between A~C and D~G.

So we understand the strange peak around 20Hz is a deformation mode of the optical table (aluminum), but not a coupling from tilt/horizontal -> vertical.

Images attached to this comment
tatsuki.washimi - 13:16 Thursday 03 October 2024 (31184) Print this report

[R.Takahashi, Washimi]

The new connection bars (flat type) have been delivered and we tested them today. For all measurements, 60-300Hz vibration was injected to enhance the coherence.

  1. Removed test bars from the TAMA MCe stacks and put total 330kg loads ->  screw heads were not touched
  2. TF measurements for the 3-step stacks
  3. Connect the top and the middle stages with the new bars
  4. TF measurements for the 2-step stacks

The resonant peaks of the vertical modes look dirty today. (Due to the measurements were performed soon just after reload the loads?)
We will try measurements again tomorrow.

Images attached to this comment
tatsuki.washimi - 15:48 Friday 04 October 2024 (31193) Print this report

[R.Takahashi, Washimi]

We investigated the setup. Finally, we found the load SUS block to be unstable and vibrating.
In addition, the ACC amplifier (for the bottom one) might be saturated. So we reduced the shaker amplitude today.
After these updates, the 40Hz peak became sharp and the 60Hz resonant disappeared. However, the coherence over 70Hz became bad.

We measured TFs for V&H with/without the flat bars. 

Images attached to this comment
tatsuki.washimi - 21:54 Thursday 10 October 2024 (31274) Print this report

[R.Takahashi, Washimi]

Today we tested the new V-shape connection bars (and also No-Bar and Flat-Bars) in TAMA. They were well-fitted on the surface of the stacks.

For the vertical, we didn't use a shaker because the TFs w/ shaker were not healthy (it will be reported later)
For the horizontal, we used a shaker because the coherence was bad w/o a shaker.

The results are consistent between the two bars (except for > 100Hz in horizontal).

Images attached to this comment
tatsuki.washimi - 22:16 Thursday 10 October 2024 (31276) Print this report

We investigated the TFs w/ shaker for vertical, such that:

  • removed unused geophone
  • changed the shaker's power
  • changed the ACC amplifier gain

However, in any case, the TFs were strange shapes and large at 50-200Hz.

Finally, we located the shaker on the ground outside of the chamber. Then, the TF shape looked healthy with a larger coherence.
So the shaker might excite something resonant (and also sound?) of the baseplate.
 

Images attached to this comment
tatsuki.washimi - 16:04 Friday 11 October 2024 (31288) Print this report

[R.Takahashi, Washimi]

Today we measured the vertical TF with the FlatBars, after removing 1 bar.

The result looks similar to the full-connected result (yesterday), but a small peak is seen at 90Hz.

Images attached to this comment
Search Help
×

Warning

×