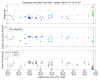
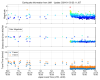
Reports 1-1 of 1 Clear search Modify search
PEM (General)
tatsuki.washimi - 20:02 Monday 01 January 2024 (28146) Print this report
Noto Earthquakes
>M4 earthquakes list

JST    Location    Magnitude    Dep    Distance
2024-01-01 18:08    能登半島沖    5.6    10    131
2024-01-01 18:06    新潟県上中越沖    4.7    10    132
2024-01-01 18:03    能登半島沖    5.3    20    131
2024-01-01 17:48    佐渡付近    4.7    10    179
2024-01-01 17:39    能登半島沖    4    10    121
2024-01-01 17:29    新潟県上中越沖    5    10    134
2024-01-01 17:22    能登半島沖    4.8    10    121
2024-01-01 17:20    新潟県上中越沖    4.2    10    134
2024-01-01 17:18    石川県能登地方    4.2    10    98
2024-01-01 17:17    石川県能登地方    4.6    30    120
2024-01-01 17:07    能登半島沖    5.2    10    107
2024-01-01 17:02    石川県能登地方    4.9    10    112
2024-01-01 16:56    石川県能登地方    5.7    20    104
2024-01-01 16:51    石川県能登地方    4.2    0    100
2024-01-01 16:48    石川県能登地方    5    10    104
2024-01-01 16:45    佐渡付近    4.7    10    170
2024-01-01 16:42    石川県能登地方    5.2    0    109
2024-01-01 16:39    新潟県上中越沖    5.2    10    121
2024-01-01 16:35    佐渡付近    4.3    10    147
2024-01-01 16:32    石川県能登地方    4.8    0    102
2024-01-01 16:29    能登半島沖    4.6    10    131
2024-01-01 16:23    石川県能登地方    4.5    10    120
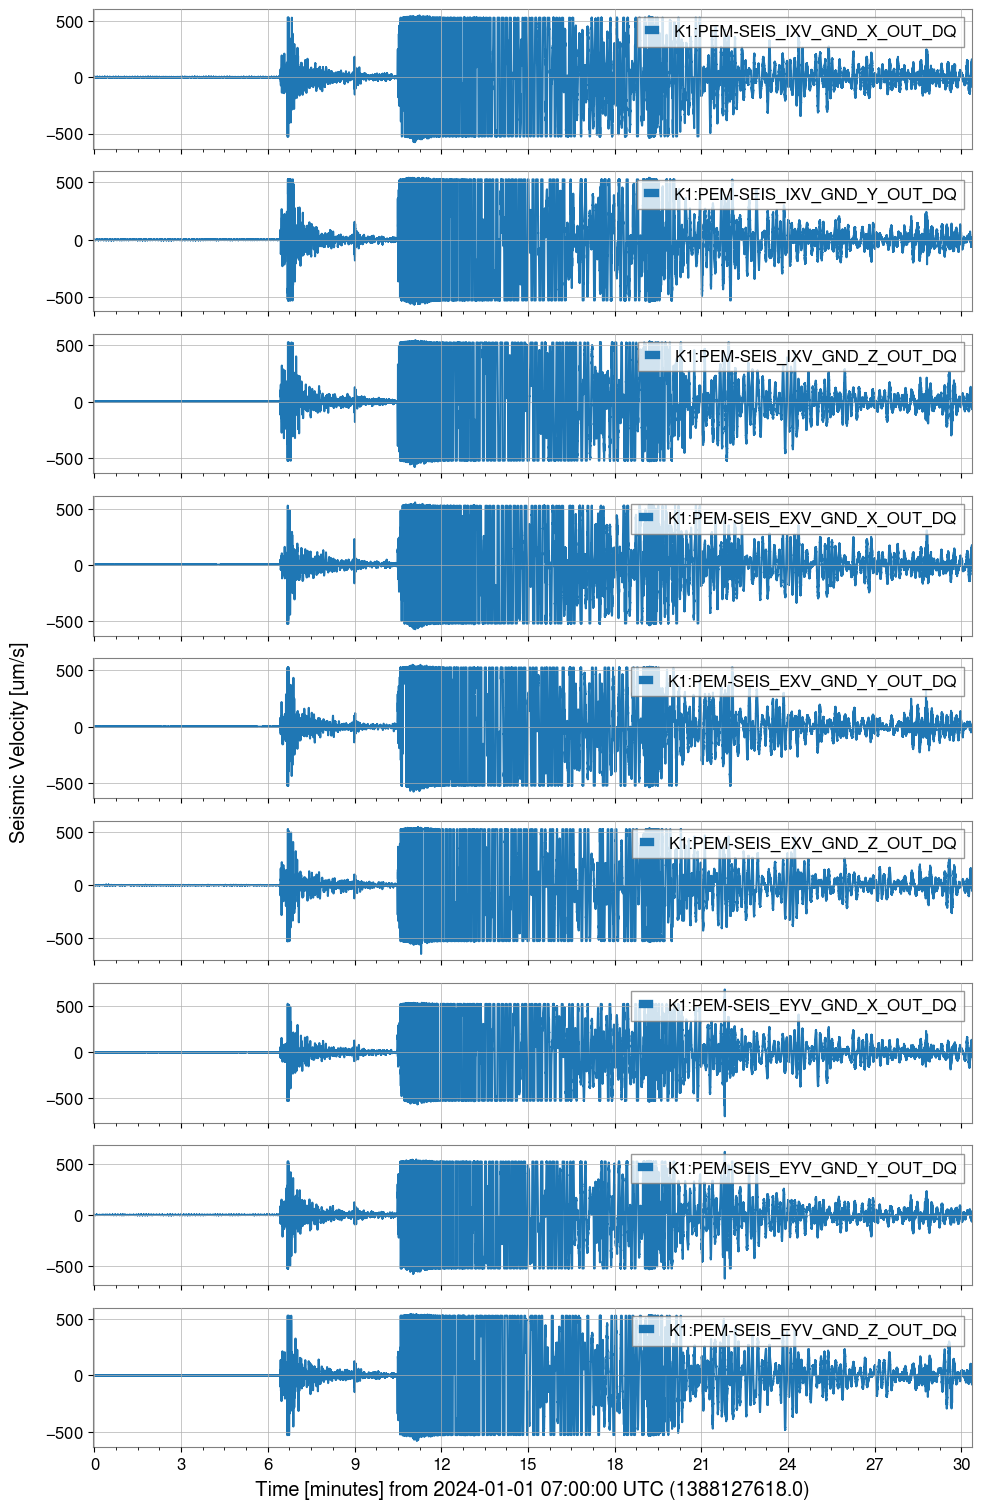
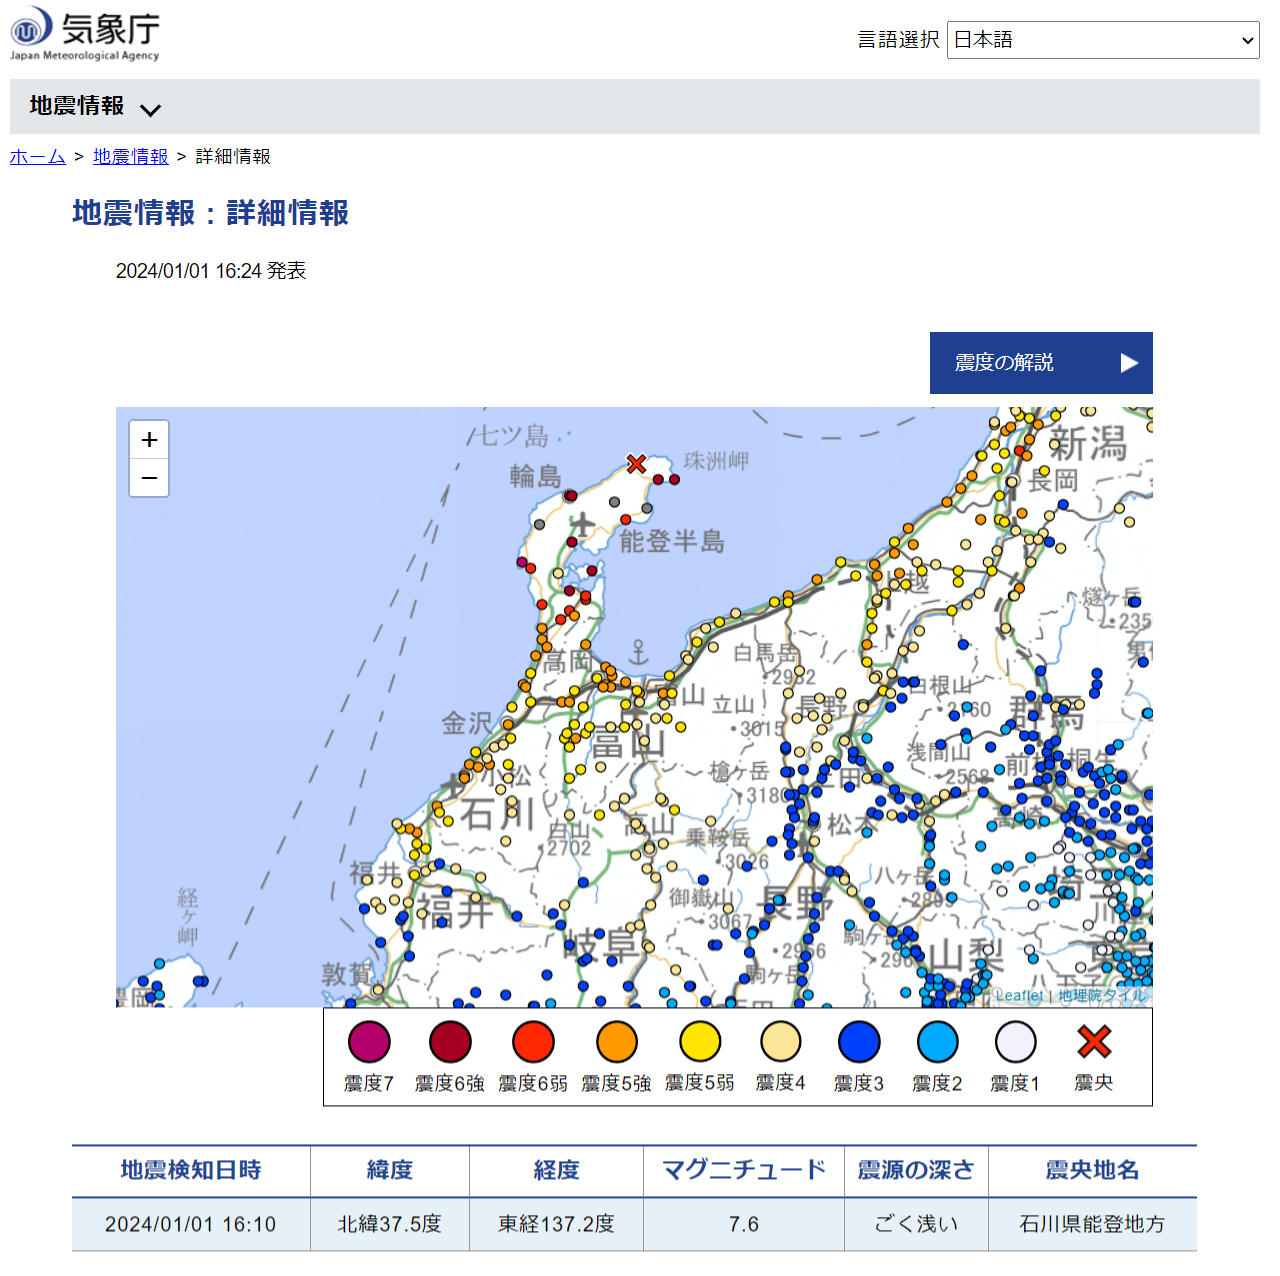
2024-01-01 16:18    石川県能登地方    6.1    10    94
2024-01-01 16:10    石川県能登地方    7.6    0    120
2024-01-01 16:06    石川県能登地方    5.7    10    120
 

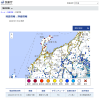
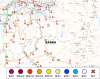
Detail data in JMA page (written in Japanese)

https://www.data.jma.go.jp/svd/eqev/data/kyoshin/jishin/2305051442_noto/index.html

Images attached to this report
Comments to this report:
shinji.miyoki - 20:08 Monday 01 January 2024 (28150) Print this report

Can somebody judge how many towers and suspensions went isolated/safe mode by the first event of (2024-01-01 16:06    石川県能登地方    M5.7 ) ?

Actually, the next one of (2024-01-01 16:10    石川県能登地方    M7.6) could be more dangerous. If many could go to isolated/safe mode by the 1st one, we can expect these towers and suspensions could be safer. 

tatsuki.washimi - 9:59 Tuesday 02 January 2024 (28153) Print this report

I checked the KAGRA seismometers (Trillium120).

For the largest earthquake, the signal was saturated.

Images attached to this comment
tatsuki.washimi - 10:57 Tuesday 02 January 2024 (28155) Print this report

I also checked the accelerometers signal.

  • some ACCs (EXC/EYC/IYC chamber, Tx of Y-PCal, PSL periscope/portable) are not working.
  • ACCs on the PSL tables are saturated, probably due to their amplifiers' gain being larger than others.
  • Other ACCs show 0.1~0.2 m/s2 signal


Images attached to this comment
tatsuki.washimi - 12:02 Tuesday 02 January 2024 (28157) Print this report

JST    Location    Dep    Distance
2024-01-02 11:19    石川県西方沖    10    117
2024-01-02 11:05    石川県能登地方    10    110
2024-01-02 10:17    石川県能登地方    10    102
2024-01-02 09:14    石川県能登地方    30    109
2024-01-02 07:37    石川県能登地方    10    120
2024-01-02 07:27    石川県能登地方    10    112
2024-01-02 07:13    石川県能登地方    20    104
2024-01-02 06:53    新潟県上中越沖    10    134
2024-01-02 06:34    石川県能登地方    10    112
2024-01-02 04:42    能登半島沖    10    112
2024-01-02 04:27    能登半島沖    10    98
2024-01-02 04:05    能登半島沖    20    121
2024-01-02 04:02    石川県能登地方    10    108
2024-01-02 03:29    石川県能登地方    0    98
2024-01-02 02:52    石川県能登地方    10    98
2024-01-02 02:48    佐渡付近    10    170
2024-01-02 02:33    新潟県上中越沖    10    132
2024-01-02 01:43    能登半島沖    10    131
2024-01-02 01:42    佐渡付近    10    156
2024-01-02 00:08    石川県能登地方    10    120
 

Images attached to this comment
tatsuki.washimi - 0:12 Thursday 04 January 2024 (28160) Print this report

JST                          Location    Magnitude    Dep    Distance
2024-01-03 22:09    佐渡付近    4    10    152
2024-01-03 19:49    新潟県上中越沖    4.1    10    132
2024-01-03 19:42    石川県能登地方    4    10    102
2024-01-03 18:48    石川県能登地方    4.8    10    108
2024-01-03 17:15    佐渡付近    4    10    145
2024-01-03 16:08    石川県能登地方    4.2    10    115
2024-01-03 13:44    能登半島沖    4.1    10    131
2024-01-03 13:04    佐渡付近    4.1    10    143
2024-01-03 12:54    新潟県上中越沖    4.9    10    134
2024-01-03 12:48    佐渡付近    4.1    10    169
2024-01-03 12:37    能登半島沖    4.2    10    107
2024-01-03 11:48    石川県能登地方    4.2    10    120
2024-01-03 10:54    石川県能登地方    5.6    10    115
2024-01-03 10:36    佐渡付近    4    10    173
2024-01-03 08:34    石川県能登地方    4    10    112
2024-01-03 07:51    石川県西方沖    4    10    104
2024-01-03 06:32    石川県能登地方    4.5    10    98
2024-01-03 05:54    佐渡付近    4.2    10    157
2024-01-03 02:30    石川県能登地方    4.4    10    120
2024-01-03 02:21    石川県能登地方    4.9    10    120
2024-01-02 21:13    石川県能登地方    4.3    10    104
2024-01-02 18:50    佐渡付近    4.1    10    145
2024-01-02 18:29    石川県能登地方    4.3    10    120
2024-01-02 18:20    石垣島近海    4.4    70    1788
2024-01-02 17:56    能登半島沖    4.2    10    112
2024-01-02 17:52    佐渡付近    4.2    10    147
2024-01-02 17:13    能登半島沖    4.6    10    98
2024-01-02 15:57    石川県能登地方    4.5    10    102
2024-01-02 15:02    佐渡付近    4.2    10    160
2024-01-02 14:01    能登半島沖    4.3    10    118
2024-01-02 11:19    石川県西方沖    4.1    10    117
2024-01-02 11:05    石川県能登地方    4.1    10    110
2024-01-02 10:17    石川県能登地方    5.6    10    102
2024-01-02 09:14    石川県能登地方    4.7    30    109
2024-01-02 07:37    石川県能登地方    4.3    10    120
2024-01-02 07:27    石川県能登地方    4.3    10    112
2024-01-02 07:13    石川県能登地方    4.7    20    104
2024-01-02 06:53    新潟県上中越沖    4.2    10    134
2024-01-02 06:34    石川県能登地方    4.2    10    112
2024-01-02 04:42    能登半島沖    4.9    10    112
2024-01-02 04:27    能登半島沖    4.7    10    98
2024-01-02 04:05    能登半島沖    4    20    121
2024-01-02 04:02    石川県能登地方    4    10    108
2024-01-02 03:29    石川県能登地方    4    0    98
2024-01-02 02:52    石川県能登地方    4.2    10    98
2024-01-02 02:48    佐渡付近    4.3    10    170
2024-01-02 02:33    新潟県上中越沖    4.6    10    132
2024-01-02 01:43    能登半島沖    4.4    10    131
2024-01-02 01:42    佐渡付近    4.2    10    156
2024-01-02 00:08    石川県能登地方    4.5    10    120
 

Images attached to this comment
takaaki.yokozawa - 8:53 Thursday 04 January 2024 (28162) Print this report
Many earthquakes were detected in Human region (1 - 3 Hz)
Images attached to this comment
takaaki.yokozawa - 9:51 Thursday 04 January 2024 (28166) Print this report
Floor level would not be changed.
Images attached to this comment
tatsuki.washimi - 10:09 Thursday 04 January 2024 (28167) Print this report

I try to calculate from the ACCs signal to the seismic intensity (震度)  based on its definition (https://www.data.jma.go.jp/eqev/data/kyoshin/kaisetsu/calc_sindo.html).
However, it is impossible because it requires 3-axial vector data but our ACCS are 1-axial ones.

tatsuki.washimi - 14:52 Saturday 06 January 2024 (28187) Print this report

All channels of the INF01 at Mozumi.
Note that the accelerometer signal is peak-hold value.

The largest peak ~ 200 Gal = 2 m/s2 is almost the same to the underground ACC data.

Images attached to this comment
tatsuki.washimi - 16:29 Saturday 06 January 2024 (28188) Print this report
Images attached to this comment
tatsuki.washimi - 21:42 Saturday 06 January 2024 (28189) Print this report

I evaluated the Shindo intensity (震度) for the M7.6 Earthquake,  by the ACC signals even though they are 1-axial.

ref: https://www.data.jma.go.jp/eqev/data/kyoshin/kaisetsu/calc_sindo.html

By assuming the vibration is the same for each axis, the vector-sum intensity is √3 times the Z-direction, and the expected Shindo was 4 or 5-.

channel name I_z  I_z*√3 Shindo 
K1:PEM-ACC_BS_TABLE_POP_Z_OUT_DQ 2.53 4.39 4
K1:PEM-ACC_BS_TABLE_POS_Z_OUT_DQ 2.53 4.39 4
K1:PEM-ACC_EXA_TABLE_RX_Z_OUT_DQ 2.29 3.97 4
K1:PEM-ACC_EXA_TABLE_TX_Z_OUT_DQ 2.31 4.00 4
K1:PEM-ACC_EYA_TABLE_RX_Z_OUT_DQ 2.62 4.53 5-
K1:PEM-ACC_MCE_TABLE_IMCTRANS_Z_OUT_DQ 2.51 4.35 4
K1:PEM-ACC_MCF_TABLE_IMCREFL_Z_OUT_DQ 2.69 4.66 5-
K1:PEM-ACC_OMC_CHAMBER_OMCLEG_Z_OUT_DQ 2.78 4.82 5-
K1:PEM-ACC_OMC_TABLE_AS_Z_OUT_DQ 2.72 4.71 5-
K1:PEM-ACC_PR_TABLE_ISS_Z_OUT_DQ 2.51 4.35 4
K1:PEM-ACC_PR_TABLE_REFL_Z_OUT_DQ 2.48 4.29 4


From the JMA page (https://www.data.jma.go.jp/multi/quake/quake_detail.html?eventID=20240101162429&lang=jp), the Shindo around KAGRA were 4 or 5-.
It is consistent to my analysis.


Images attached to this comment
tatsuki.washimi - 10:12 Tuesday 09 January 2024 (28196) Print this report

I found my mistake in the calculation to expect the total vibration from the Z-direction data.

Because Shindo-intensity is the value taken logarithmic for (filled) acceleration, multiplying √3 should be inside the log10, and the final correction for the Shindo-intensity is adding 2*log10(√3) = 0.48.

Finally, the expected Shindo became 3.

channel name I_z  I_z+log10(3) Shindo 
K1:PEM-ACC_BS_TABLE_POP_Z_OUT_DQ 2.53 3.01 3
K1:PEM-ACC_BS_TABLE_POS_Z_OUT_DQ 2.53 3.01 3
K1:PEM-ACC_EXA_TABLE_RX_Z_OUT_DQ 2.29 2.77 3
K1:PEM-ACC_EXA_TABLE_TX_Z_OUT_DQ 2.31 2.78 3
K1:PEM-ACC_EYA_TABLE_RX_Z_OUT_DQ 2.62 3.09 3
K1:PEM-ACC_MCE_TABLE_IMCTRANS_Z_OUT_DQ 2.51 2.99 3
K1:PEM-ACC_MCF_TABLE_IMCREFL_Z_OUT_DQ 2.69 3.17 3
K1:PEM-ACC_OMC_CHAMBER_OMCLEG_Z_OUT_DQ 2.78 3.26 3
K1:PEM-ACC_OMC_TABLE_AS_Z_OUT_DQ 2.72 3.20 3
K1:PEM-ACC_PR_TABLE_ISS_Z_OUT_DQ 2.51 2.99 3
K1:PEM-ACC_PR_TABLE_REFL_Z_OUT_DQ 2.48 2.96 3


shinji.miyoki - 14:33 Thursday 11 January 2024 (28251) Print this report

The ACC data that was excited by M6.8 around Noto on May 5th seems to be ~0.03 m/s/s around peaks. This is 1/8 smaller than that by M7.6 on Jan 1st.

Search Help
×

Warning

×