Kawabe, Shibai, Aso
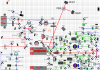
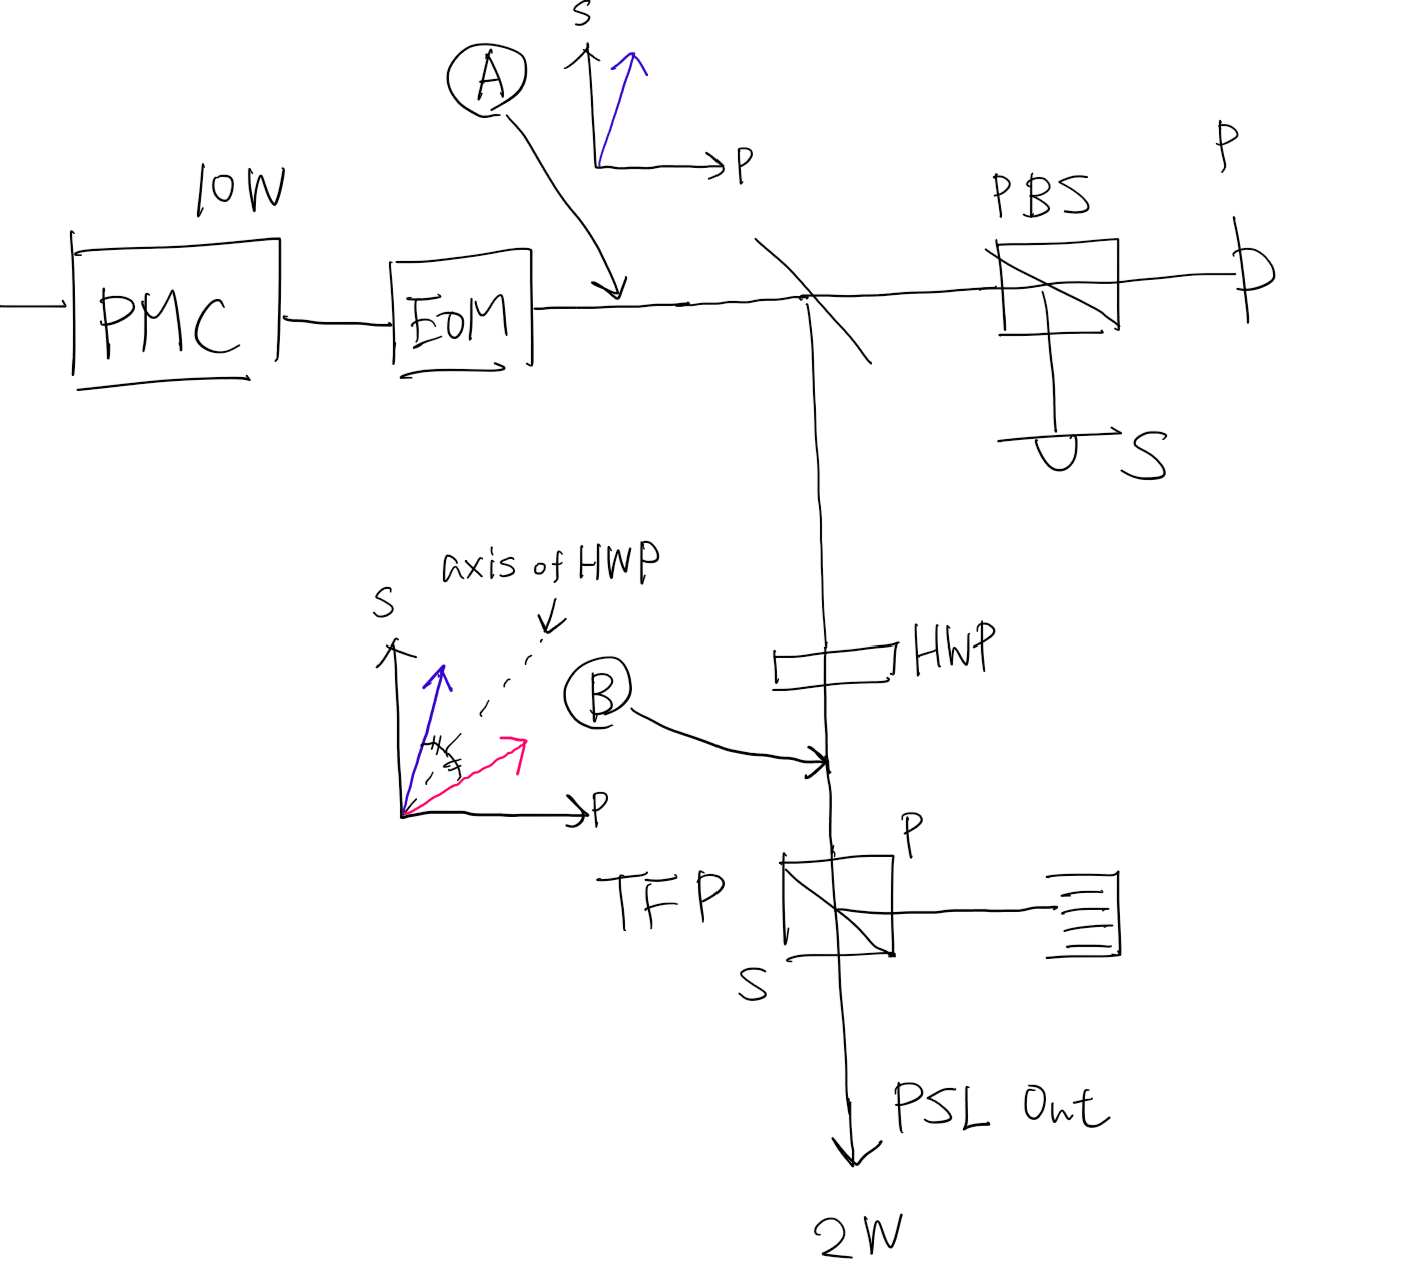
In order to understand the cause of the strange drift in the PSL output power, we moved the polarization analysis optics from the PMC transmission to after the first EOM.
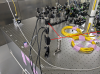
More specifically, we picked up the transmitted beam from the steering mirror M10 in the attached optical layout.
Then we put a PBS and two PDs to monitor the power of the transmitted (P-polarization) and the reflected (S-pol) beams (attachement 2).
The channel names for those signals are:
S-Pol: K1:IOP-IOO1_MADC1_EPICS_CH20
P-Pol: K1:IOP-IOO1_MADC1_EPICS_CH21
The above channels were used to monitor the polarization contents of the PMC transmission before.
We removed the ND filter from the PD and the gain is set to 40dB for both of them.
We left the PSL around 1PM on 2023/8/29JST (4AM UTC).
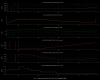
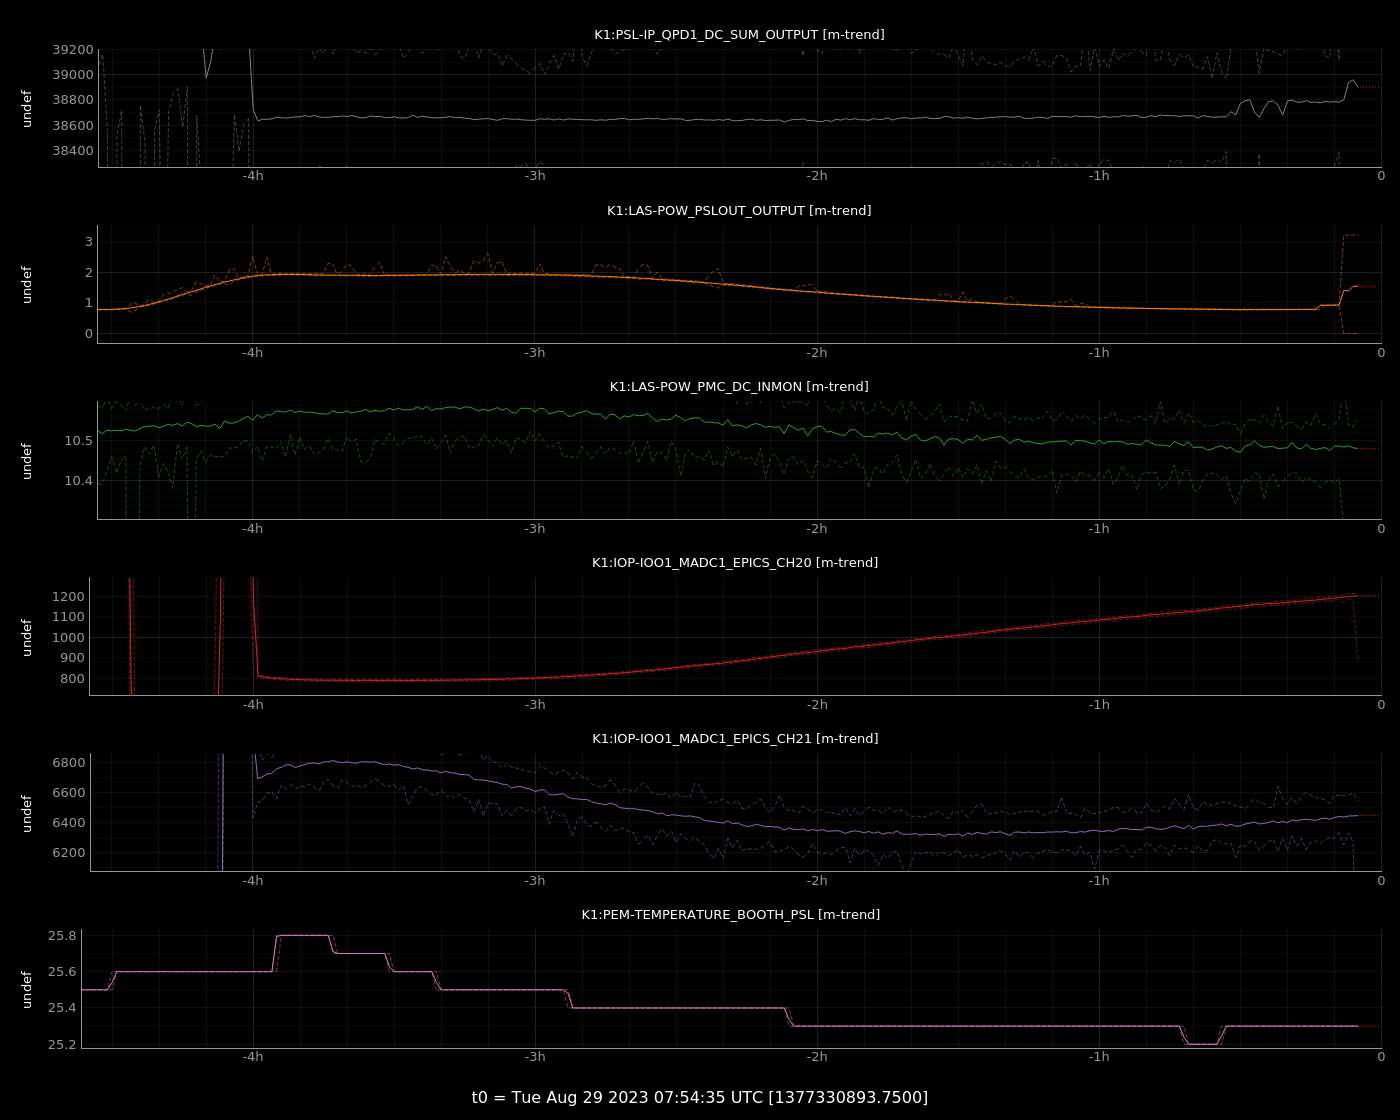
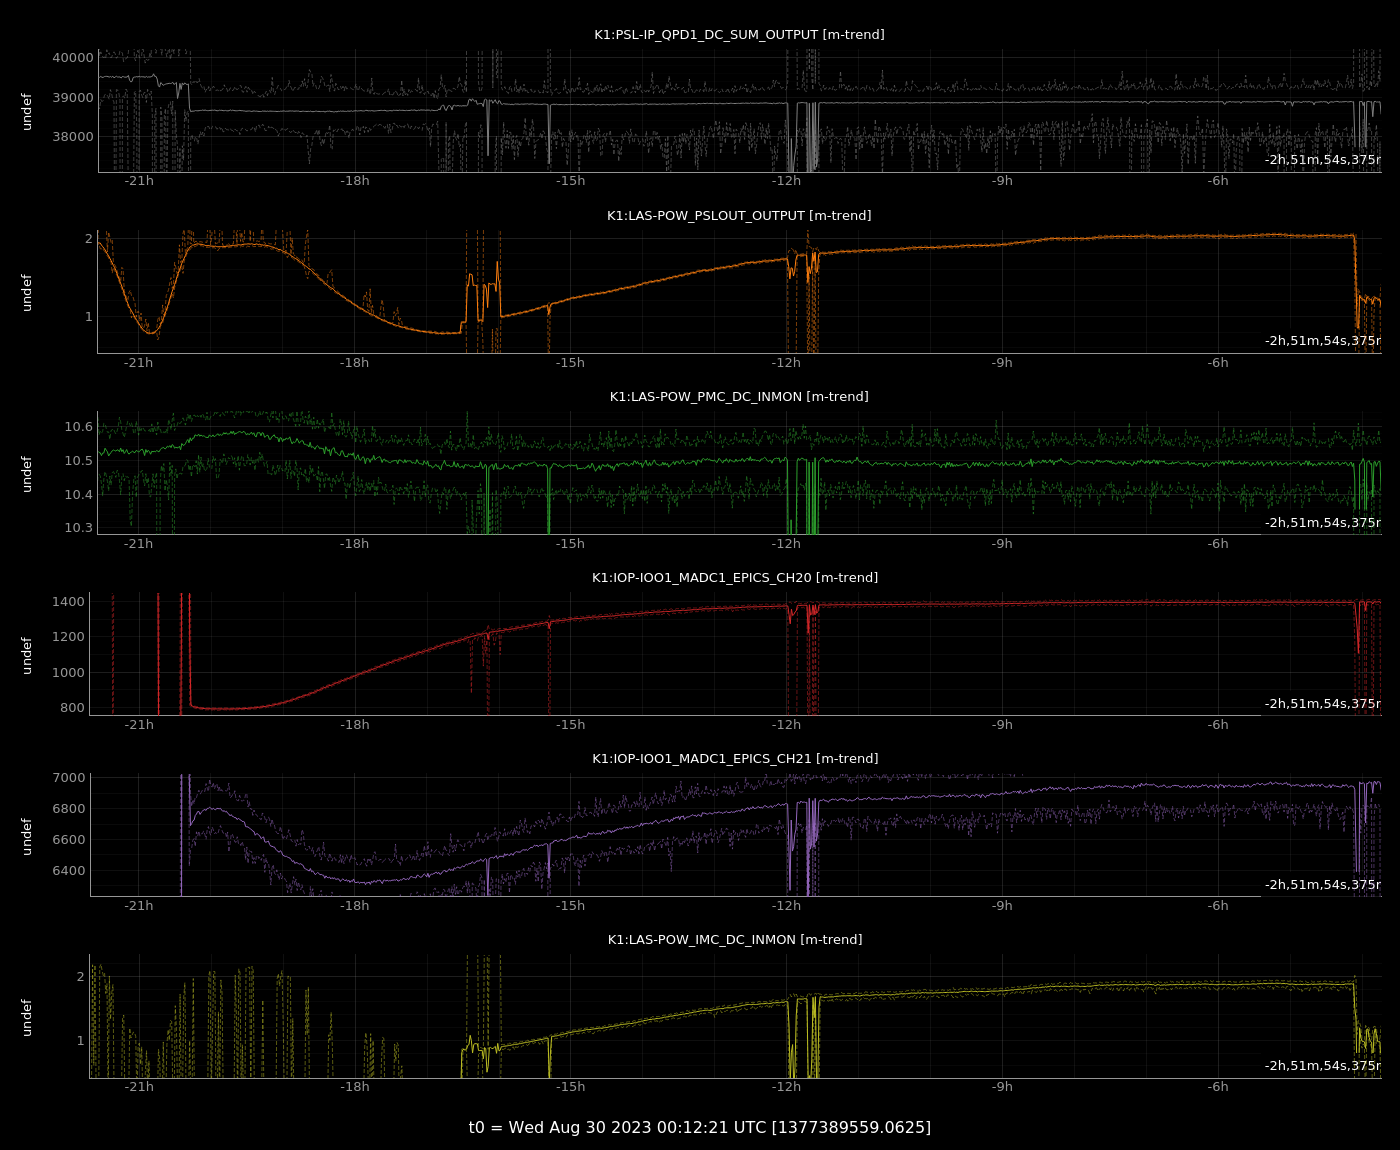
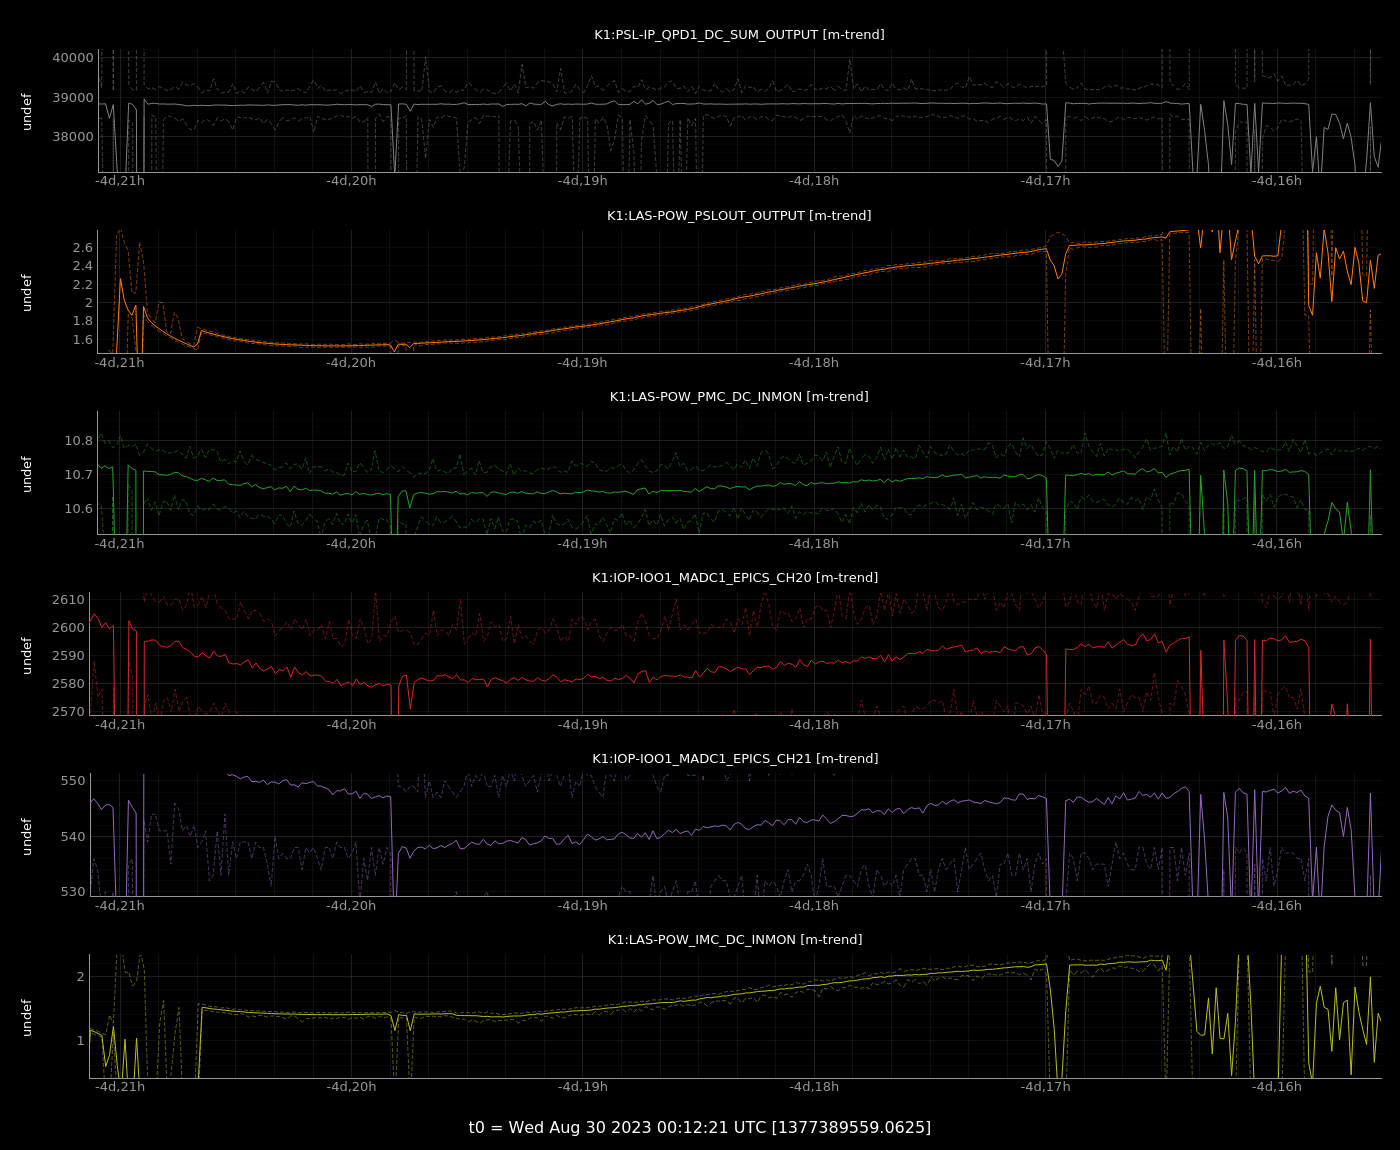
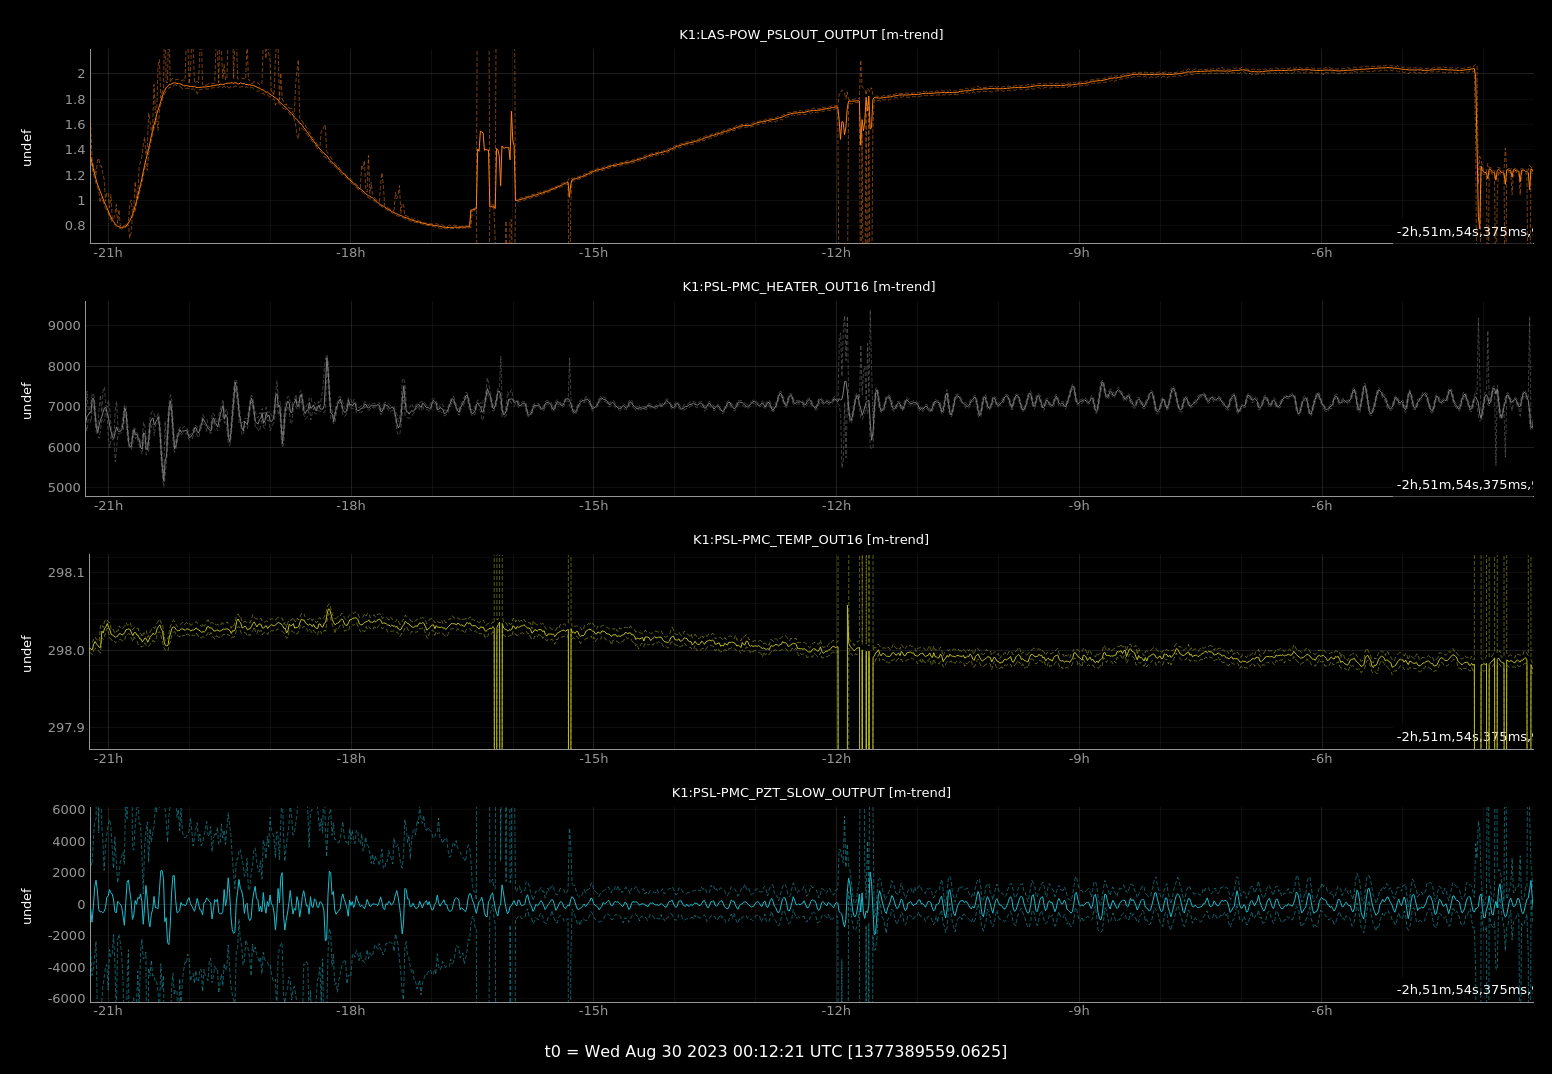
The attachment 3 shows the trend of the power at various positions on the PSL.
Note that S-pol power after the EOM increased while the PSL output power decreased. It looks like a contradiction at first glance.
However, this could be explained as follows:
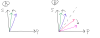
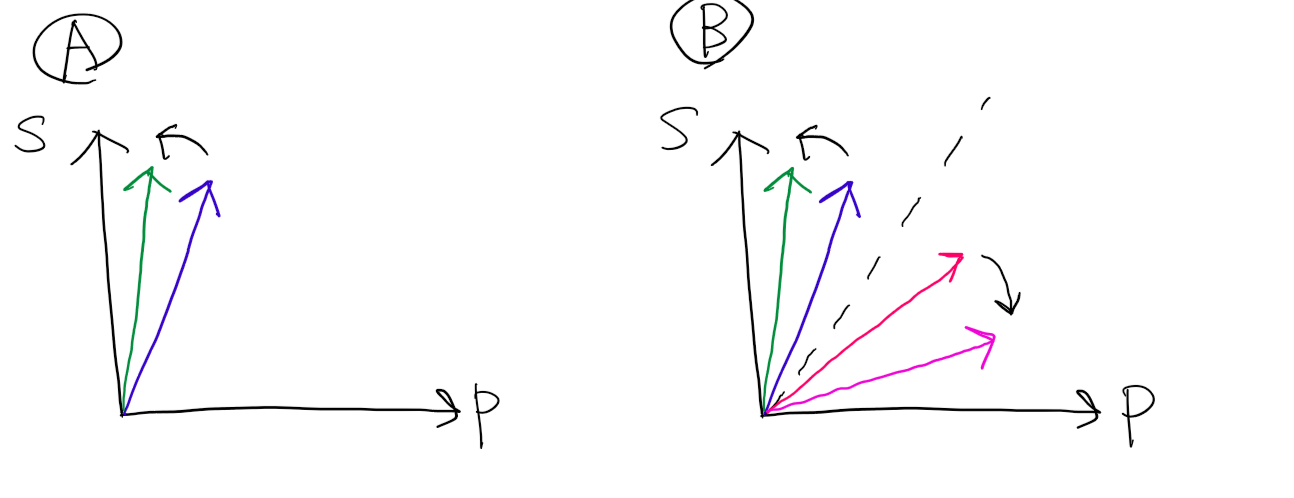
As shown in the attachment 4, initially the polarization state is mostly in S-pol (A).
Currently the PMC power is about 10W while the PSL out is 2W. This means, before the TFP the polarization is rotated to be P-pol dominant as shown in (B).
When the HWP axis is adjusted like that, if the polarization is rotated by the EOM to increase the S-pol content (from blue to green in the attachement 5), the polarization state after the HWP has less S-pol content (red to pink in (B) of attachment 5). Therefore, we can explain the above behavior.
However, as the trend plots show, near the end of the plot, both S-pol and P-pol increases. This cannot be explained by the above theory.
In fact, as the PMC output power is almost constant, this behavior breaks the conservation of the energy.
We don't know how to explain it at this moment.


