Abstract
I checked spectral peaks that can be seen on both DARM and other DoF of LSC controls
and found 9.766Hz (72 peaks) and 99.998Hz (10 peaks) series on both DARM and CARM.
Peak list can be seen on https://gwdet.icrr.u-tokyo.ac.jp/~controls/misc/html/knownlines_o4a.html.
Details
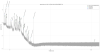
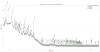
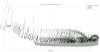
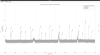
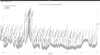
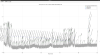
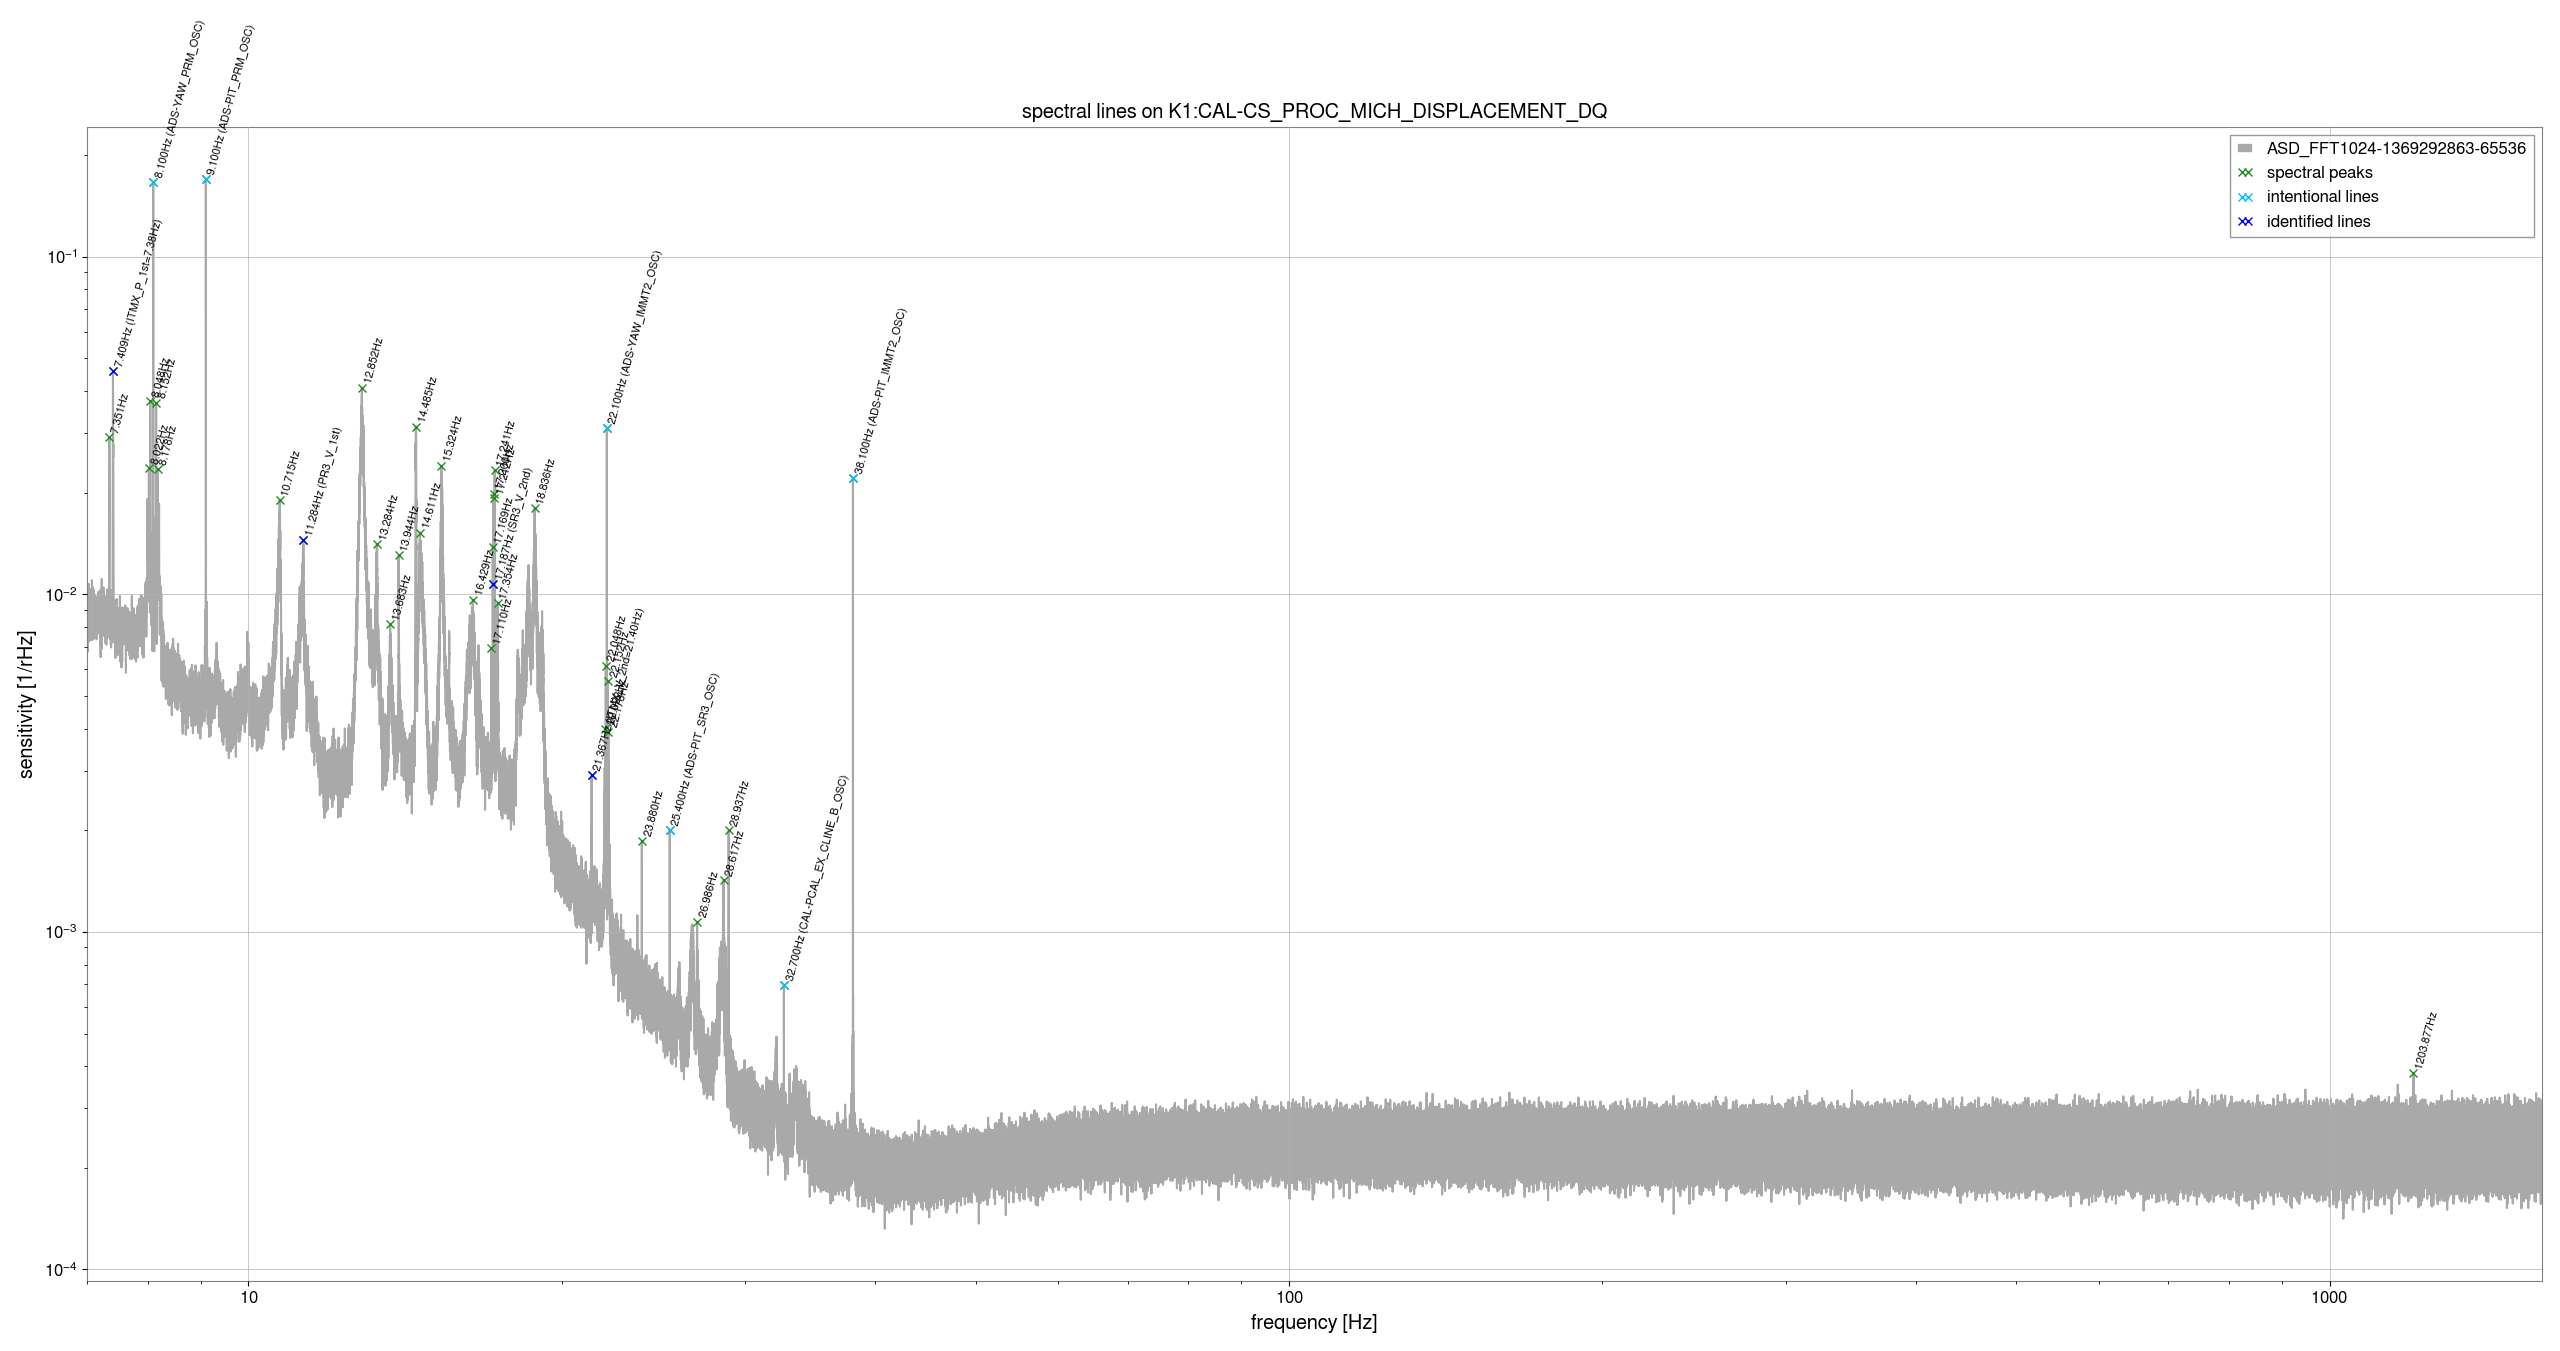
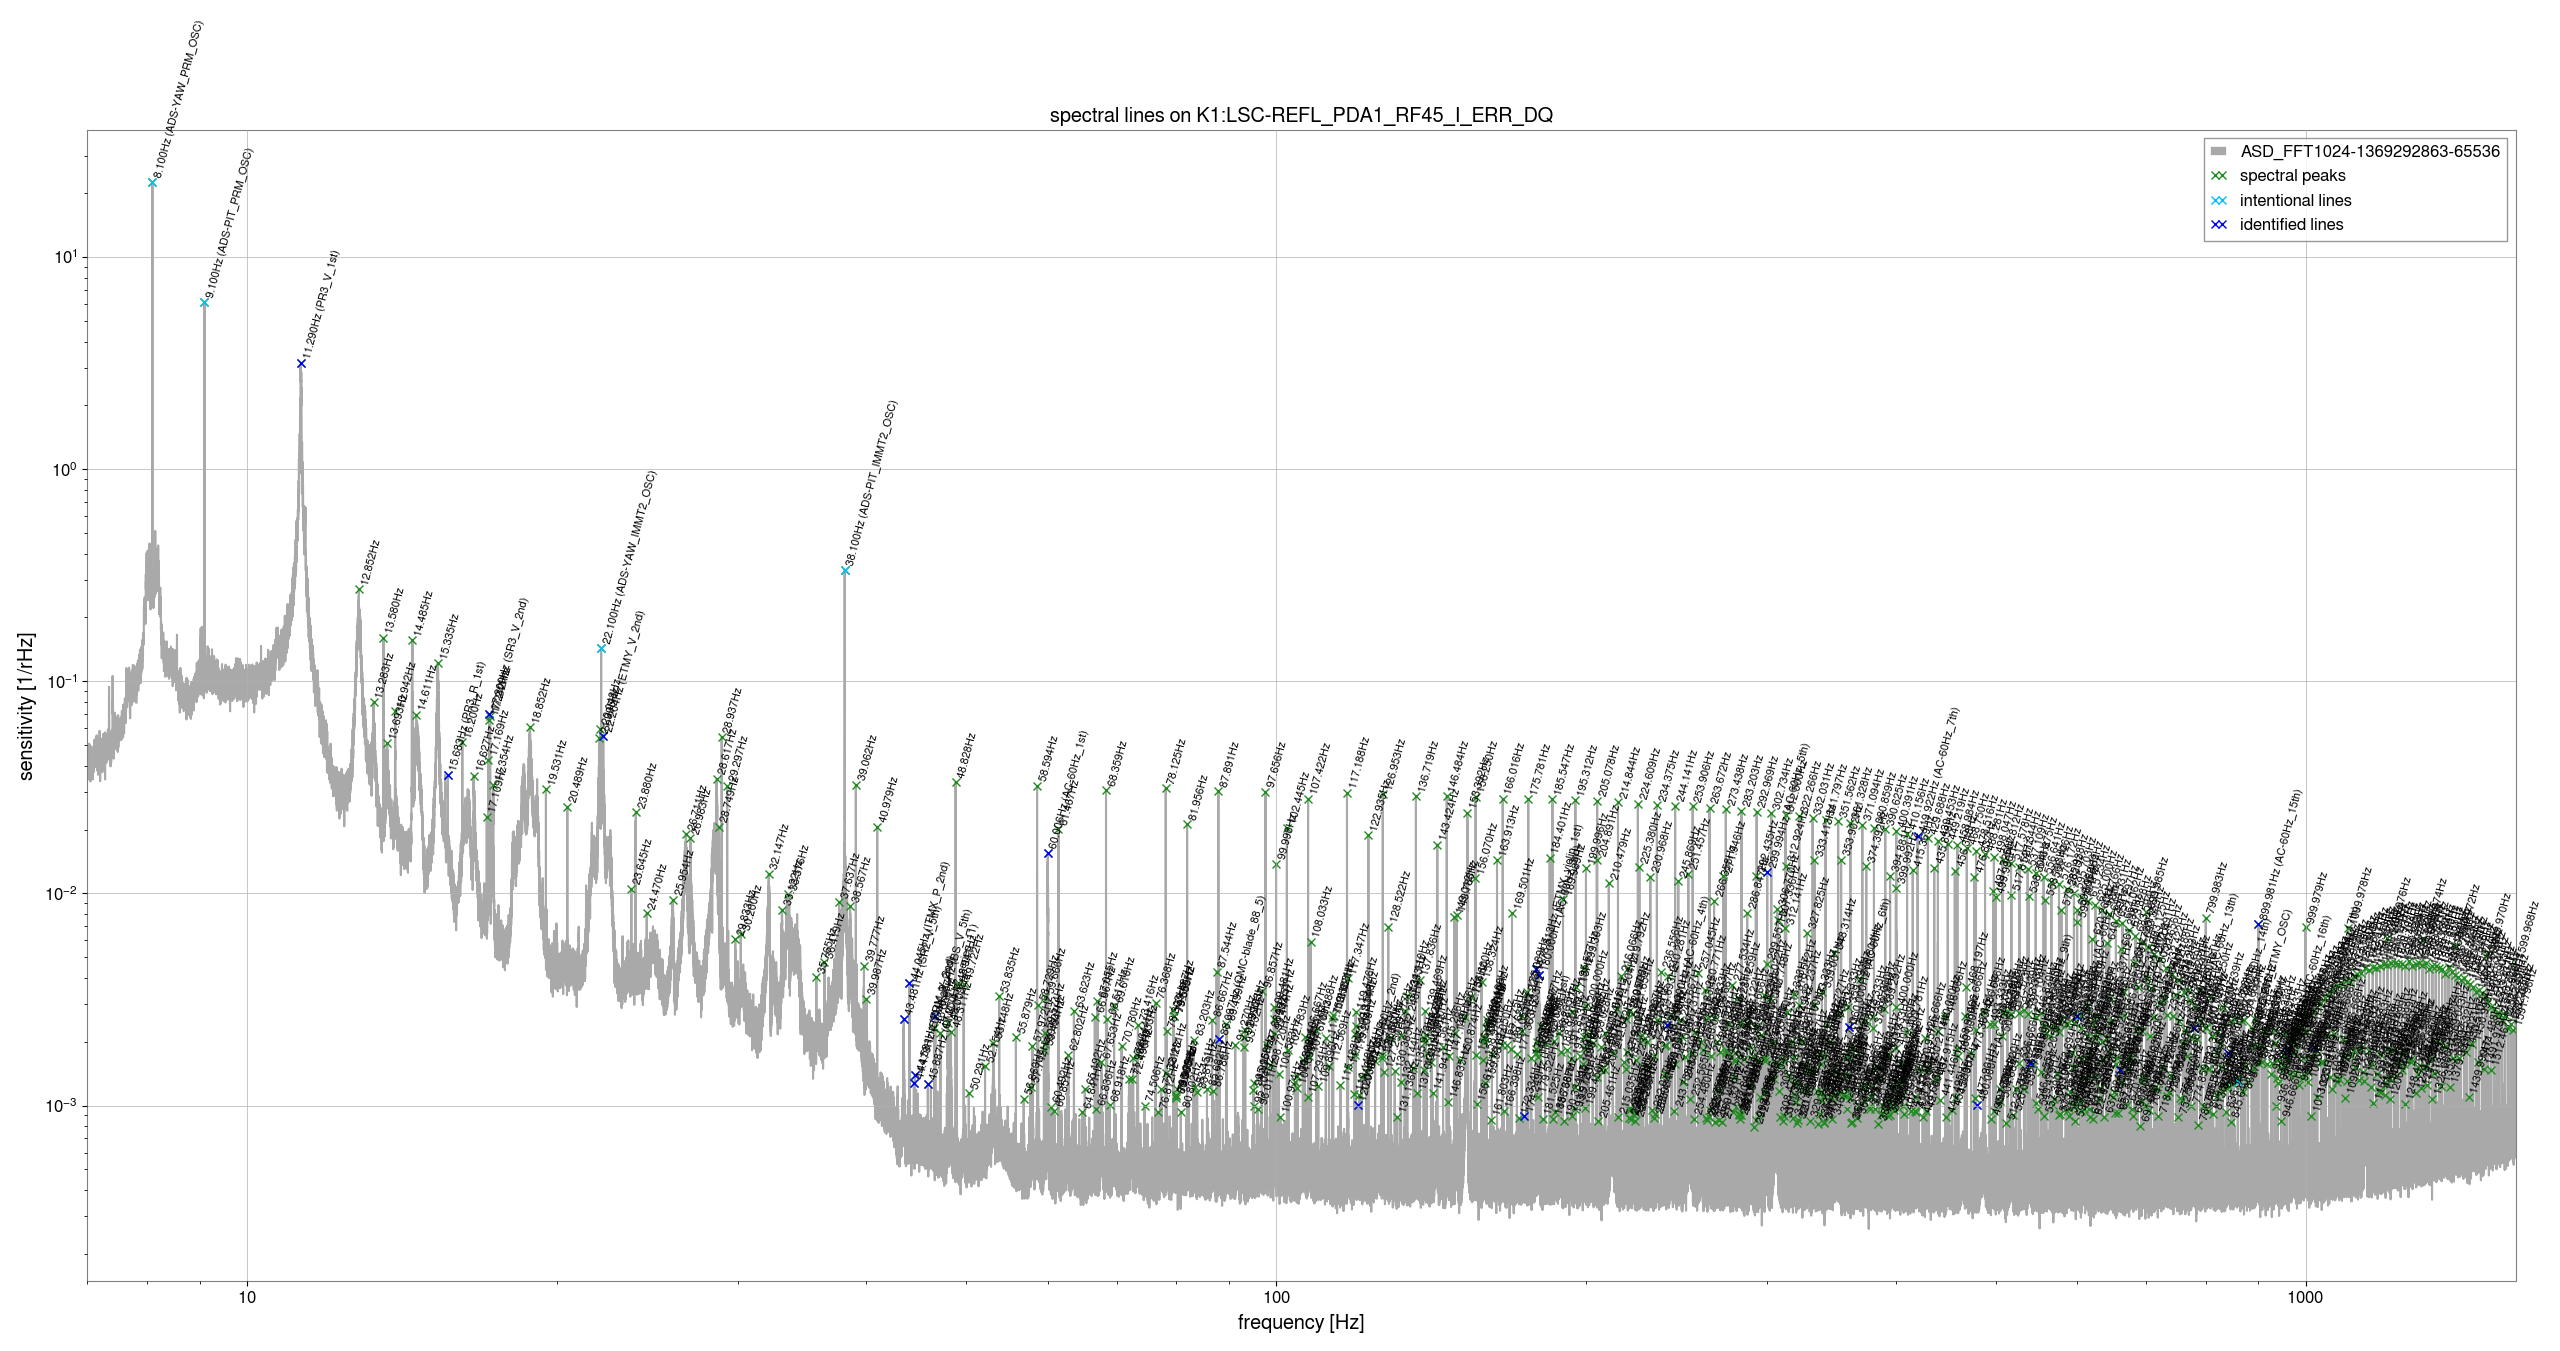
For checking the frequency of spectral peaks on MICH, PRCL, and CARM,
I applied the peak find tool to the calibrated displacement of MICH (Fig.1) and PRCL (Fig.2), and the error signal of CARM (Fig.3).
After then, I listed up unknown DARM peaks that frequency is same as ones on MICH, PRCL and CARM with 1mHz (1/1024Hz) resolution.
(I used the longest lock segments during O4a which starts 2023-05-28 15:50:45 JST.)
Almost all peaks on MICH lies below 40Hz and only one unknown peak is matched that frequency on DARM and MICH.
Of course some peaks coming from the resonance of ITMs etc. exists. But they are now ignored as already known peaks.
Because so many series peaks can be seen on PRCL and CARM (especially CARM is dirty spectrum),
I tried to estimate a frequency of the fundamental mode of these series.
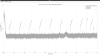
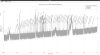
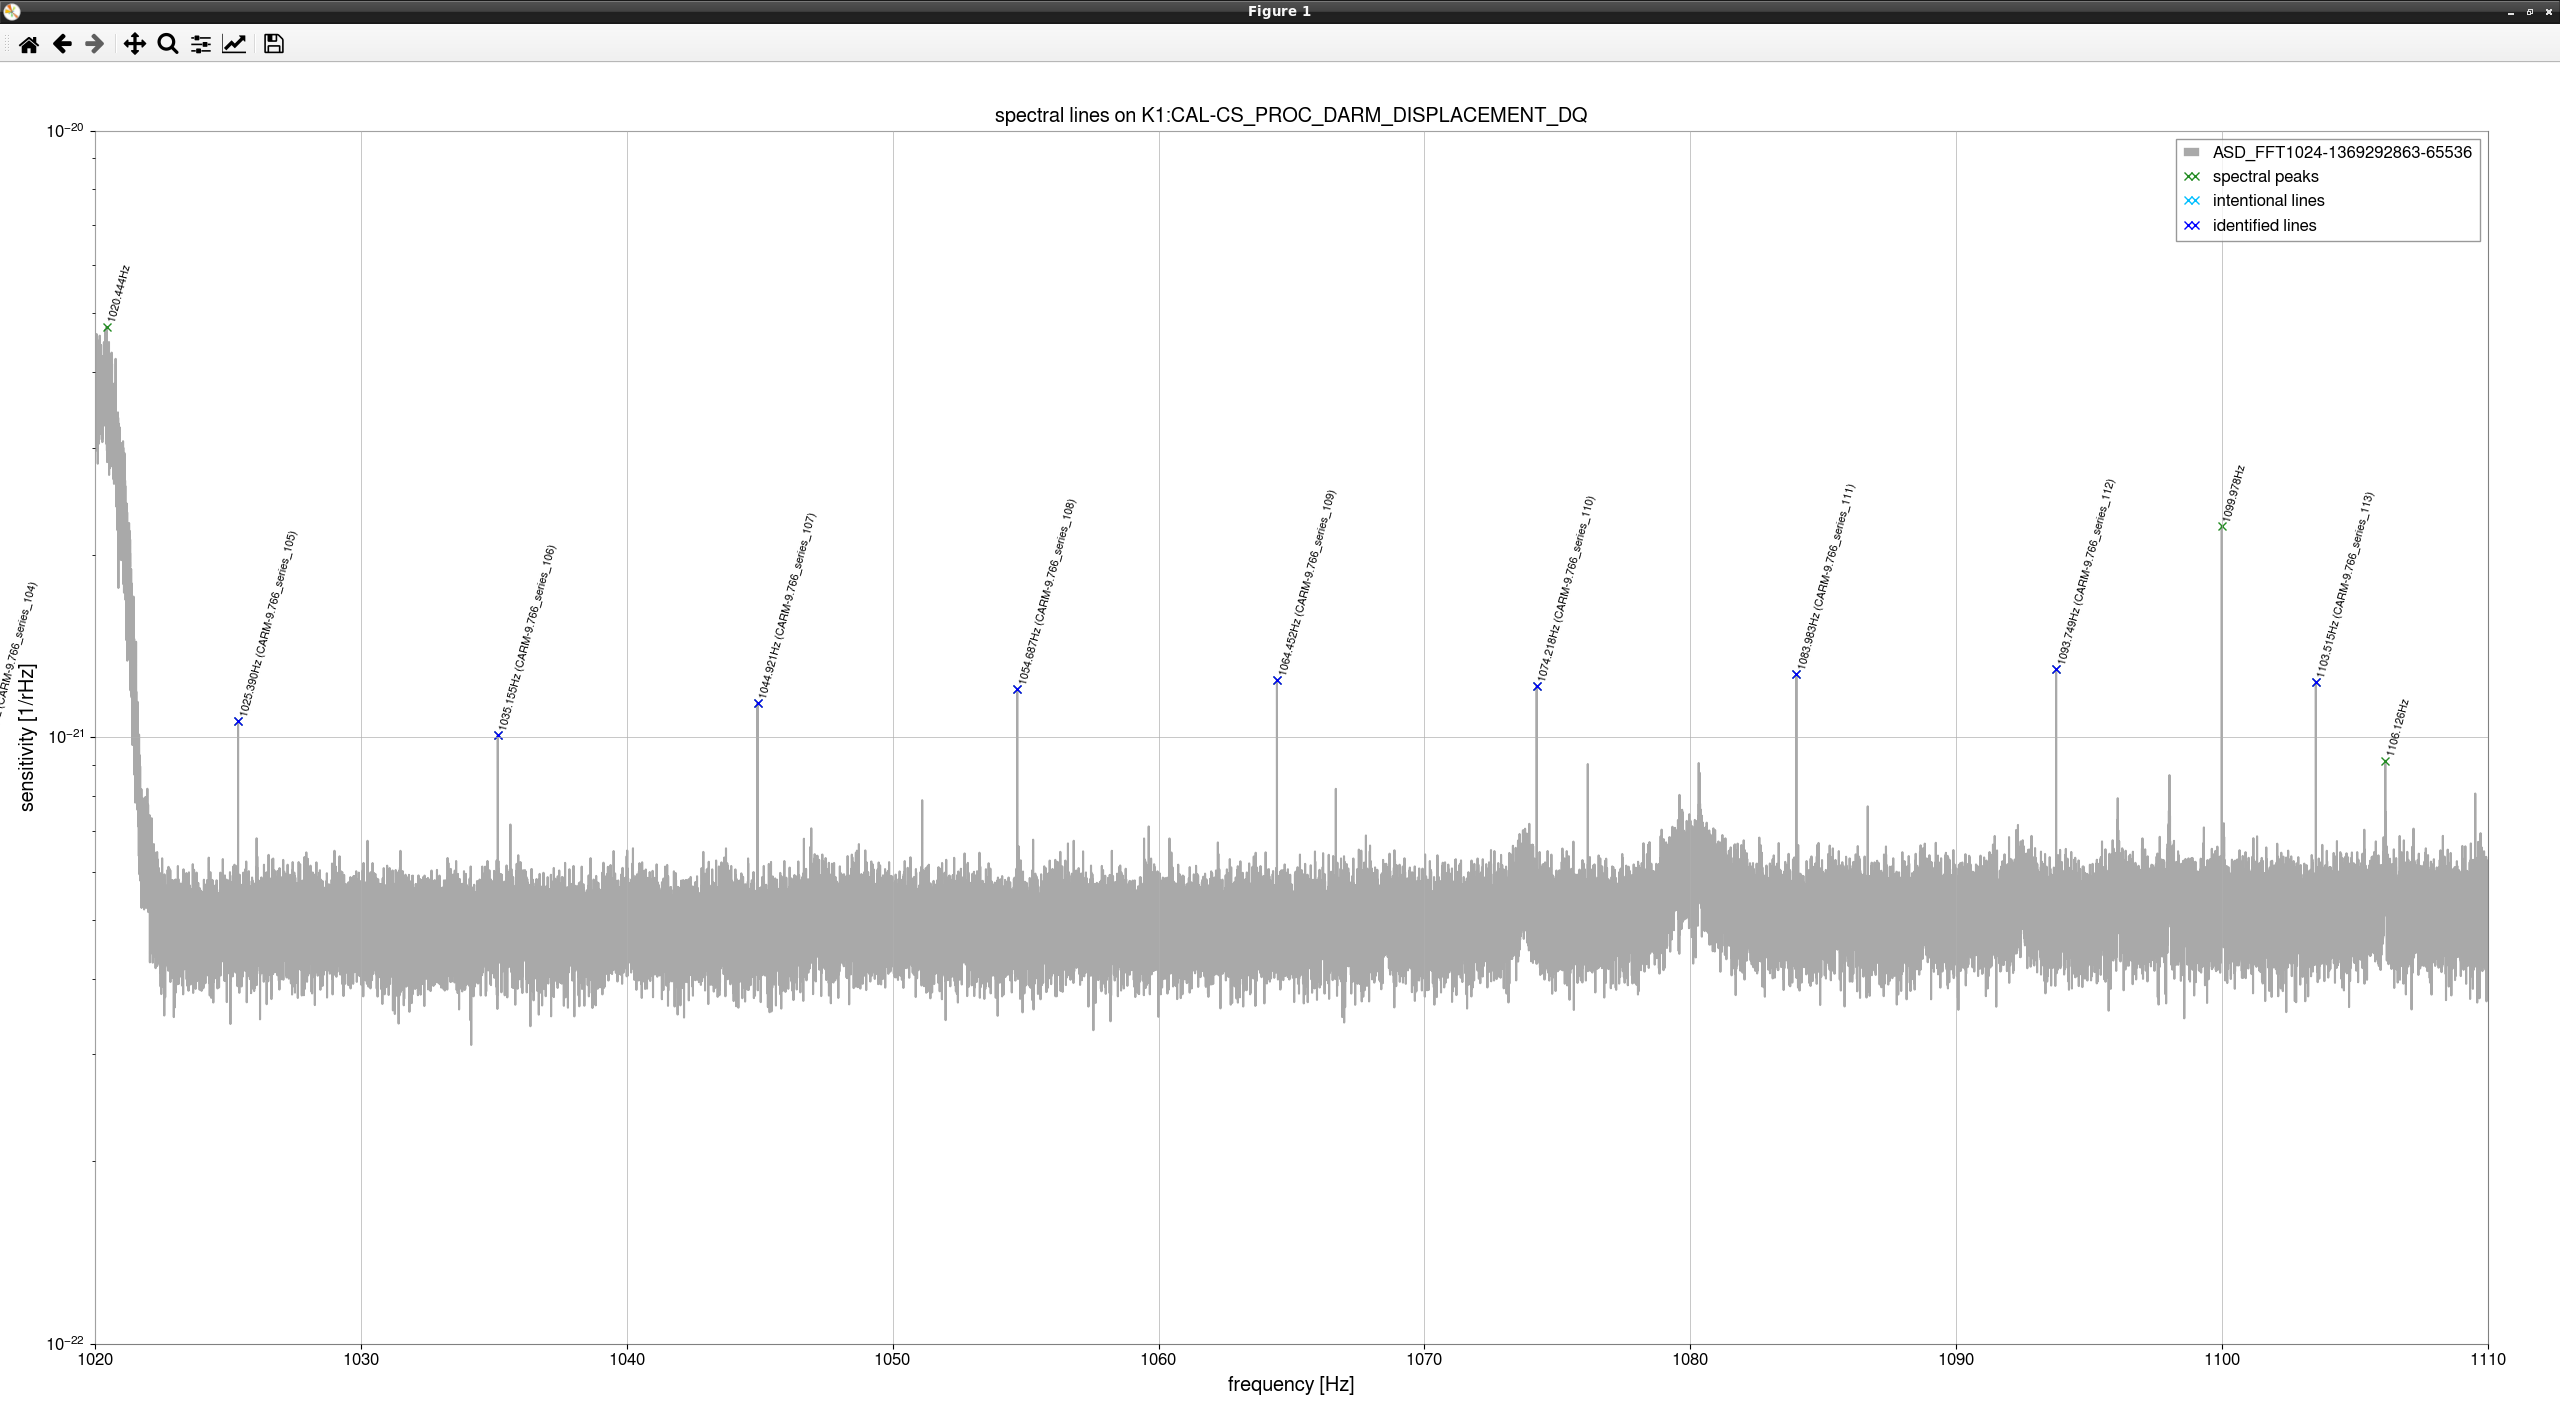
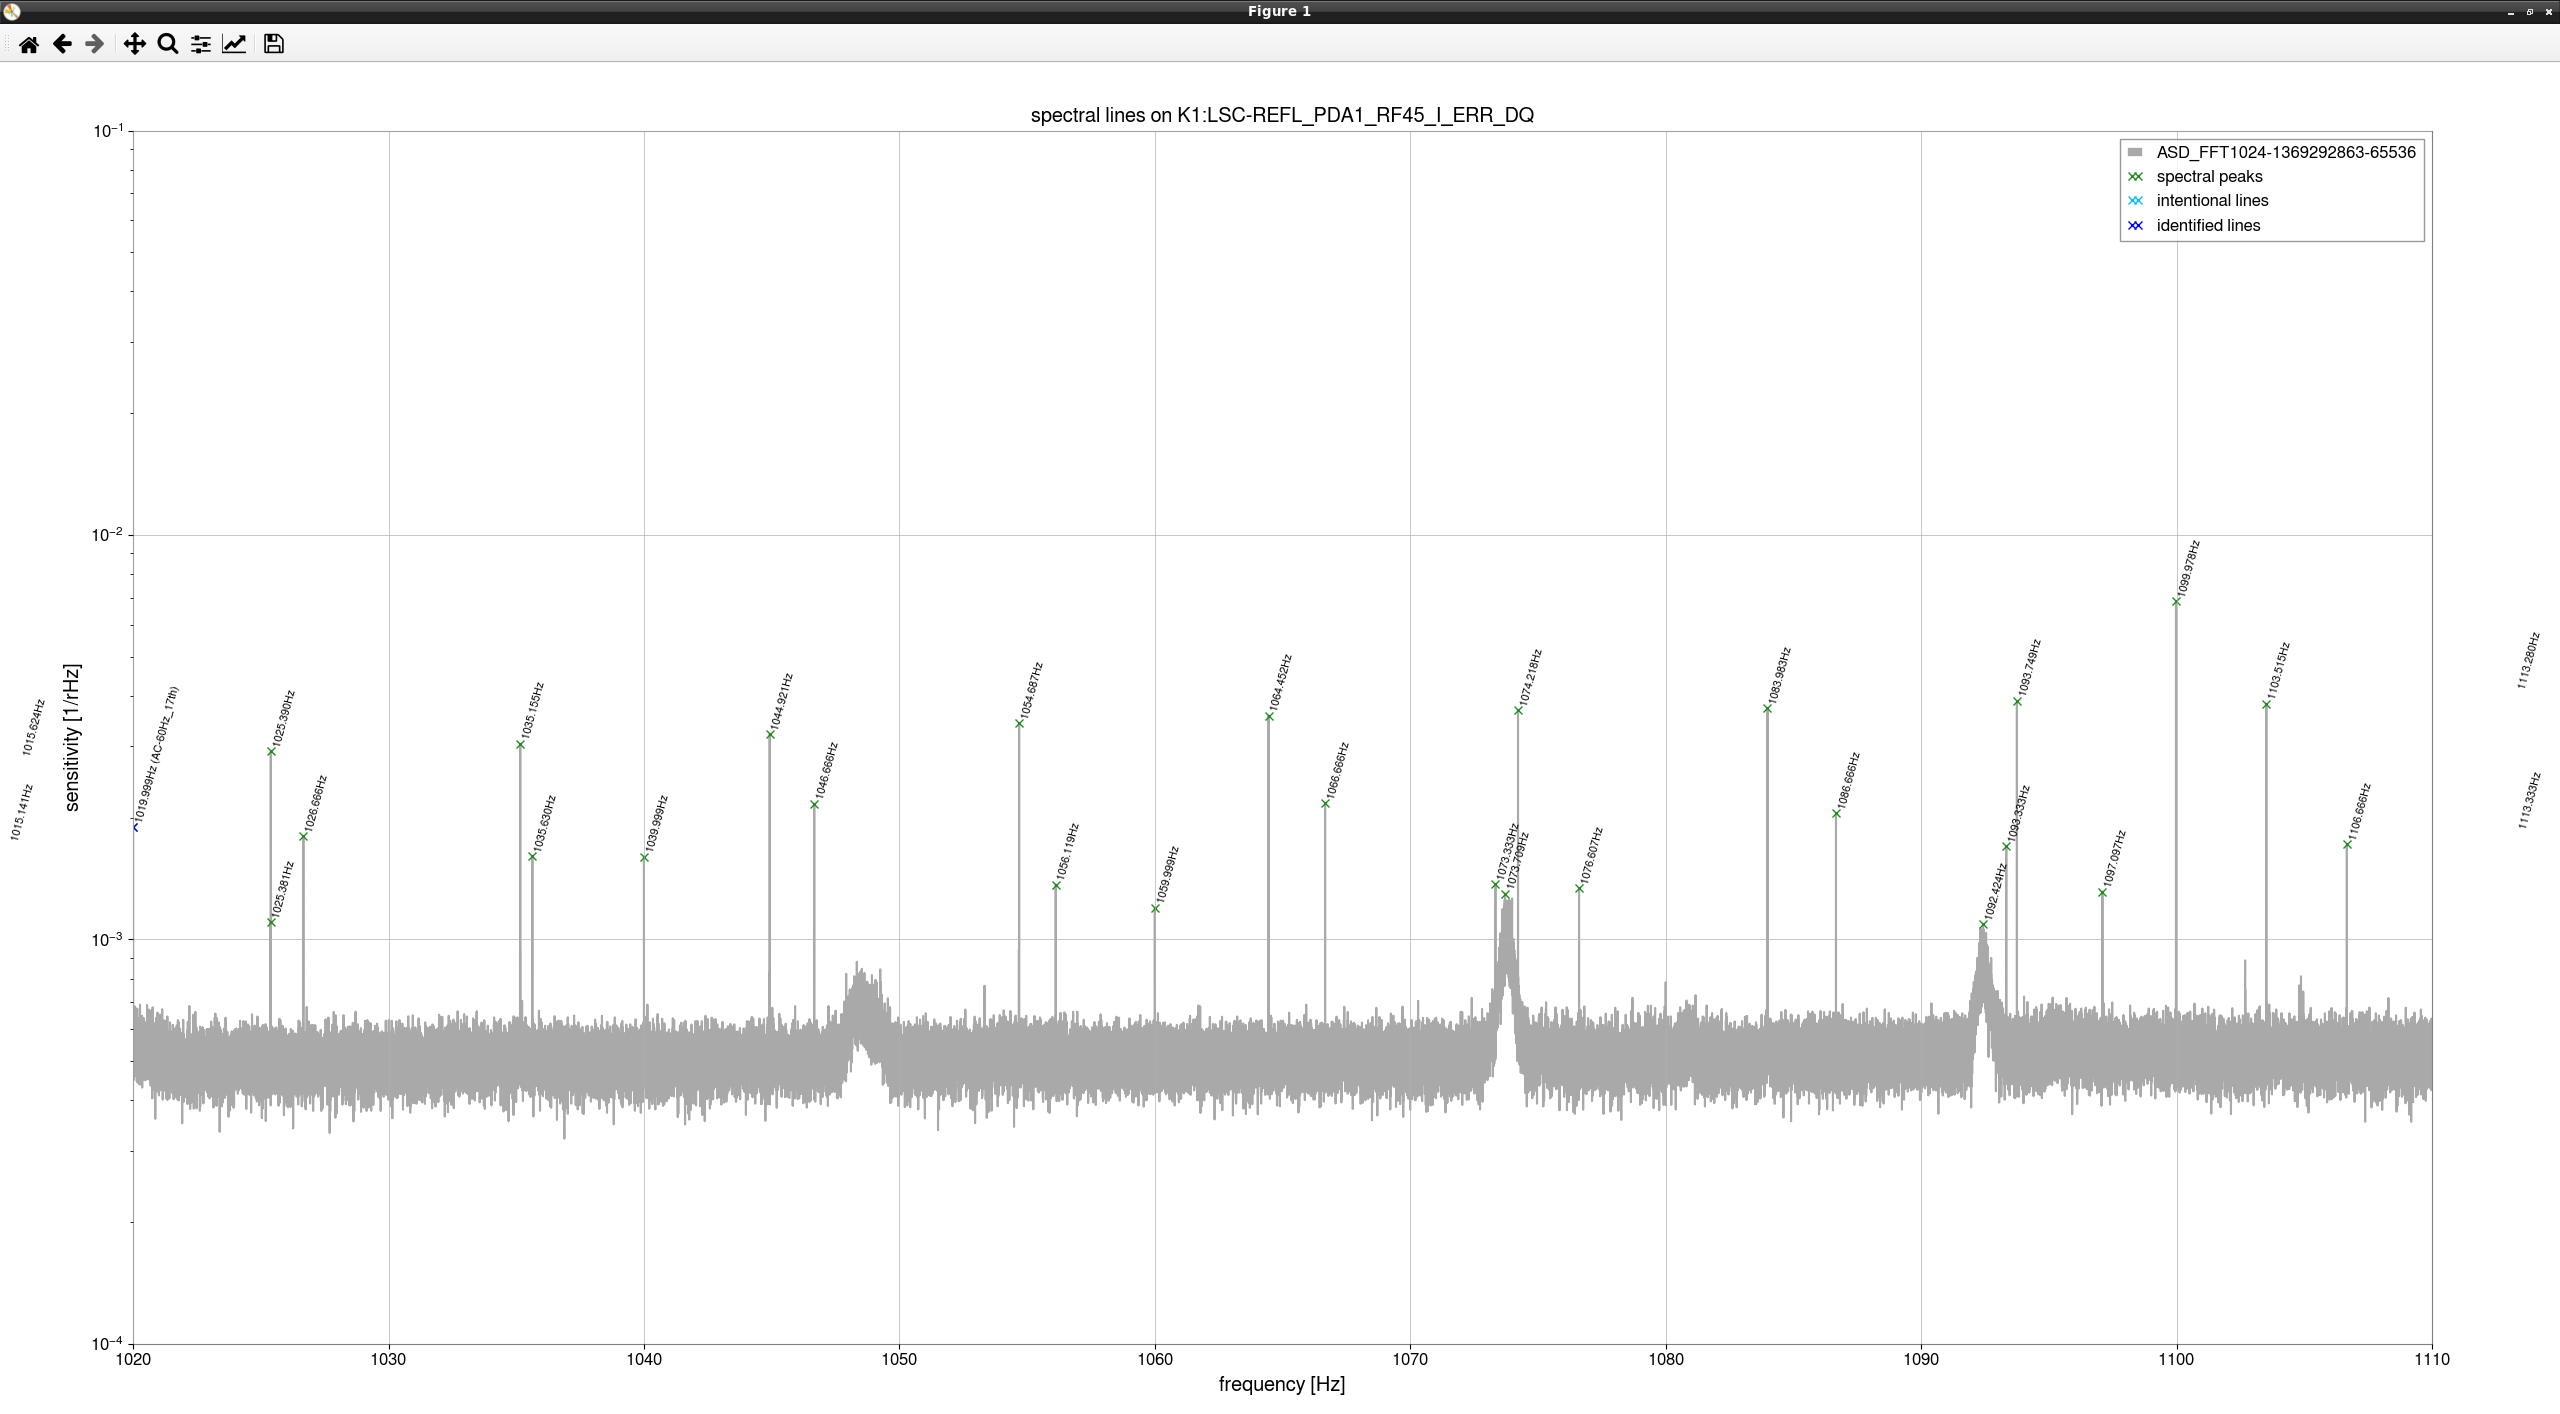
For example, 9 peaks lie on CARM with the same interval (1025.390, 1005.155, ... 1103.515Hz) as shown in Fig.4 (DARM) and Fig.5 (CARM).
In this case, fundamental mode frequency can be estimated as f0 = (1103.515 - 1025.390) / 8 ~ 9.766Hz.
In this way, fundamental mode can be estimated with better accuracy than the frequency resolution of spectrum.
So it's useful way for the case when we compute the frequency of high order harmonics in theoretically.
As the results of searching common peaks between DoFs and peak series,
frequency of 176 peaks on DARM are matched with one on CARM, MICH, and/or PRCL.
And also 137 of 176 peaks can be explained as the series of 9.766Hz and 99.998Hz.
A number of common peaks between DARM and other DoF is as follows.
| total | 9.766Hz series | 99.998Hz series | |
| DARM, CARM, MICH, PRCL | 1 | 0 | 0 |
| only DARM, CARM, MICH | 0 | 0 | 0 |
| only DARM, CARM, PRCL | 56 | 44 | 1 |
| only DARM, MICH, PRCL | 1 | - | - |
| only DARM, CARM | 118 | 72 | 10 |
| only DARM, MICH | 0 | - | - |
| only DARM, PRCL | 0 | - | - |
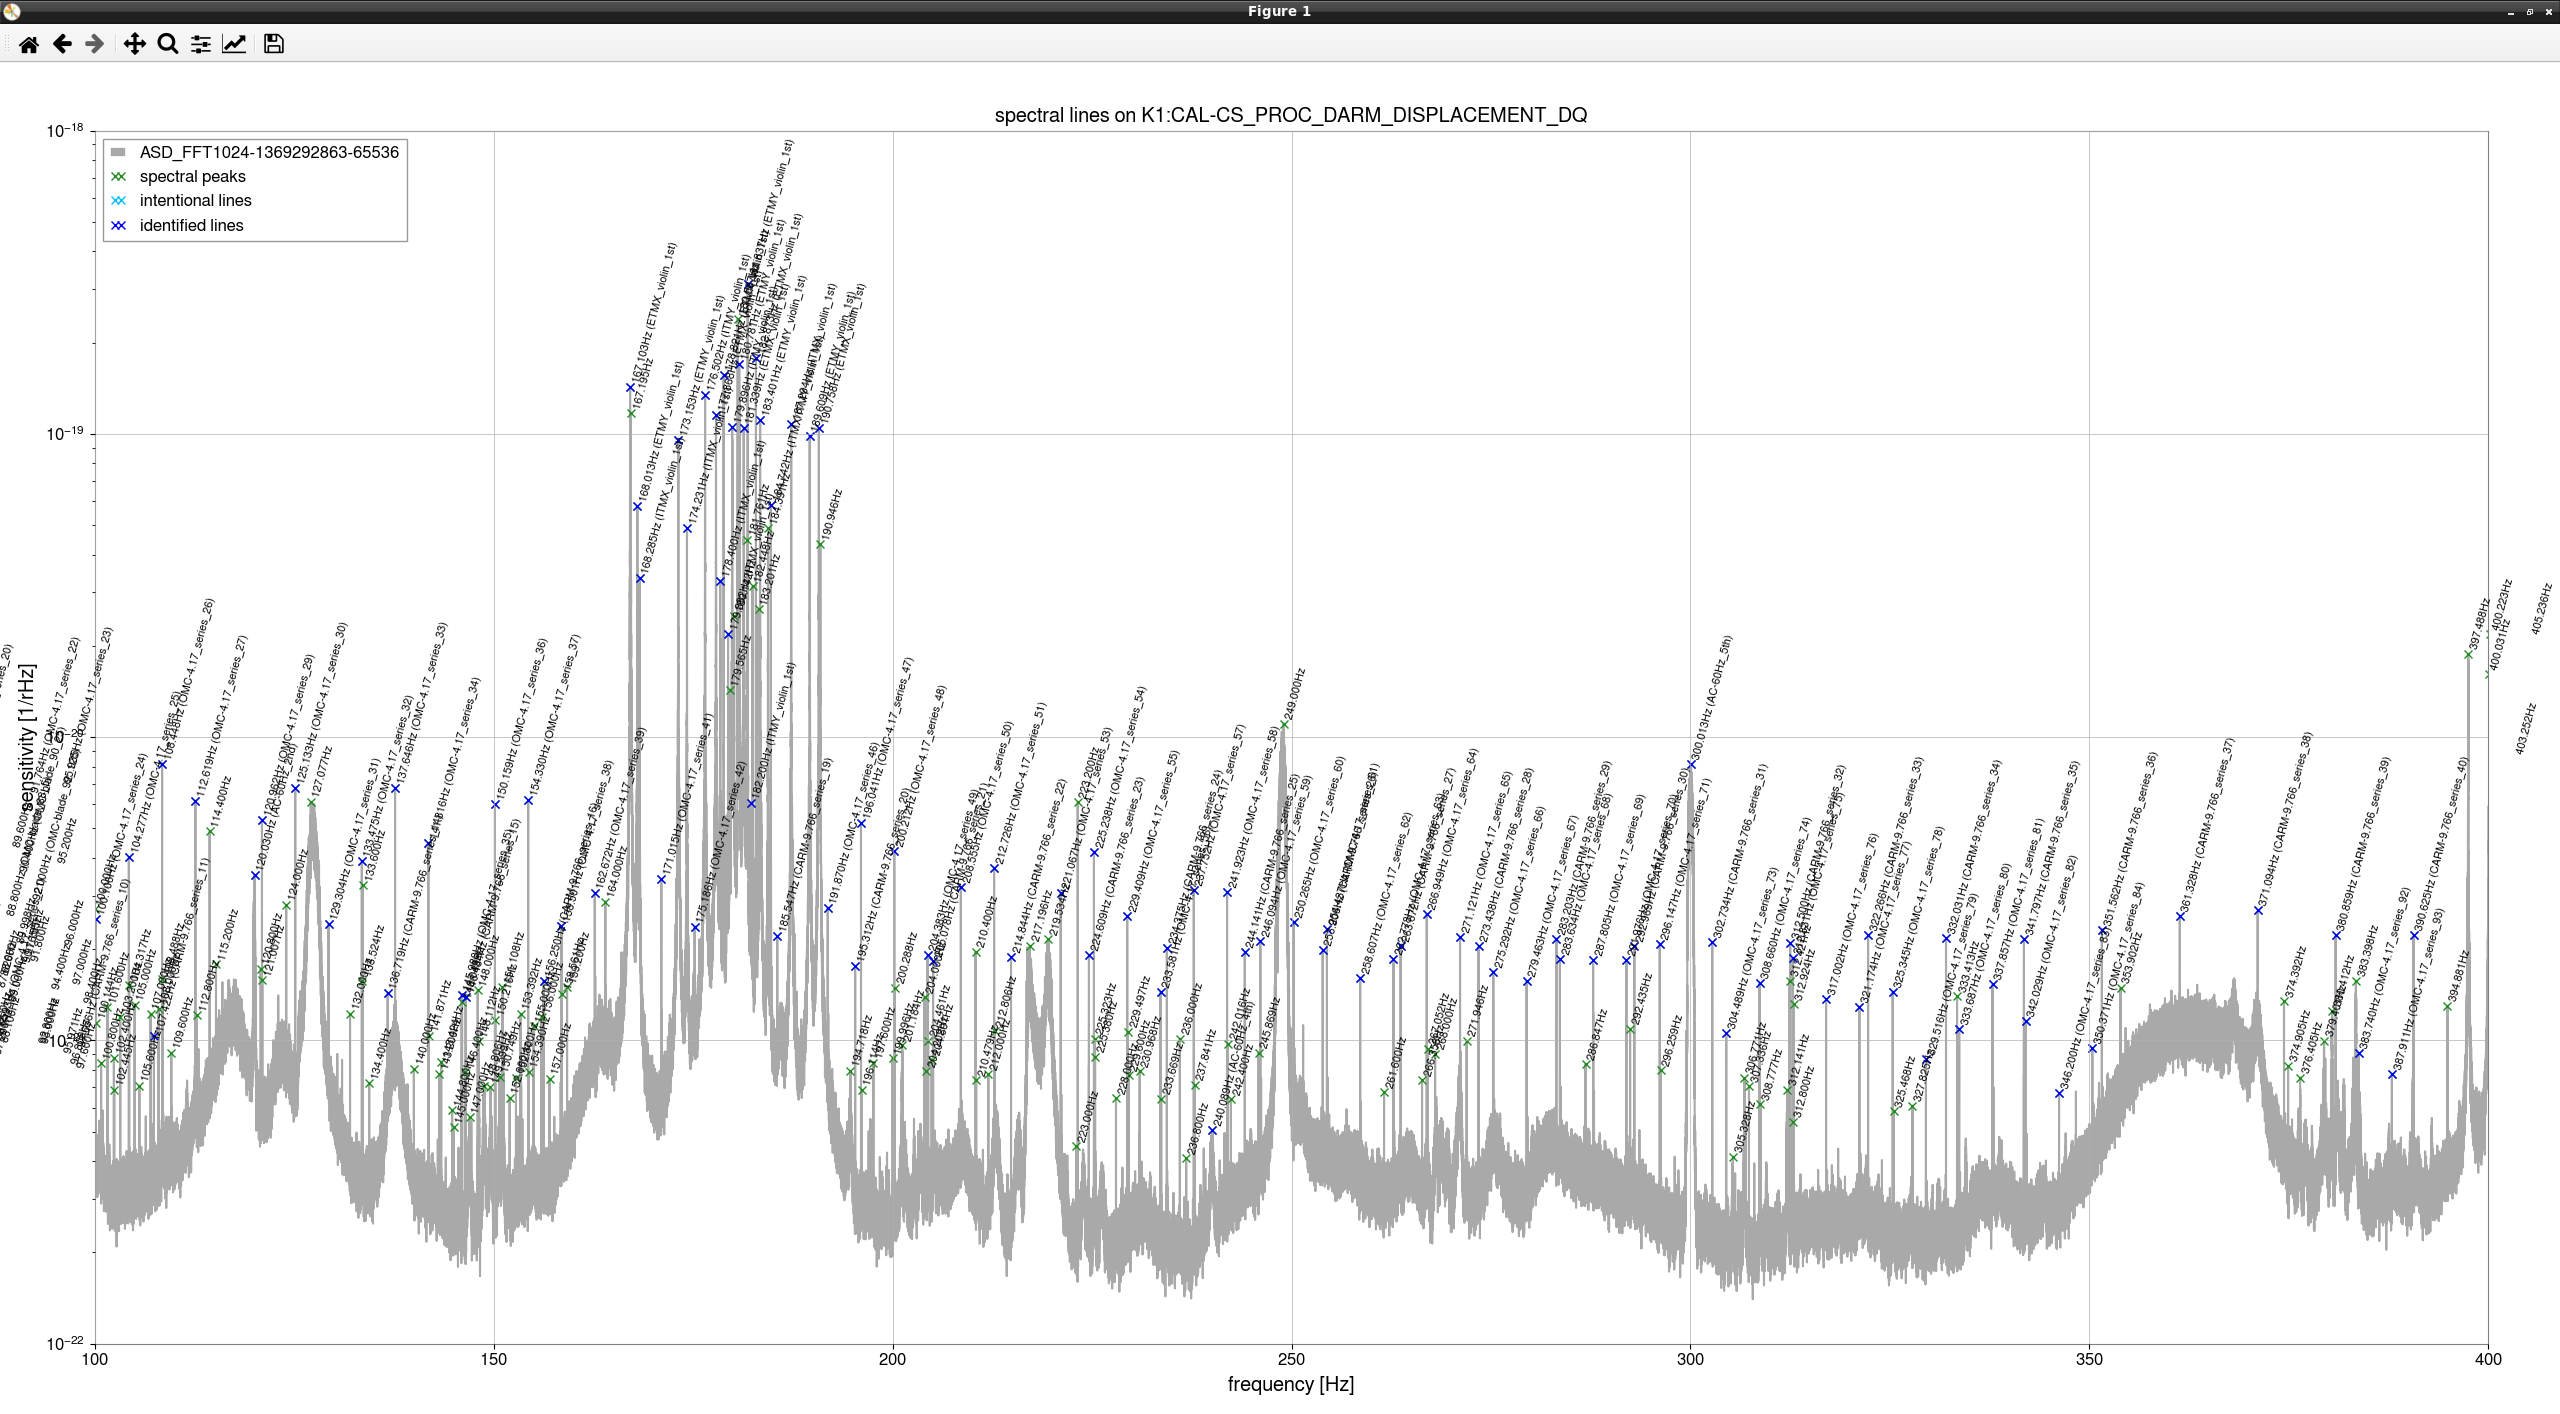
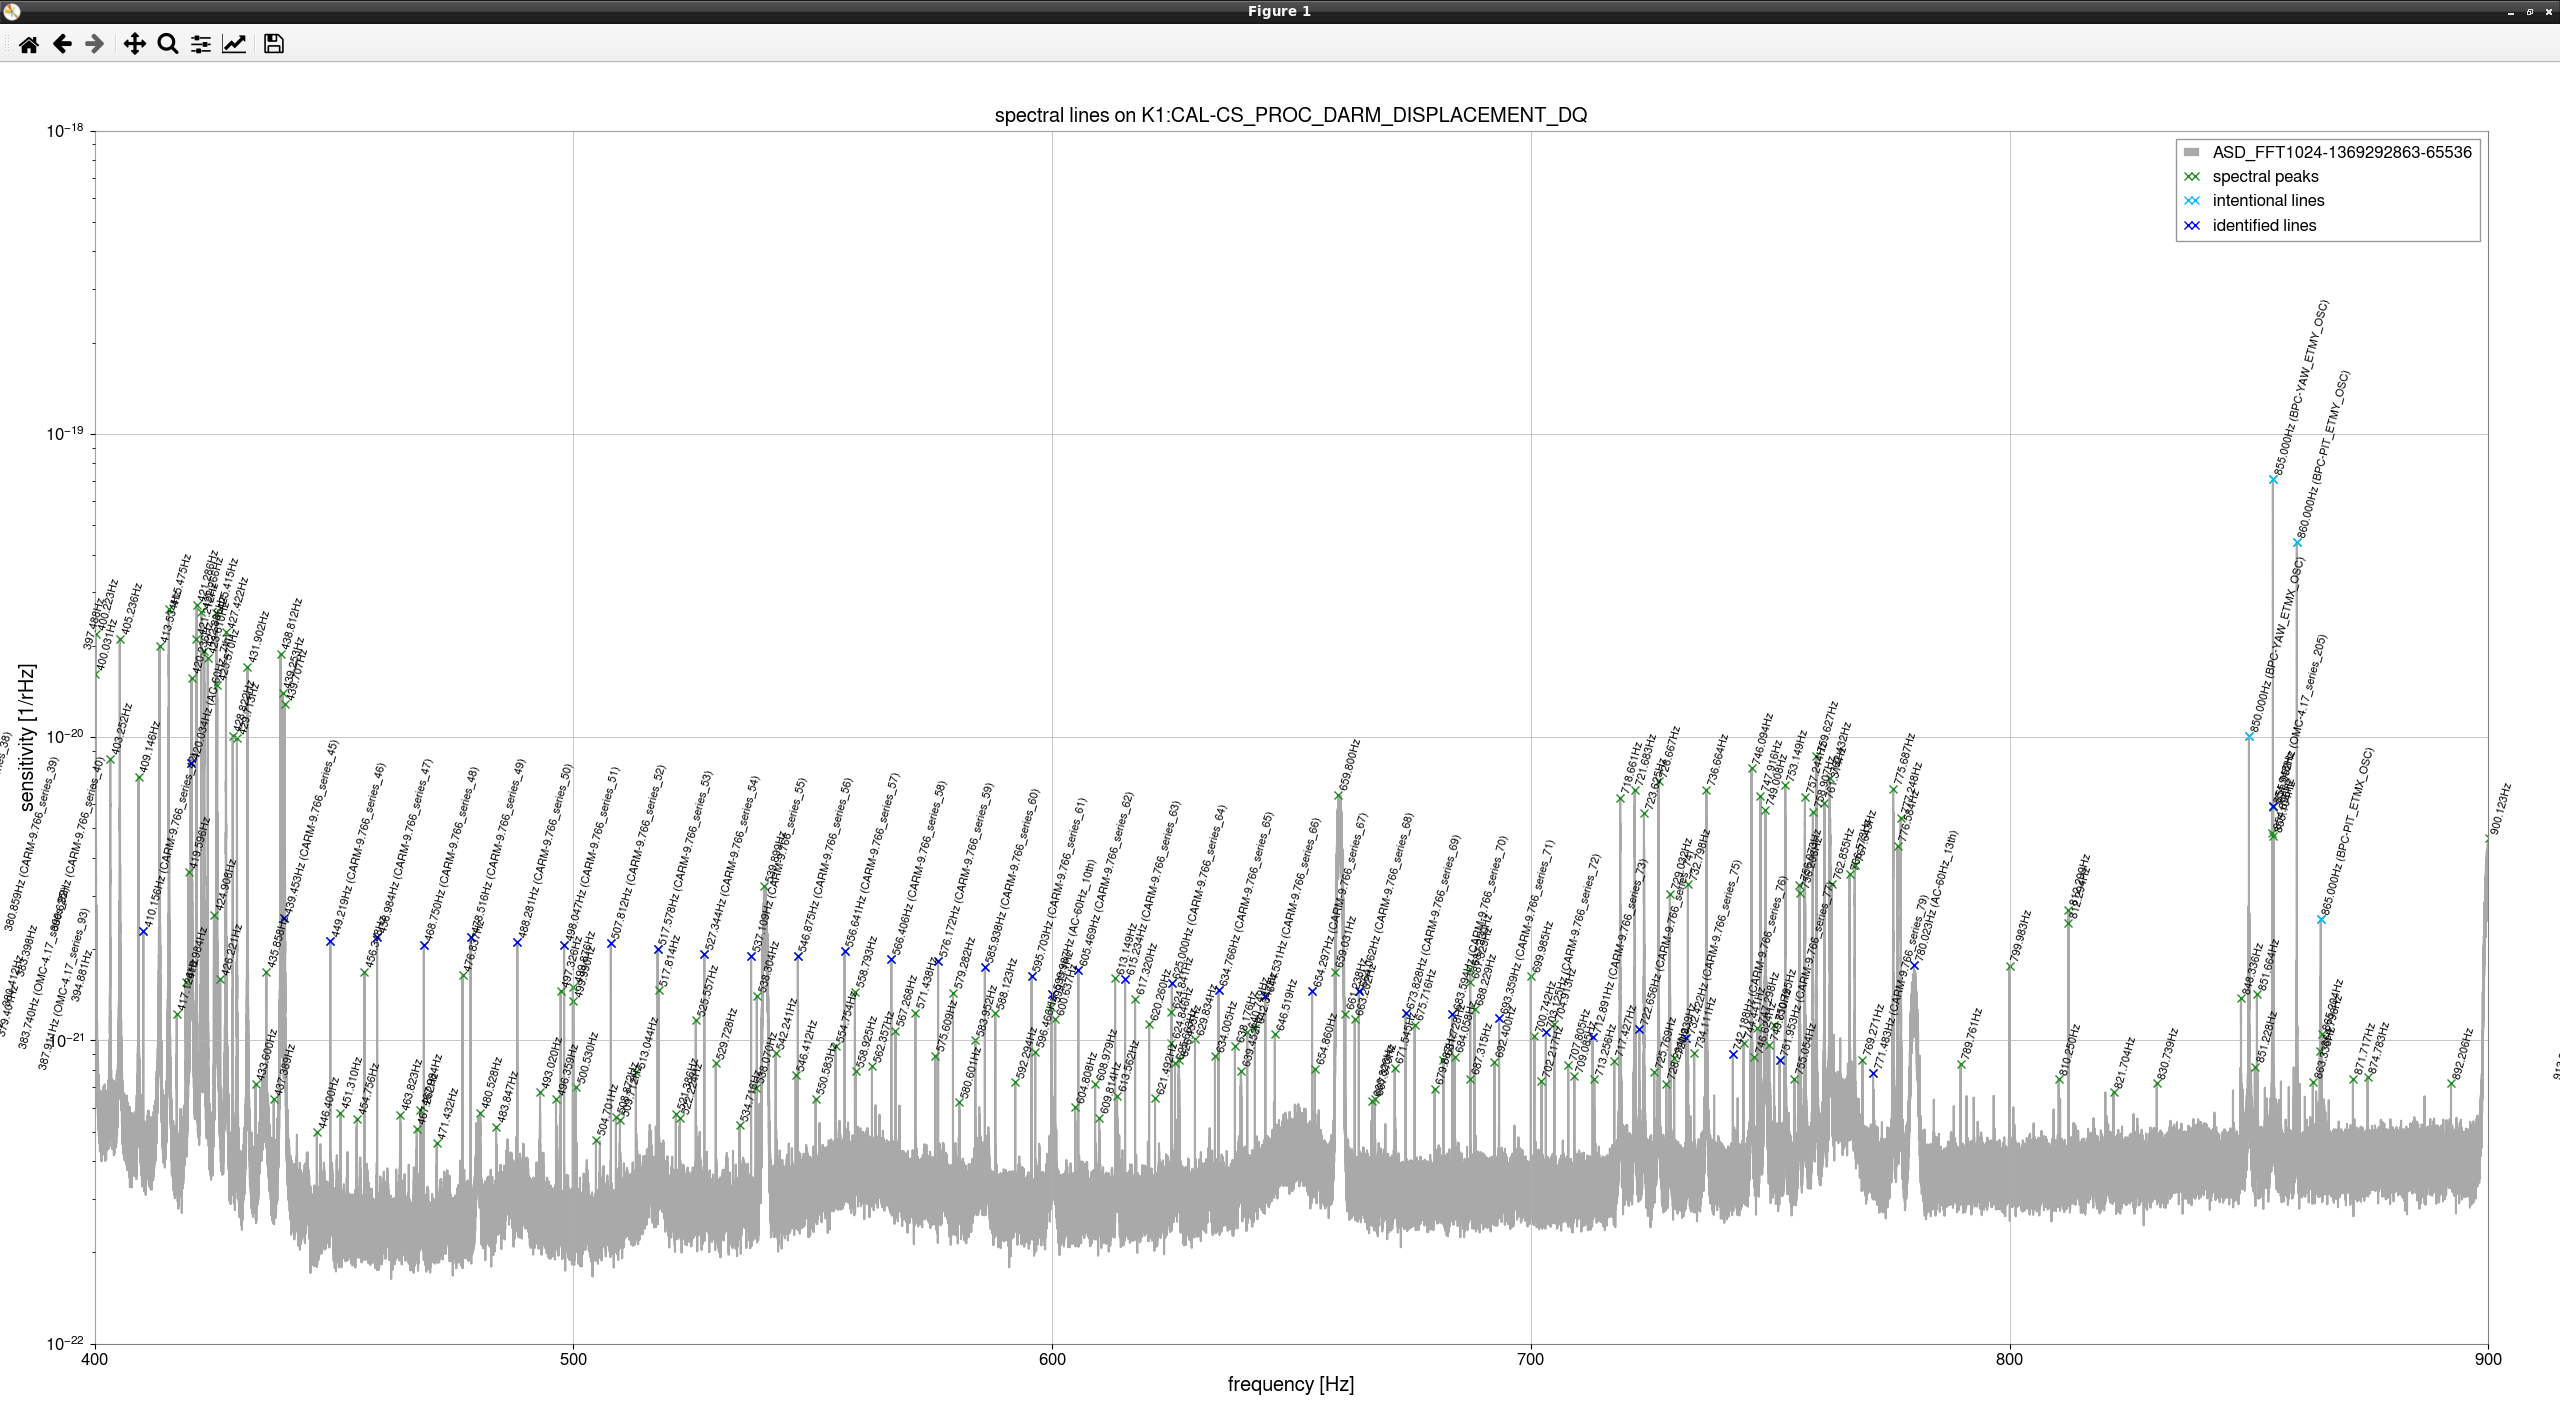
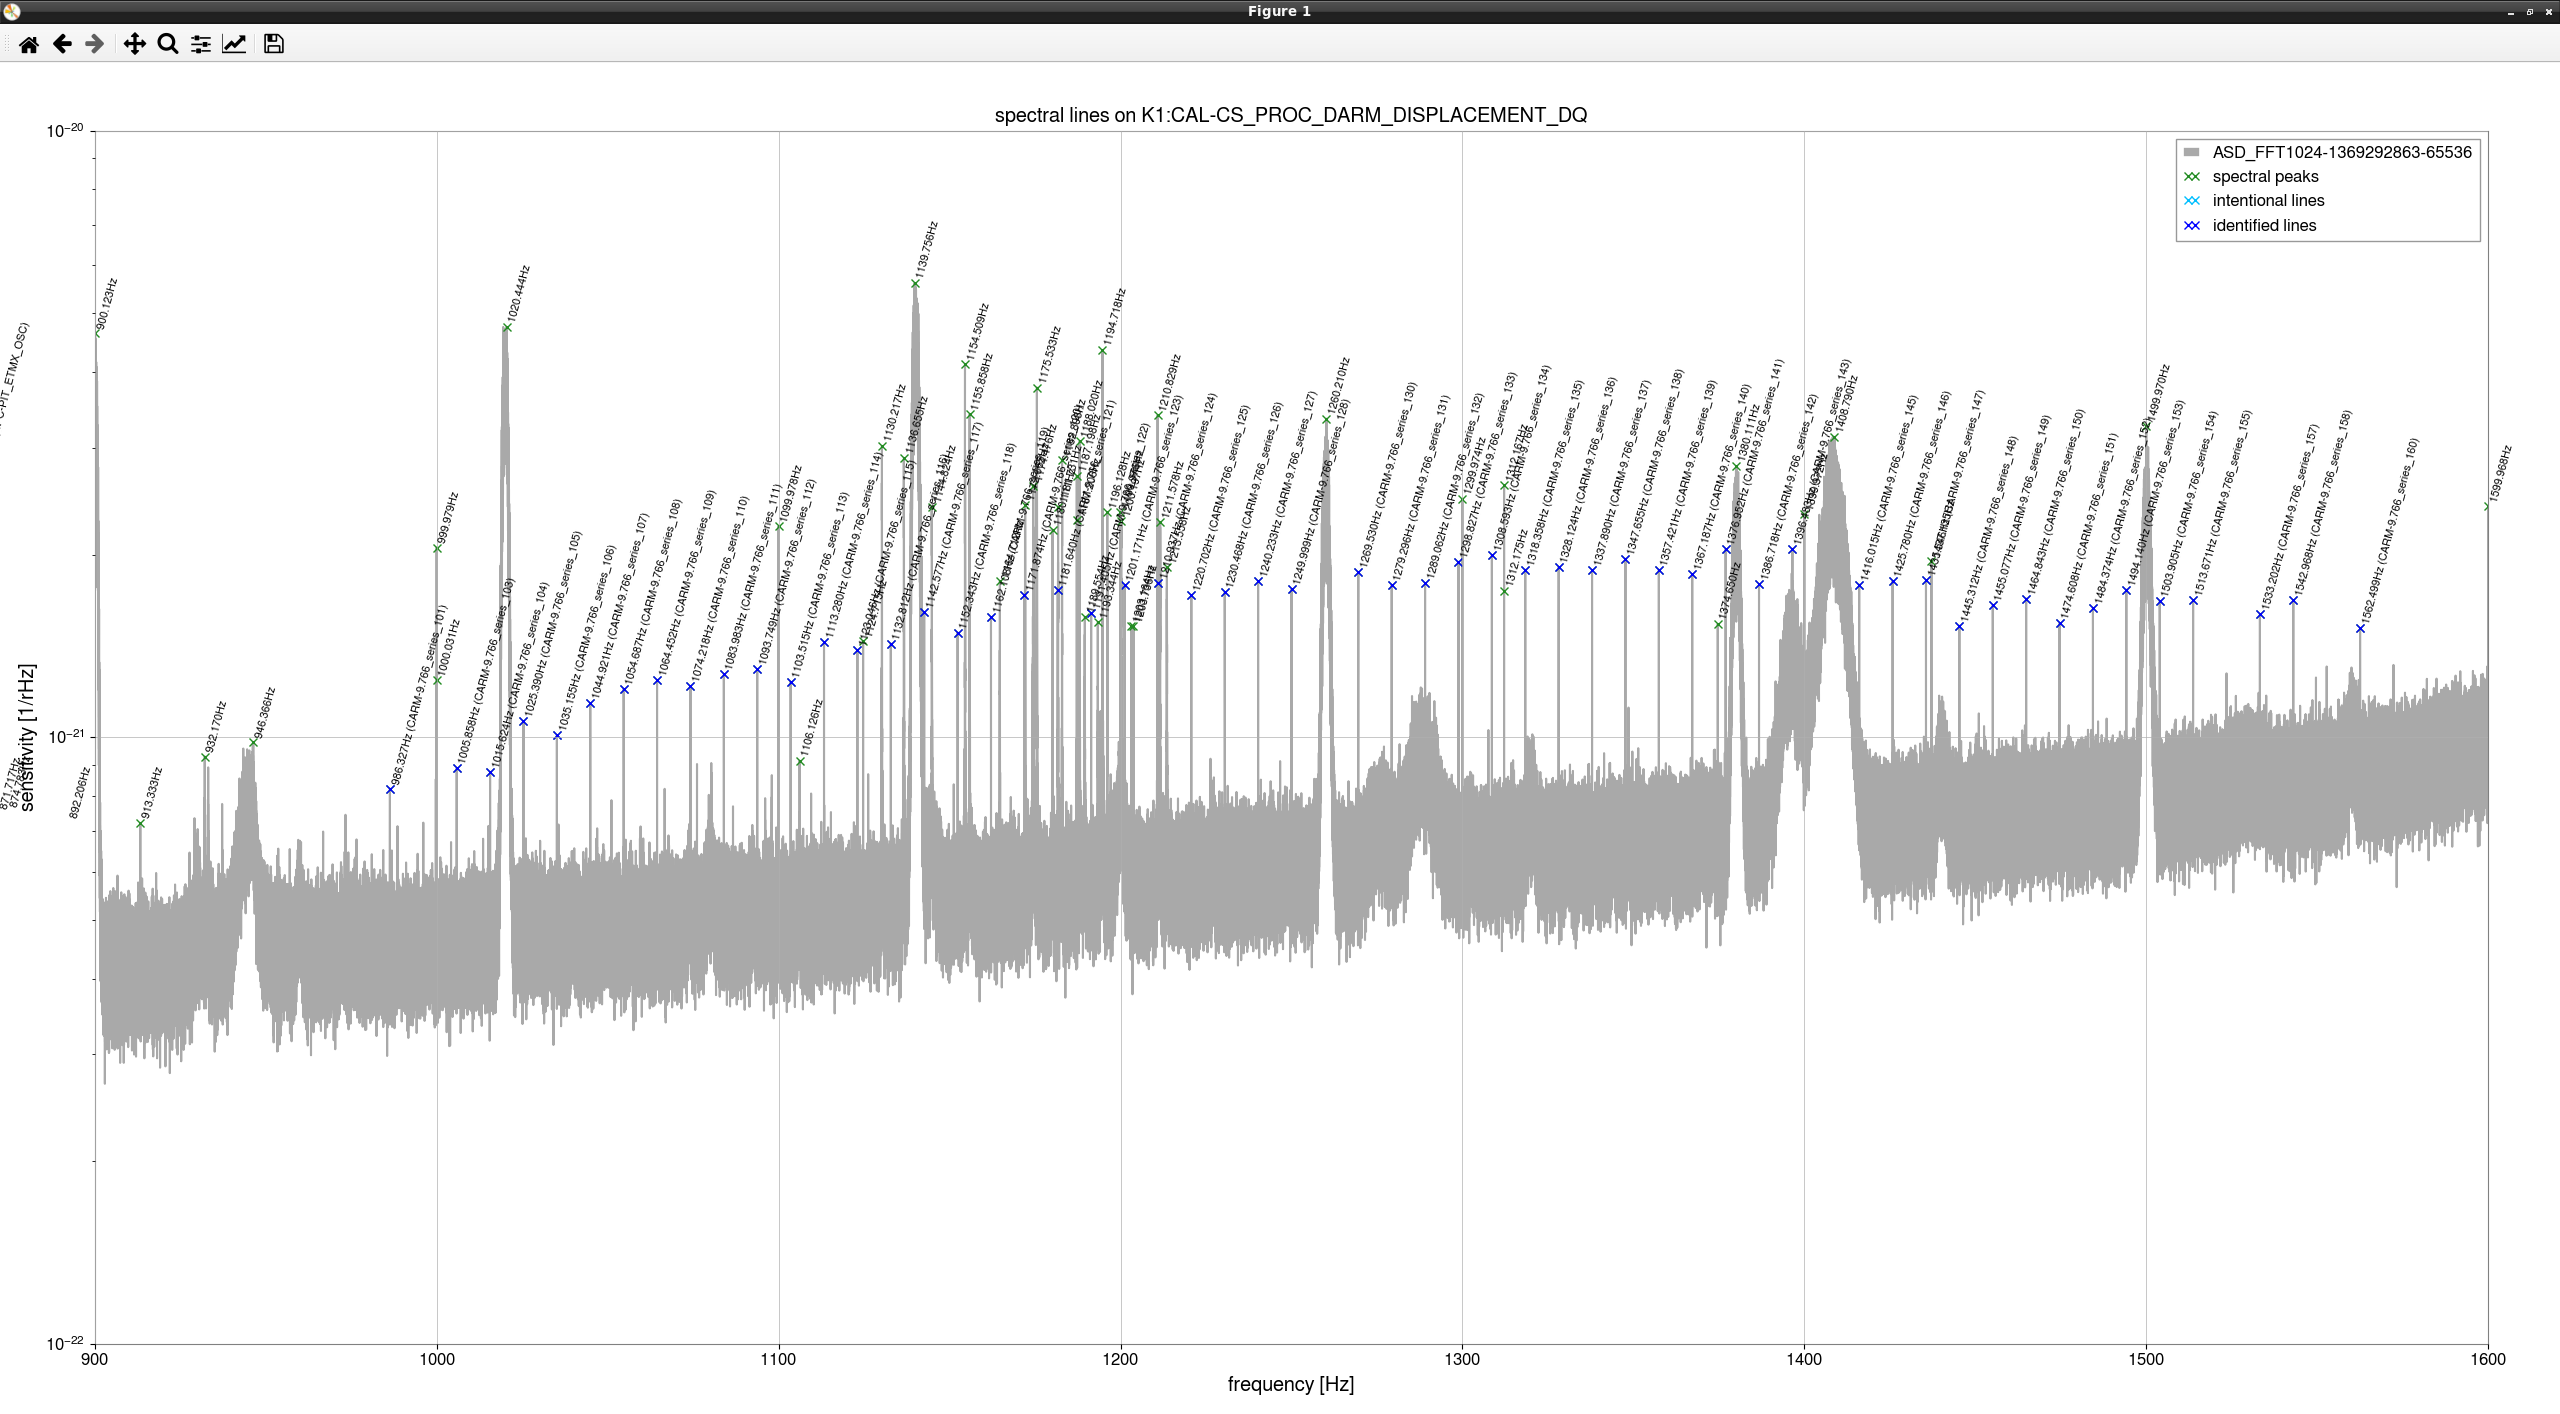
Many DARM peaks from 100Hz to 1000Hz and almost all peaks above 1000Hz can be explained 9.766Hz series
as shown in Fig.6 (100-400Hz), Fig.7 (400-1000Hz), and Fig.8 (1000Hz-1600Hz).