I am improving GauCh, a tool to evaluate the Gaussianity.
What I did:
I made four big changes.
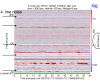
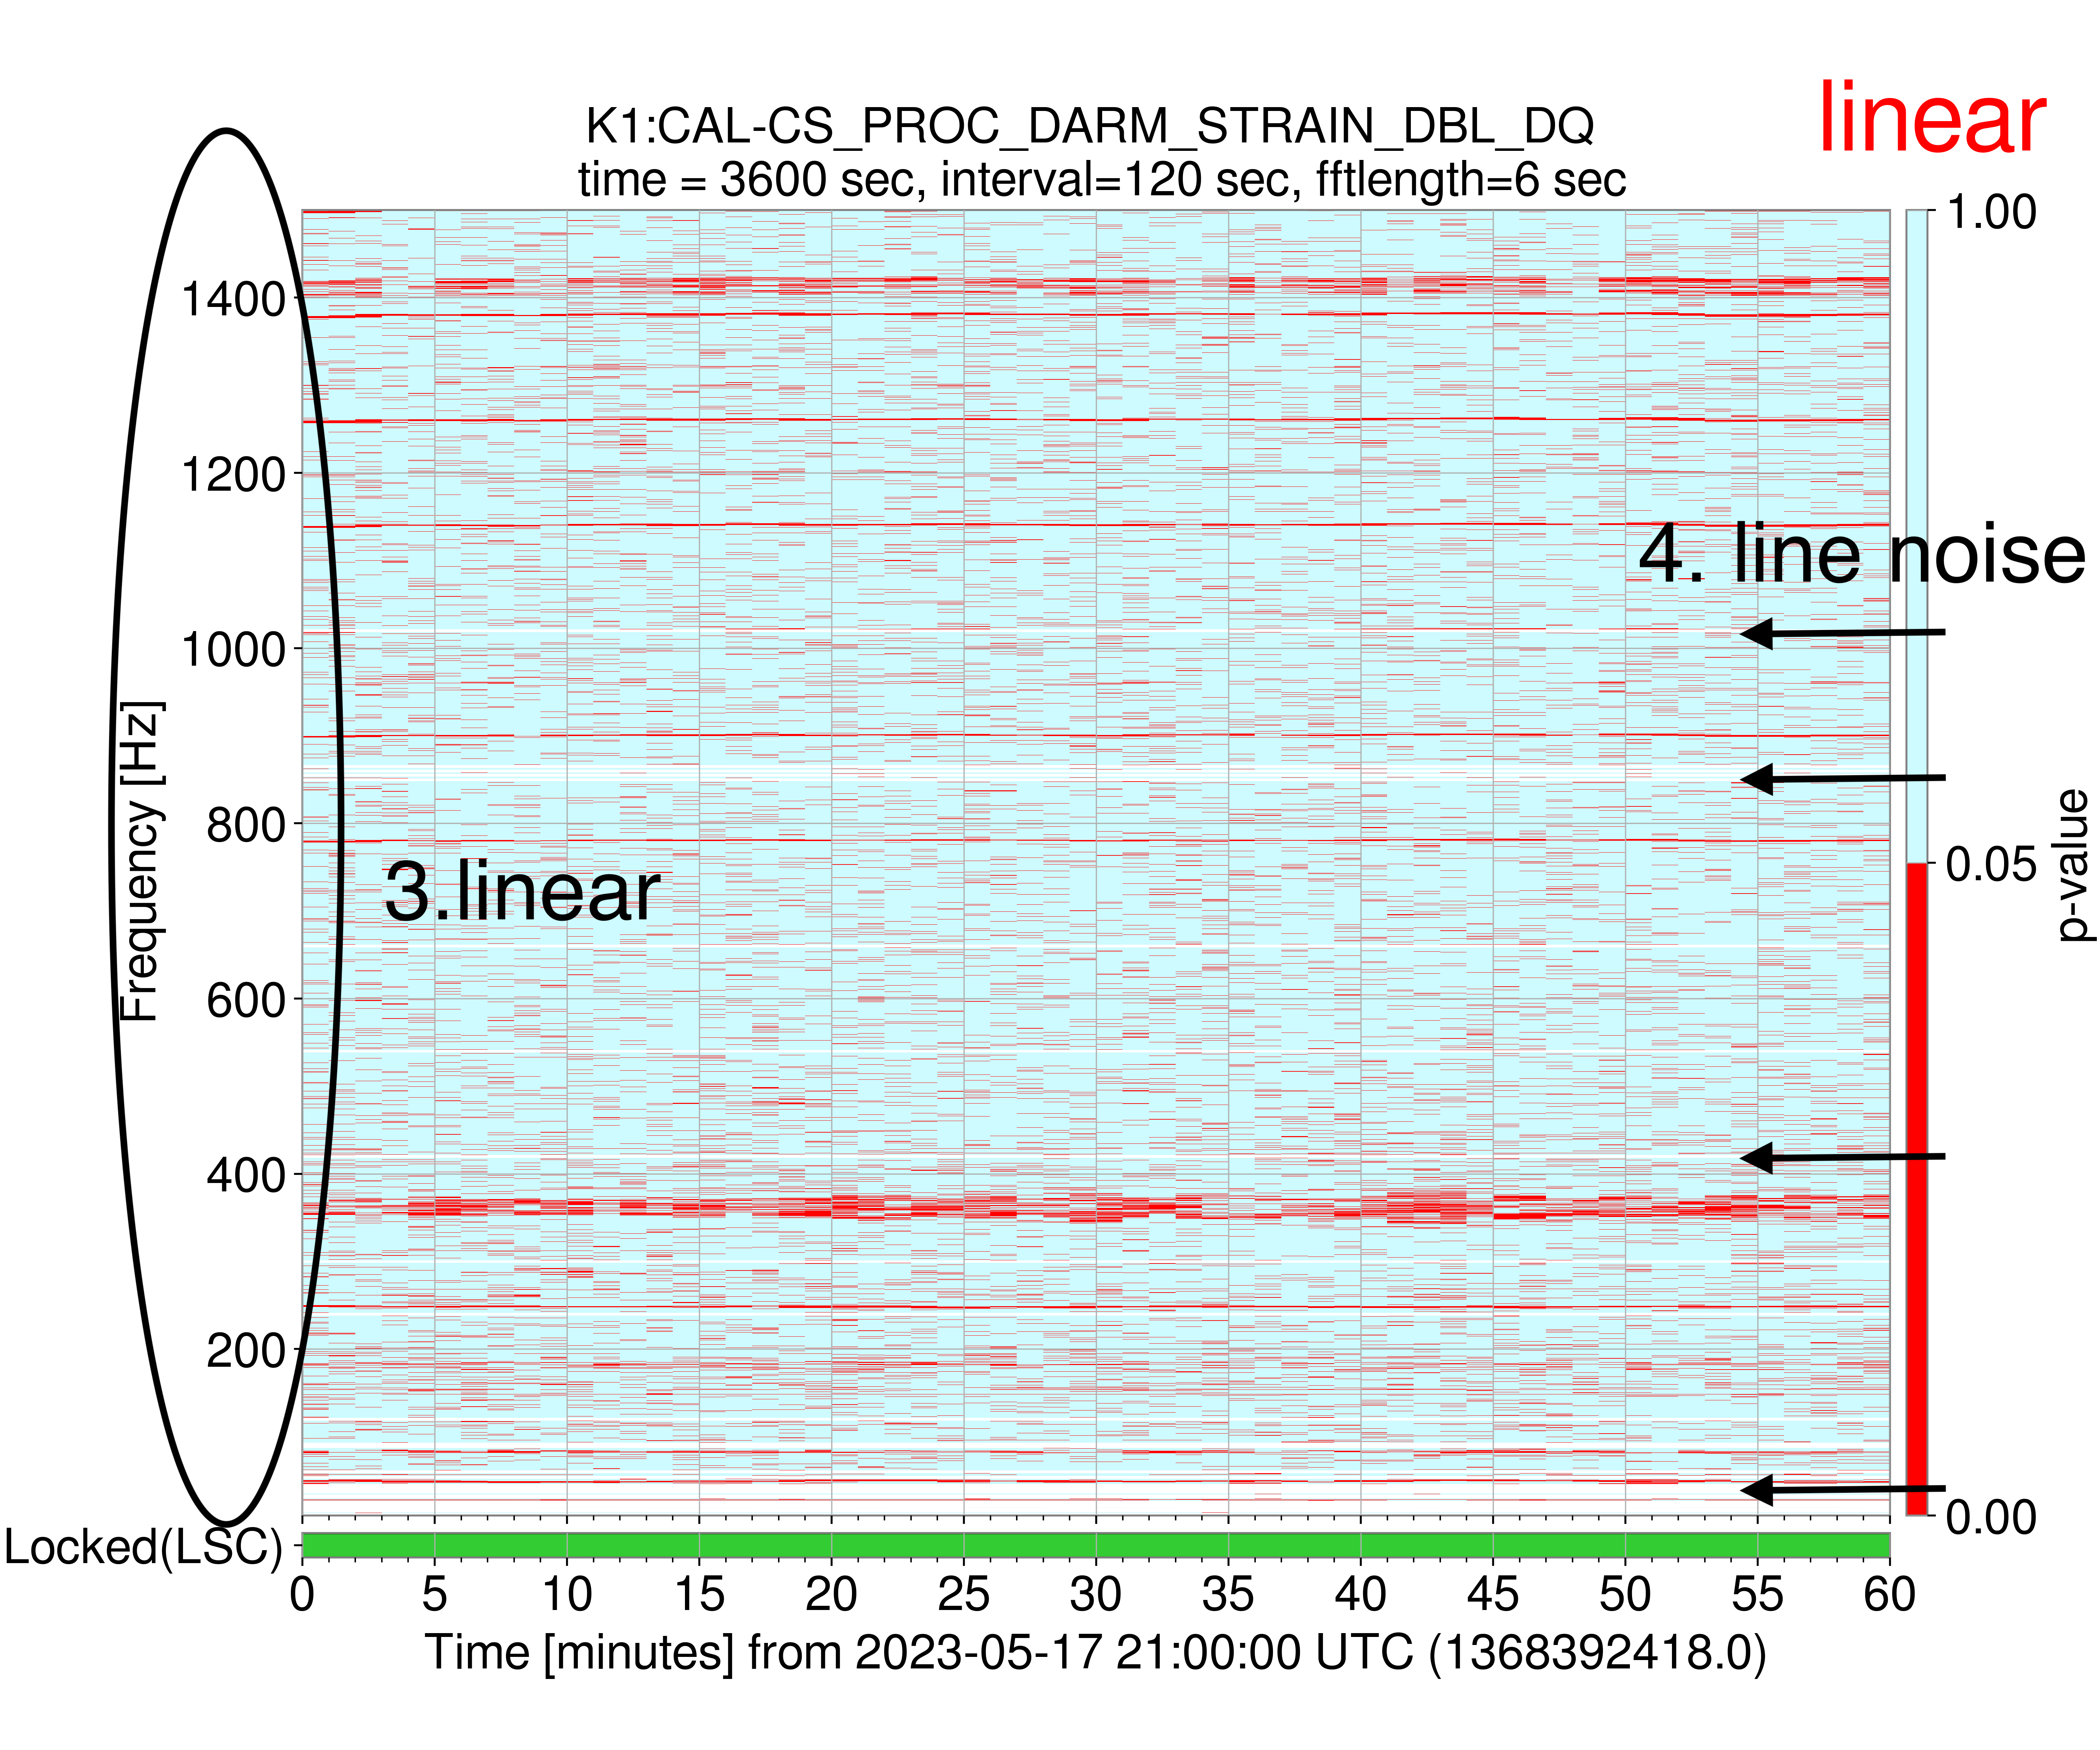
- Change the color bar of p-value from a continuous one to a discrete one. (Fig.1)
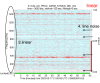
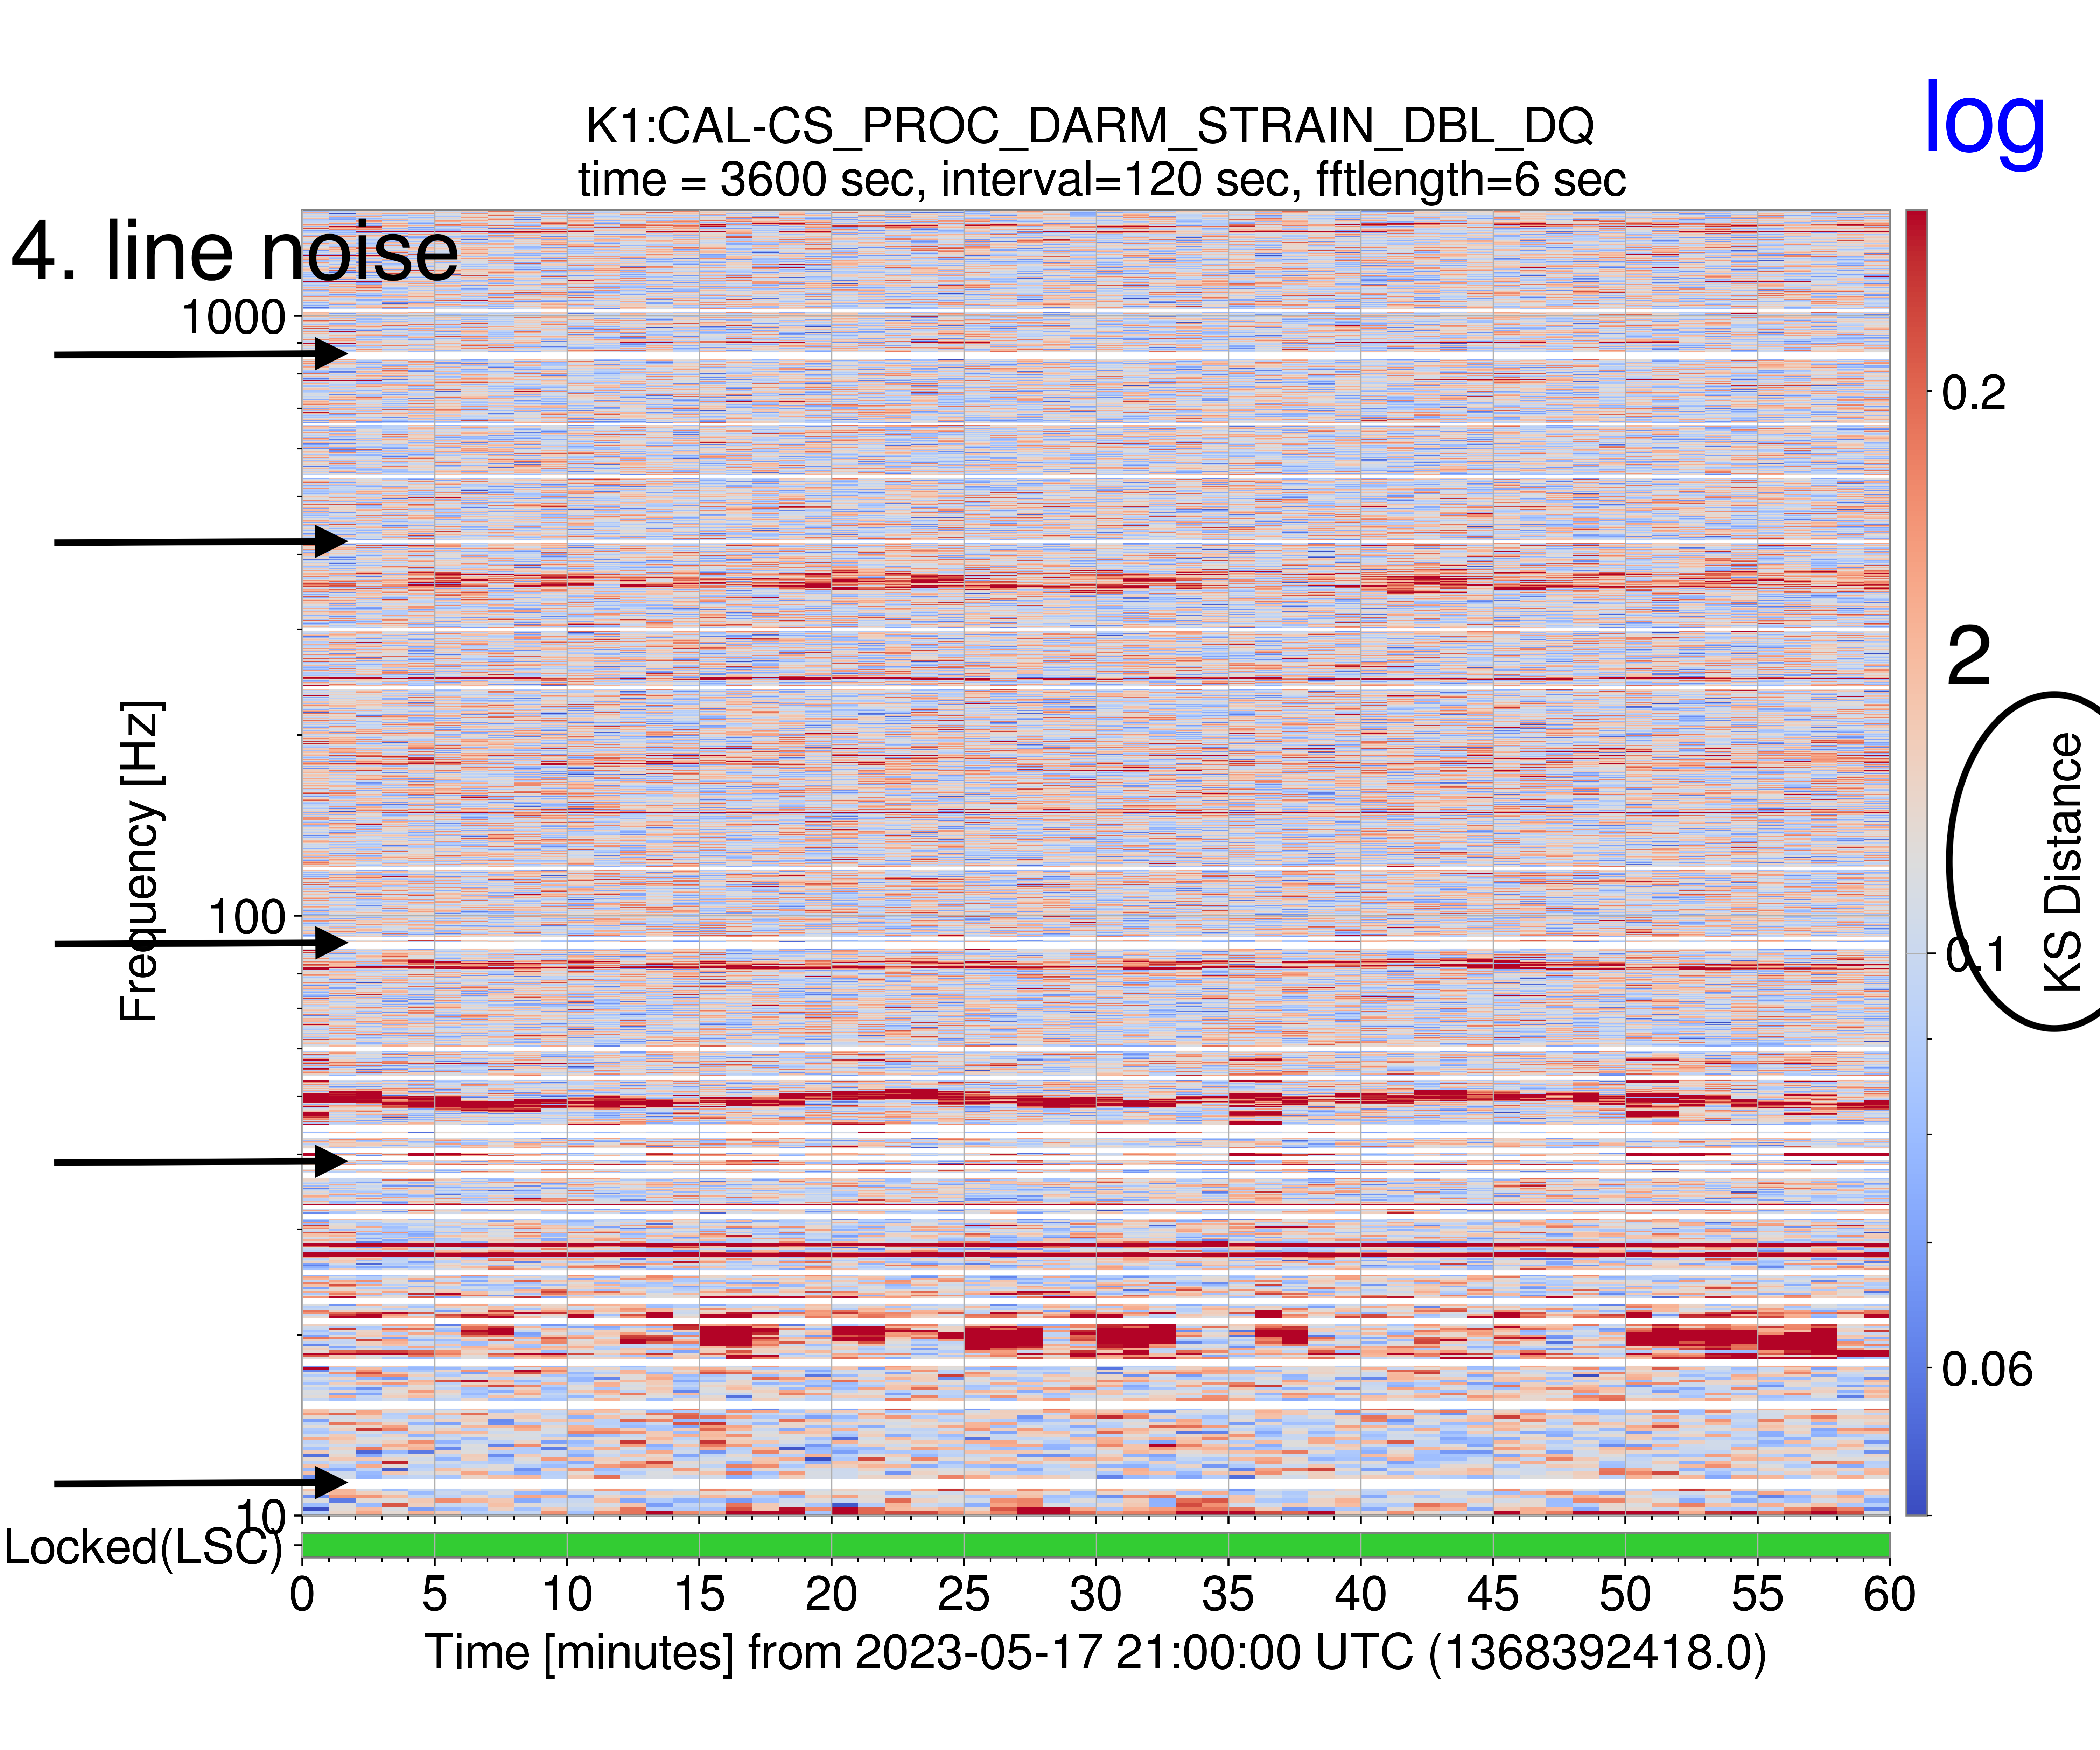
- Make plots of "KS distance." (Fig.2)
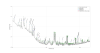
- Make plots with linear scale in frequencies. (Fig.3)
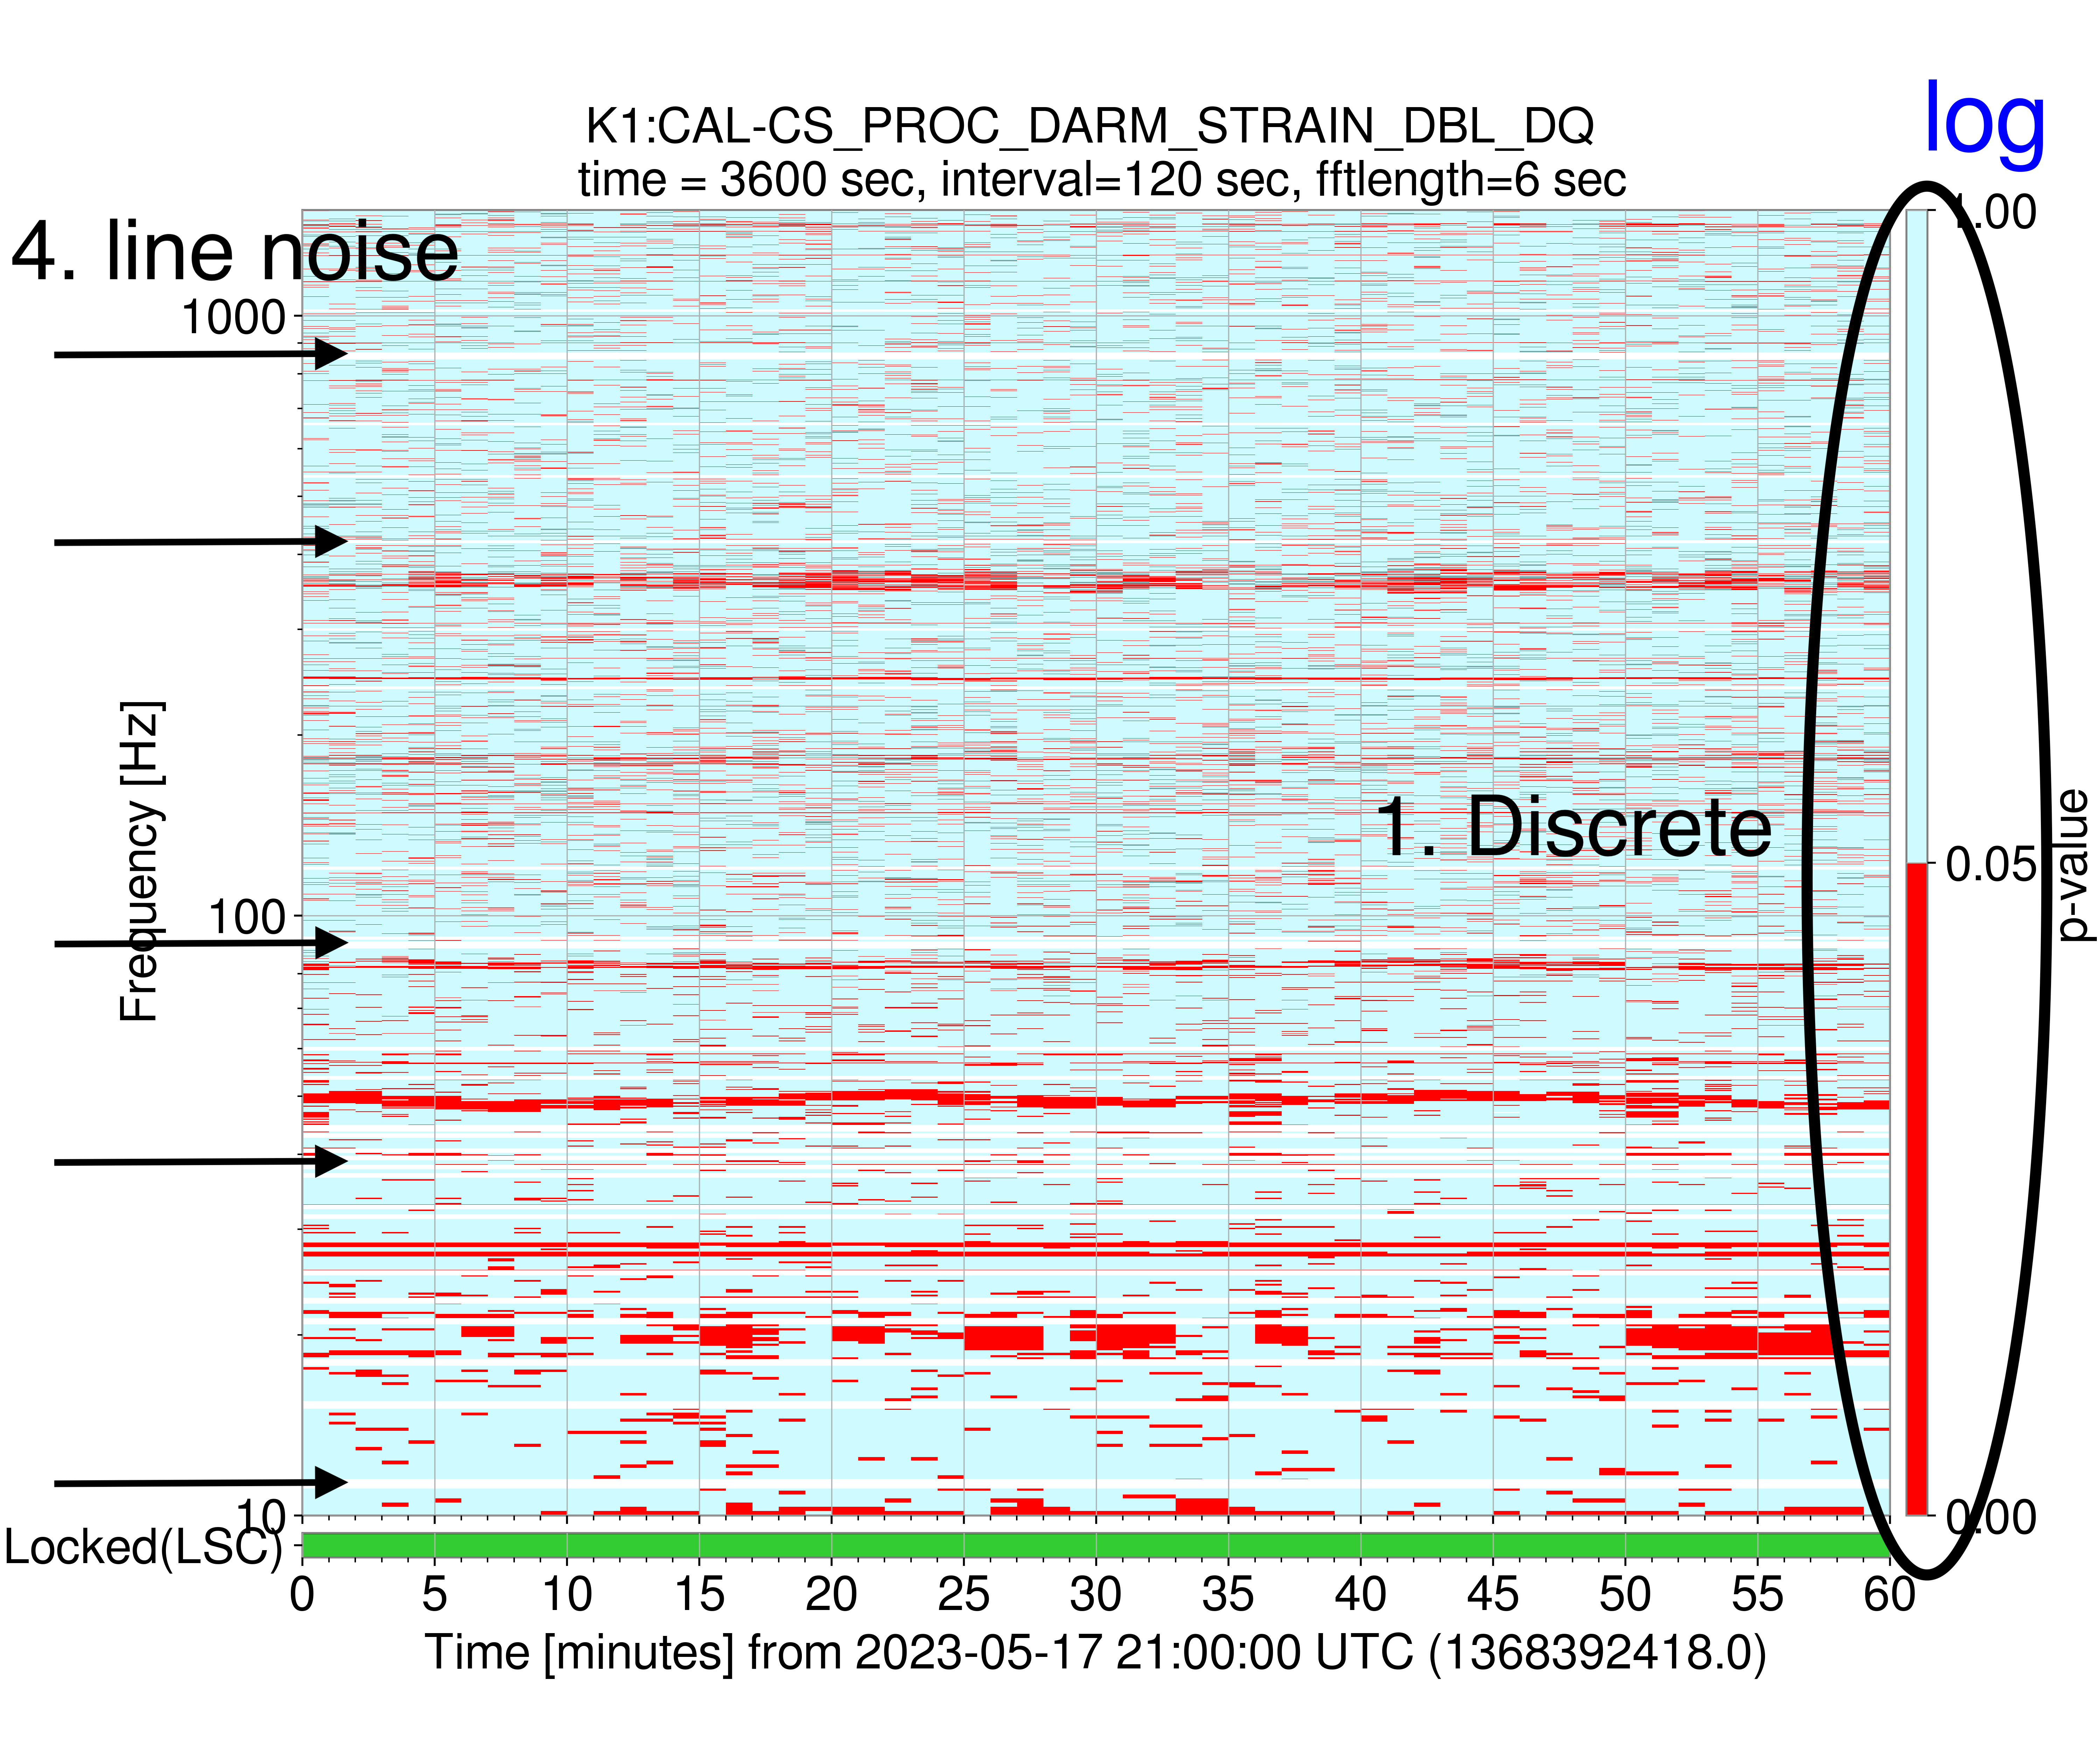
- Remove known line noise (paint them white). (Fig.1~3)
Detail explanation:
- In terms of statistics, p-value is used only to determine whether rejects the null hypothesis or not. Then, I set 0.05 as the significant value and change the color in the plot apparently by the threshold.
- KS distance is a quantity used to calculate p-value. For the above reason, the size of p-value is meaningless. However, KS distance, which means the distance between two distributions (null hypothesis and data) can be considered as a value to evaluate the Gaussianity numerically.
- So far, I made log scale ones only. Log scale ones should be used to see the behavior in lower frequencies, and linear ones should be in higher frequencies.
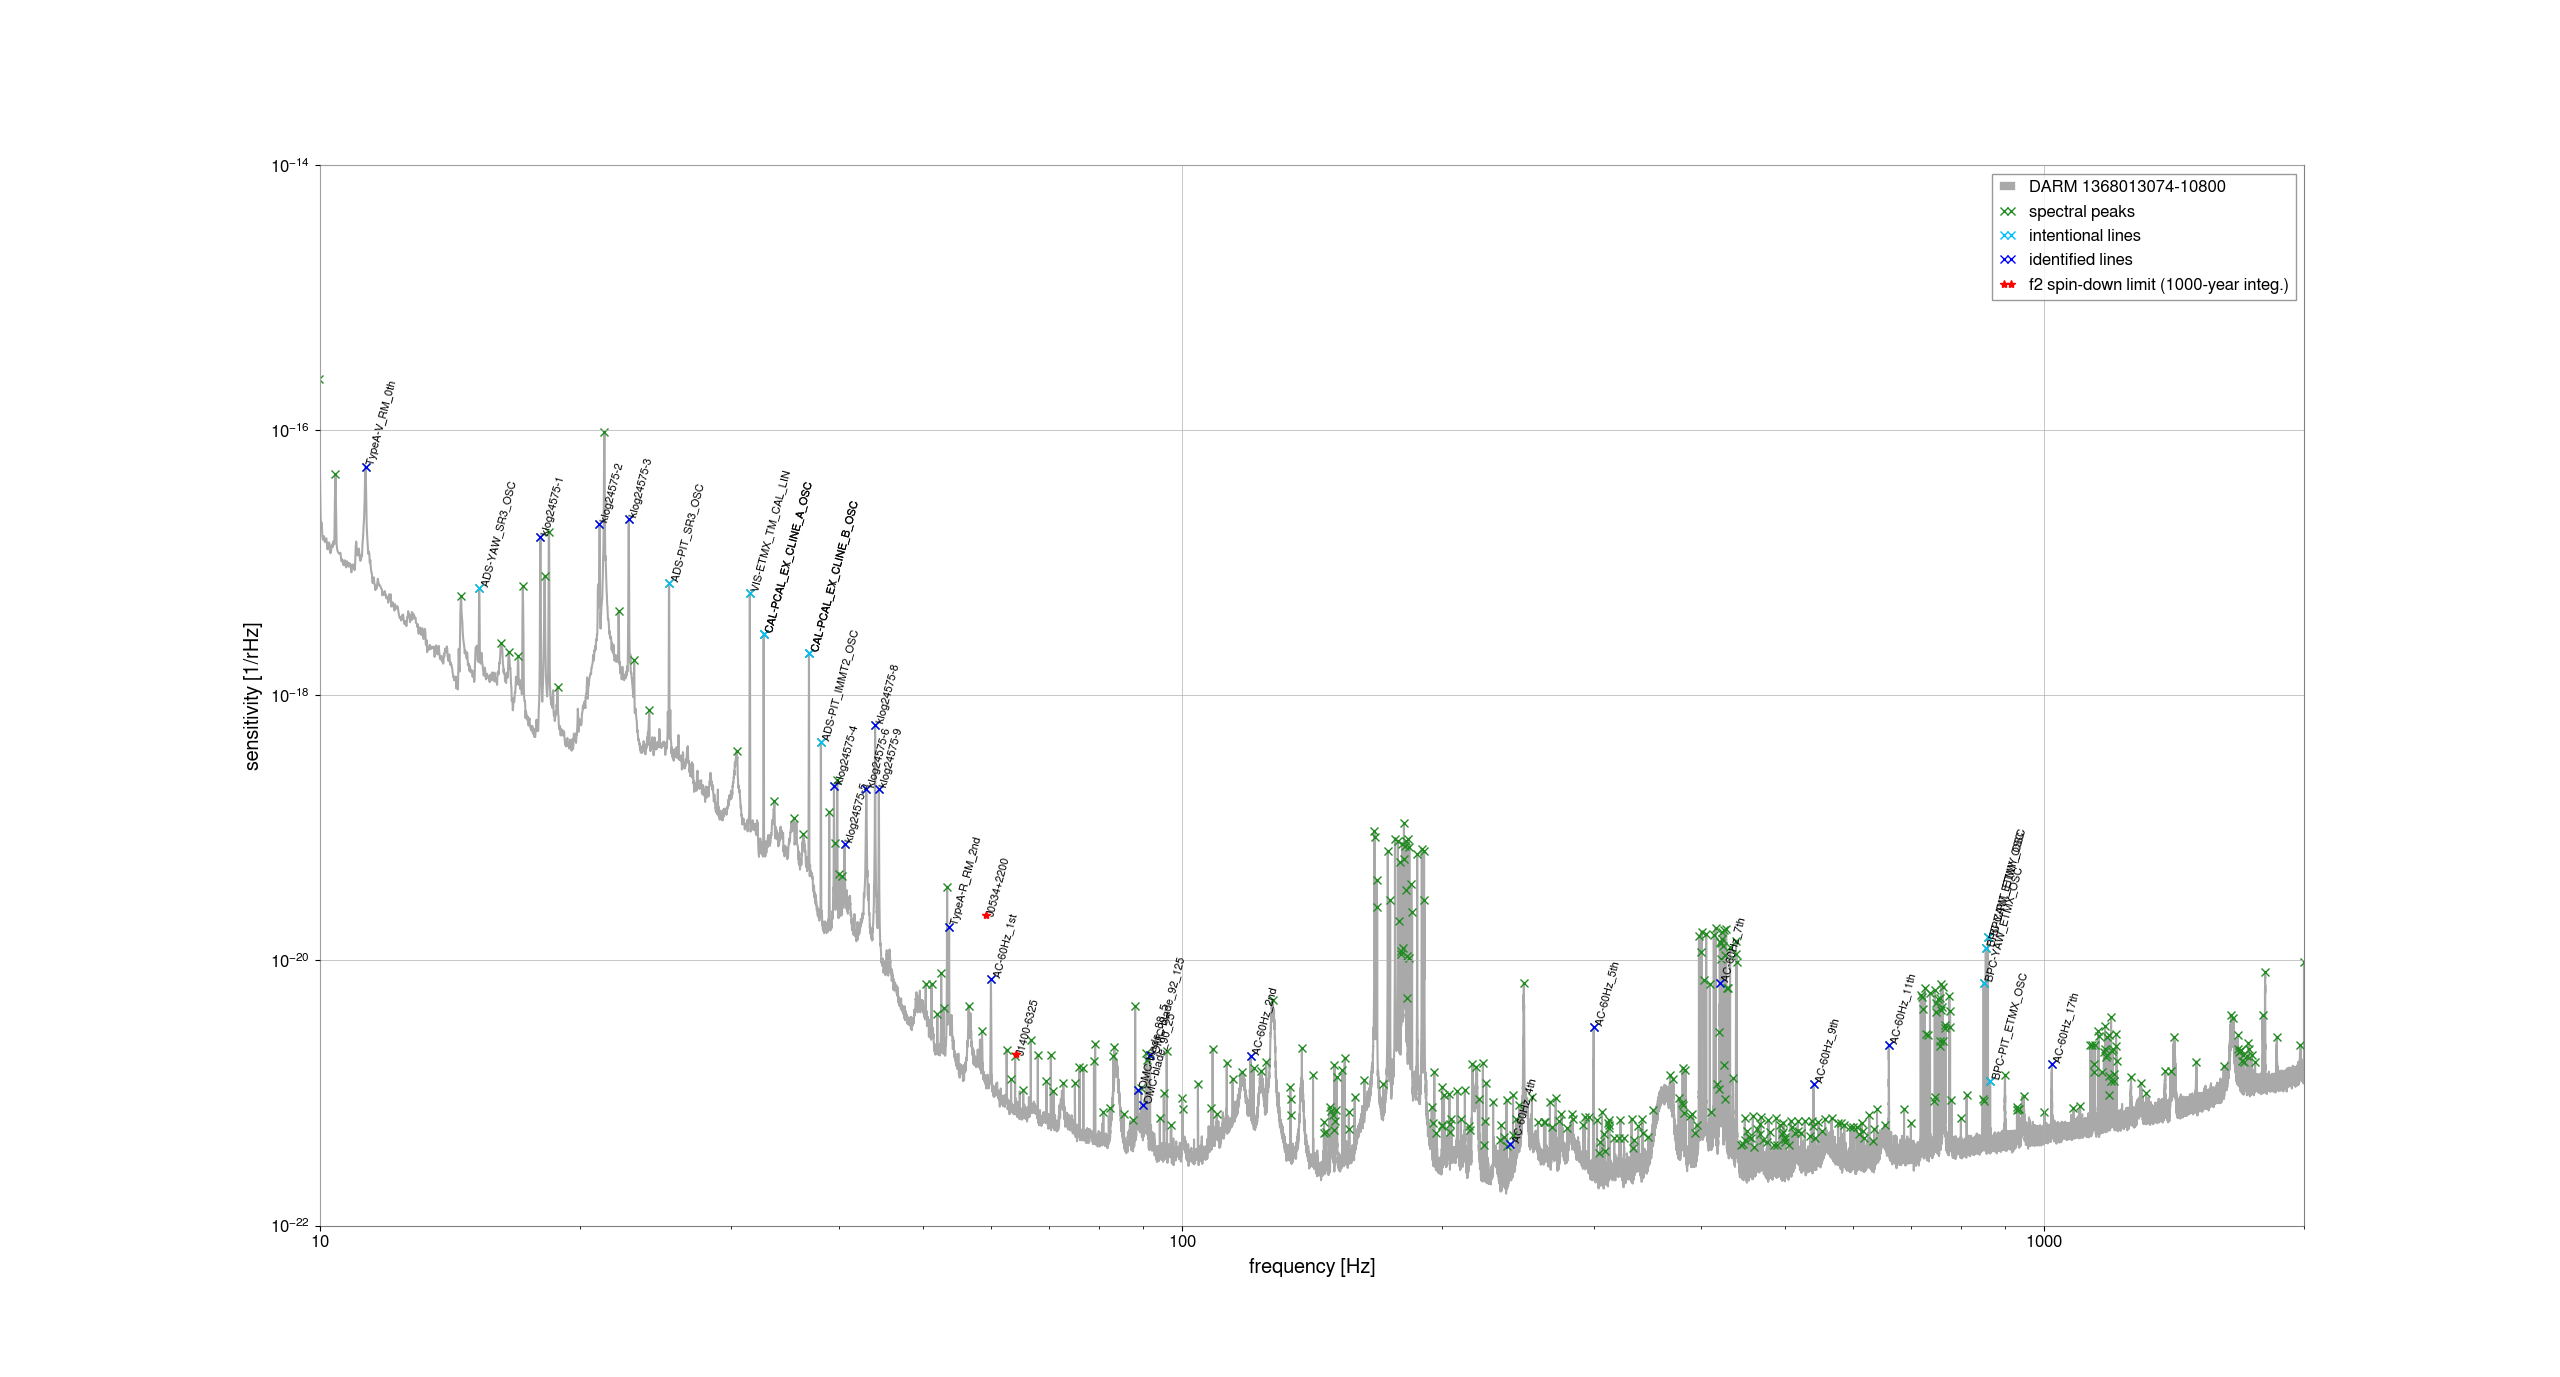
- The line noise should be removed because it is already known to be non-Gaussian noise. I added an option to fill the area white when a list of center frequencies and widths of line noise is given. It is difficult to get the list, so now I used YamaT-san's result (Fig.4) for center frequencies and constant value, 0.3 Hz, for widths.
