With Takahashi-san.
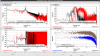
Summary: in order to assess the health of the supension, we measured transfer functions (with the automeasurement system) and compared them with old measurements from July 2019. The tower and IM are healthy.
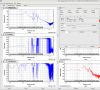
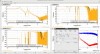
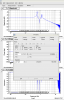
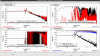
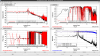
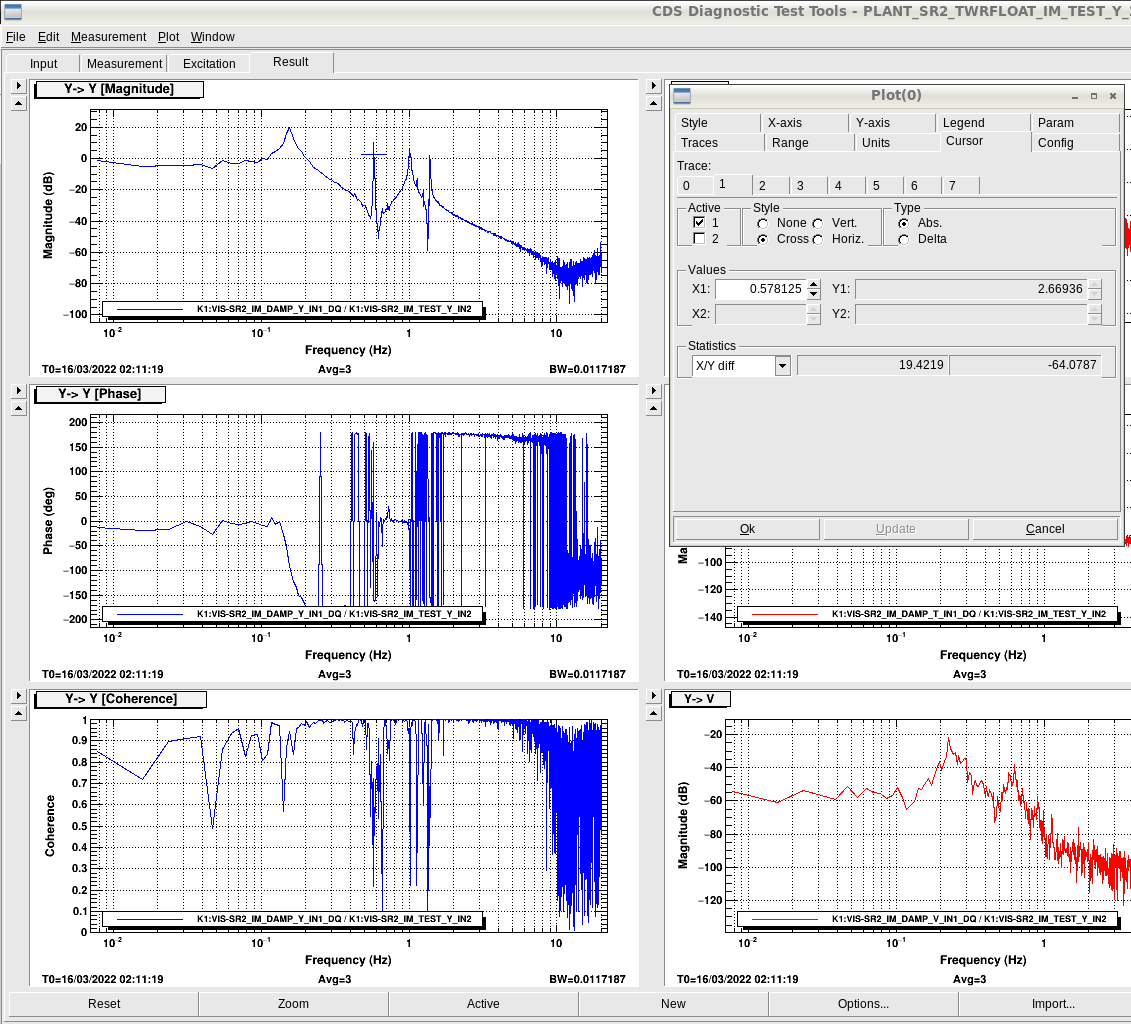
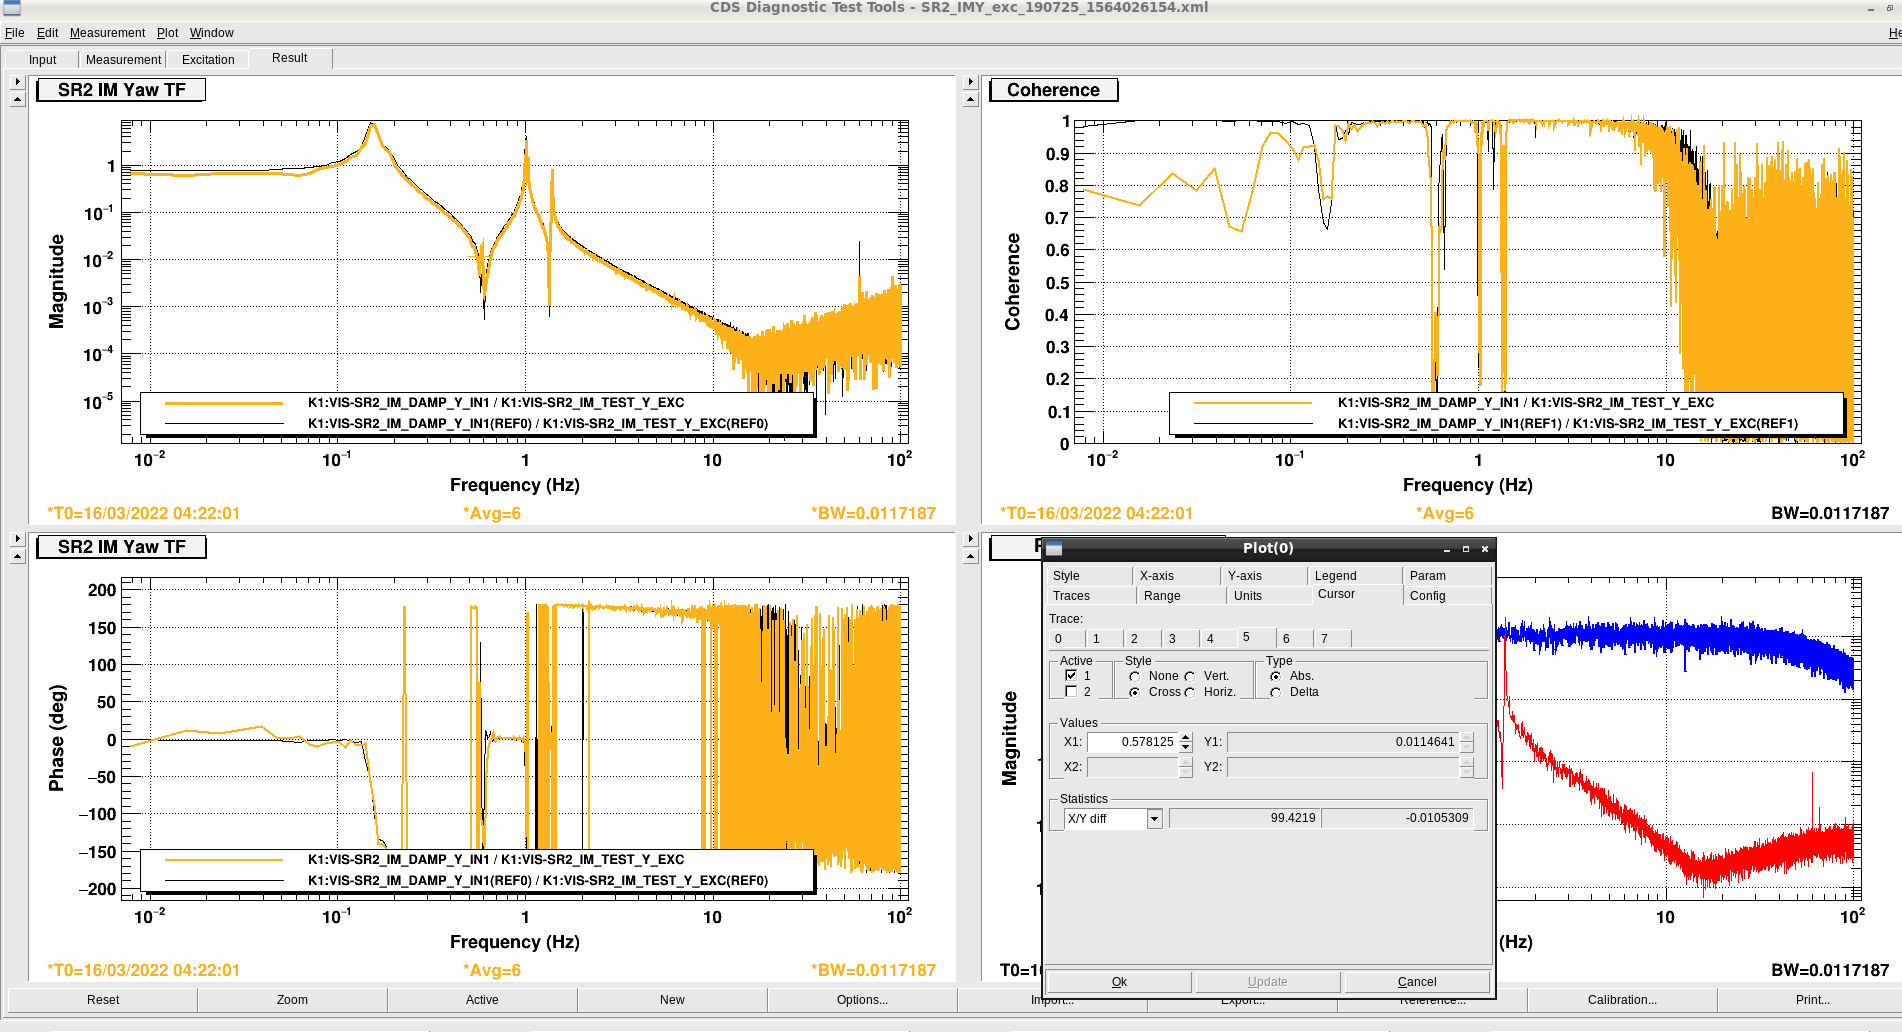
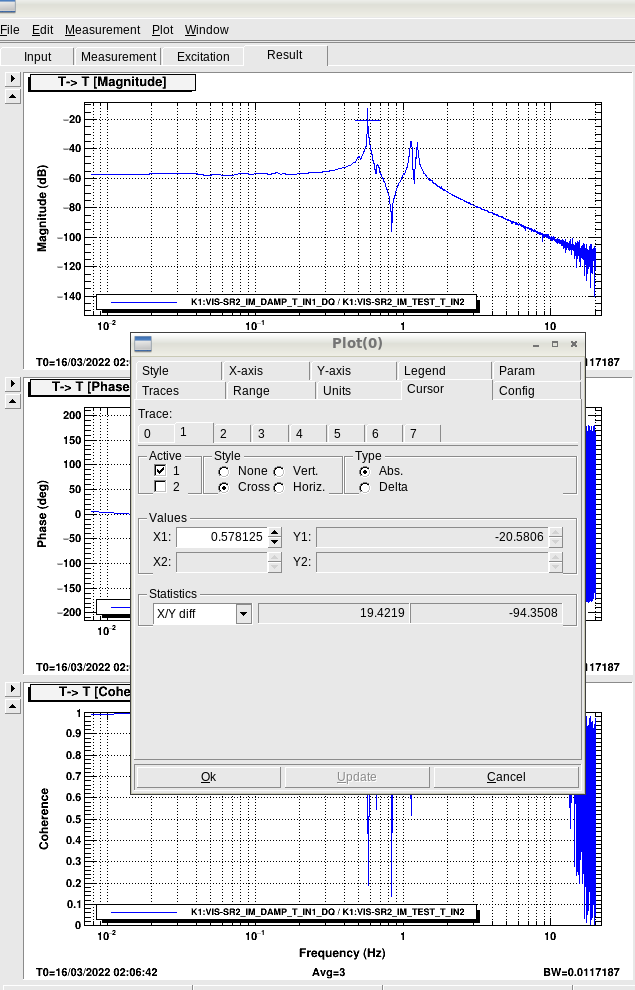
The differences between the new and the old measurements were negligible in the tower and IM. The behaviour of that section of the suspension seems stable at least from July 2019 until now. I suggest to use today's measurements as references (except IM-Y). The DoF IM-Y was measured again because an additional peak appeared at 578 mHz (Fig. 1). In a later measurement the peak disapeared (Fig. 2). Likely, this peak was just residual motion from the previous measurement in IM-T, which has a resonance at the same frequency (Fig. 3).
Some details are the following:
- State of the suspension: TWR_FLOAT.
- Directory: /kagra/Dropbox/Measurements/VIS/PLANT/SR2/2022/03/
- Identification number of the sets of measurements:
- Tower: 202203160955
- IM: 202203161101
- The measurements files we compared with are in the directory: /kagra/Dropbox/Subsystems/VIS/TypeBData/SR2/TF/Measurements/20190725/
- Additional measurements are in /kagra/Dropbox/Subsystems/VIS/TypeBData/SR2/TF/Measurements/20220316/
The DC amplitudes of the various degrees of freedom are, in units of dB:
- IP-L LVDT: -13.0
- IP-T LVDT: -12.9
- IP-Y LVDT: -36.3
- F0 GAS: -36.9
- F1 GAS: -22.7
- BF GAS: -27.0
- IM-L: -57.0
- IM-T: -56.9
- IM-V: -46.1
- IM-R: -6.4
- IM-P: -4.3
- IM-Y: -3.4
An additional entry will be written for the mirror transfer functions.