Reports 1-1 of 1 Clear search Modify search
DetChar (General)
hirotaka.yuzurihara - 17:55 Wednesday 09 March 2022 (20026) Print this report
Investigation of sudden power reduction of IMMT oplev by using PRM

[Murakoshi (Aoyama Gakuin univ.)]

Murakoshi-san investigated the cause of sudden power reduction of IMMT oplev, by the request from Ushiba-san. She checked the values of PRM channels (K1:VIS-PRM_TM_WIT_P_DQ and K1:VIS-PRM_TM_WIT_Y_DQ), when the sudden power reduction of IMMT oplev happened. These values are read by eye on ndscope.

I attach the excel file. Tomorrow this task will continue.

Non-image files attached to this report
Comments to this report:
hirotaka.yuzurihara - 1:40 Friday 11 March 2022 (20050) Print this report

[Murakoshi (Aoyama Gakuin univ.), Yuzurihara]

We workied on making the scatter plot of the data of PRM channels (K1:VIS-PRM_TM_WIT_P_DQ and K1:VIS-PRM_TM_WIT_Y_DQ), when the glitch happened on the IMMT oplev.

I attach the scatter plot and the collected data. The blue points shows the values of PRM channels at the time the glitch happened. The purple box shows the typical behavior of IMMT1 channels. But, one of these channels (K1:VIS-PRM_TM_WIT_TM_P_DQ) was changing with the trend. So, instead of this box, simply we should read the data of other normal time and add the data on the scatter plot. This will be the next step.

Images attached to this comment
Non-image files attached to this comment
hirotaka.yuzurihara - 14:49 Sunday 13 March 2022 (20065) Print this report

[Murakoshi (Aoyama Gakuin univ.), Yokozawa, Ushiba, Yuzurihara]

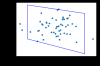
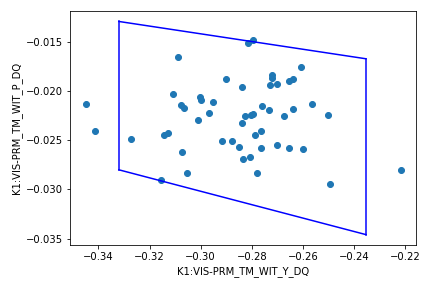
Murakoshi-san  created a scatter plot of YAW and PIT values of PRM channels at the time of glitch on IMMT1 oplev signa. 32 seconds of data were collected approximately every hour and superimposed on the scatter plot to investigate correlation.

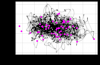
The scatter plot is attached. The magenta points indicate the PRM values at the glitch. The black points shows the PRM values of normal data, which is intended to show the background data.

From comparing two kinds of data, we don't find the characteristic behavior. The results indicate that PRM channels are unlikely to be the cause of glitch on IMMT1 oplev, at this time.


As a next step, we will create the scatter plot of every 1 hour with overlapping the background distribution. The reason to make 1 hour scatter plot is that there is a time-trend in the PRM channels over 12 hour.

The collected csv data are also attached.

Images attached to this comment
Non-image files attached to this comment
hirotaka.yuzurihara - 0:00 Monday 28 March 2022 (20253) Print this report

[Murakoshi (Aoyama Gakuin univ.), Yokozawa, Ushiba, Yuzurihara]

Murakoshi-san created a plot of background data around the time of glitch and giltch values. (see first pdf)
Most of the glitch values do not seem to show any particular behavior.
Sometimes, when the values of the two QPD channels (YAW/PIT) fold back, the glitch appears to be occurring. (for example, see second pdf)


Now that we have developed the code to create such scatter plots, we can apply them to other times and see the results.

Non-image files attached to this comment
Search Help
×

Warning

×