I measured transfer functions for all DoFs. While some transfer functions look fine, some are not.
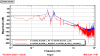
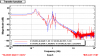
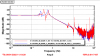
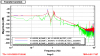
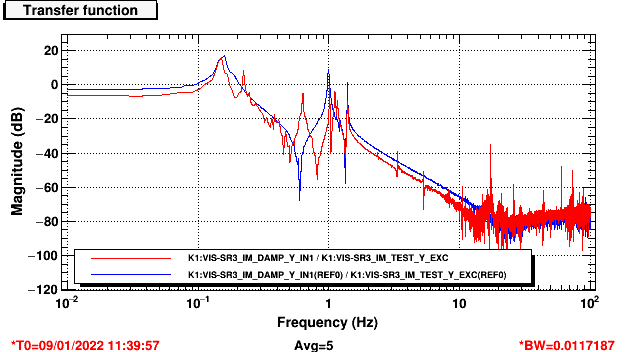
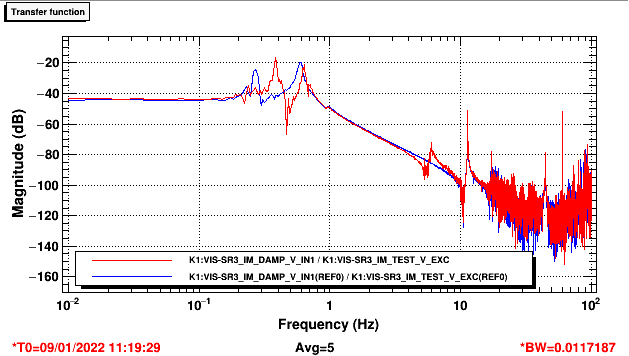
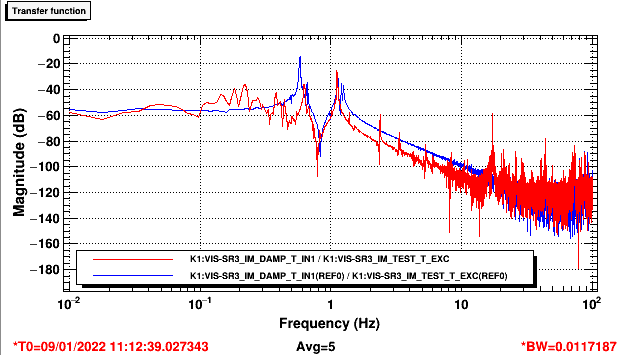
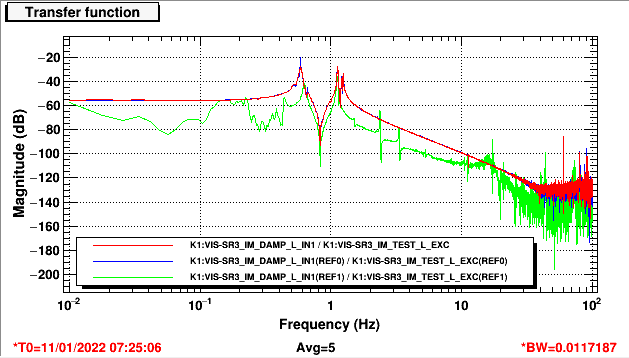
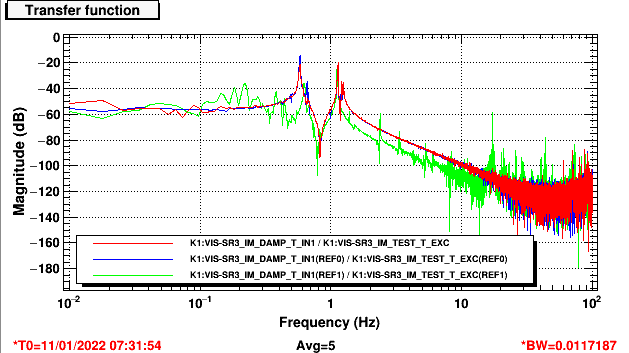
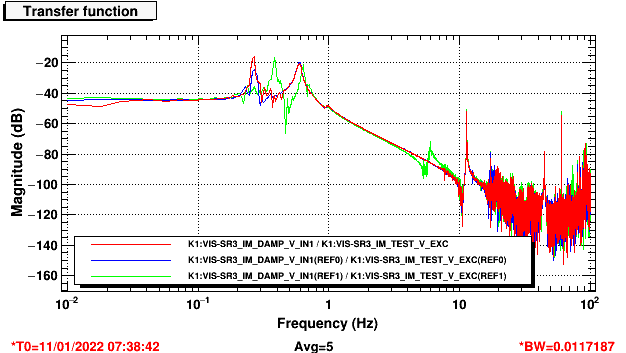
Fig. 1-4 show transfer functions in the IM stage, in particular for the longitudinal, yaw, vertical, and transverse DoFs.
The blue reference curves are the transfer functions measured in August. They are considered to be the healthy ones.
The red ones are measured today. They look different from the references. There're missing peaks and unexpected peaks. The amplitude responses look smaller overall as well.
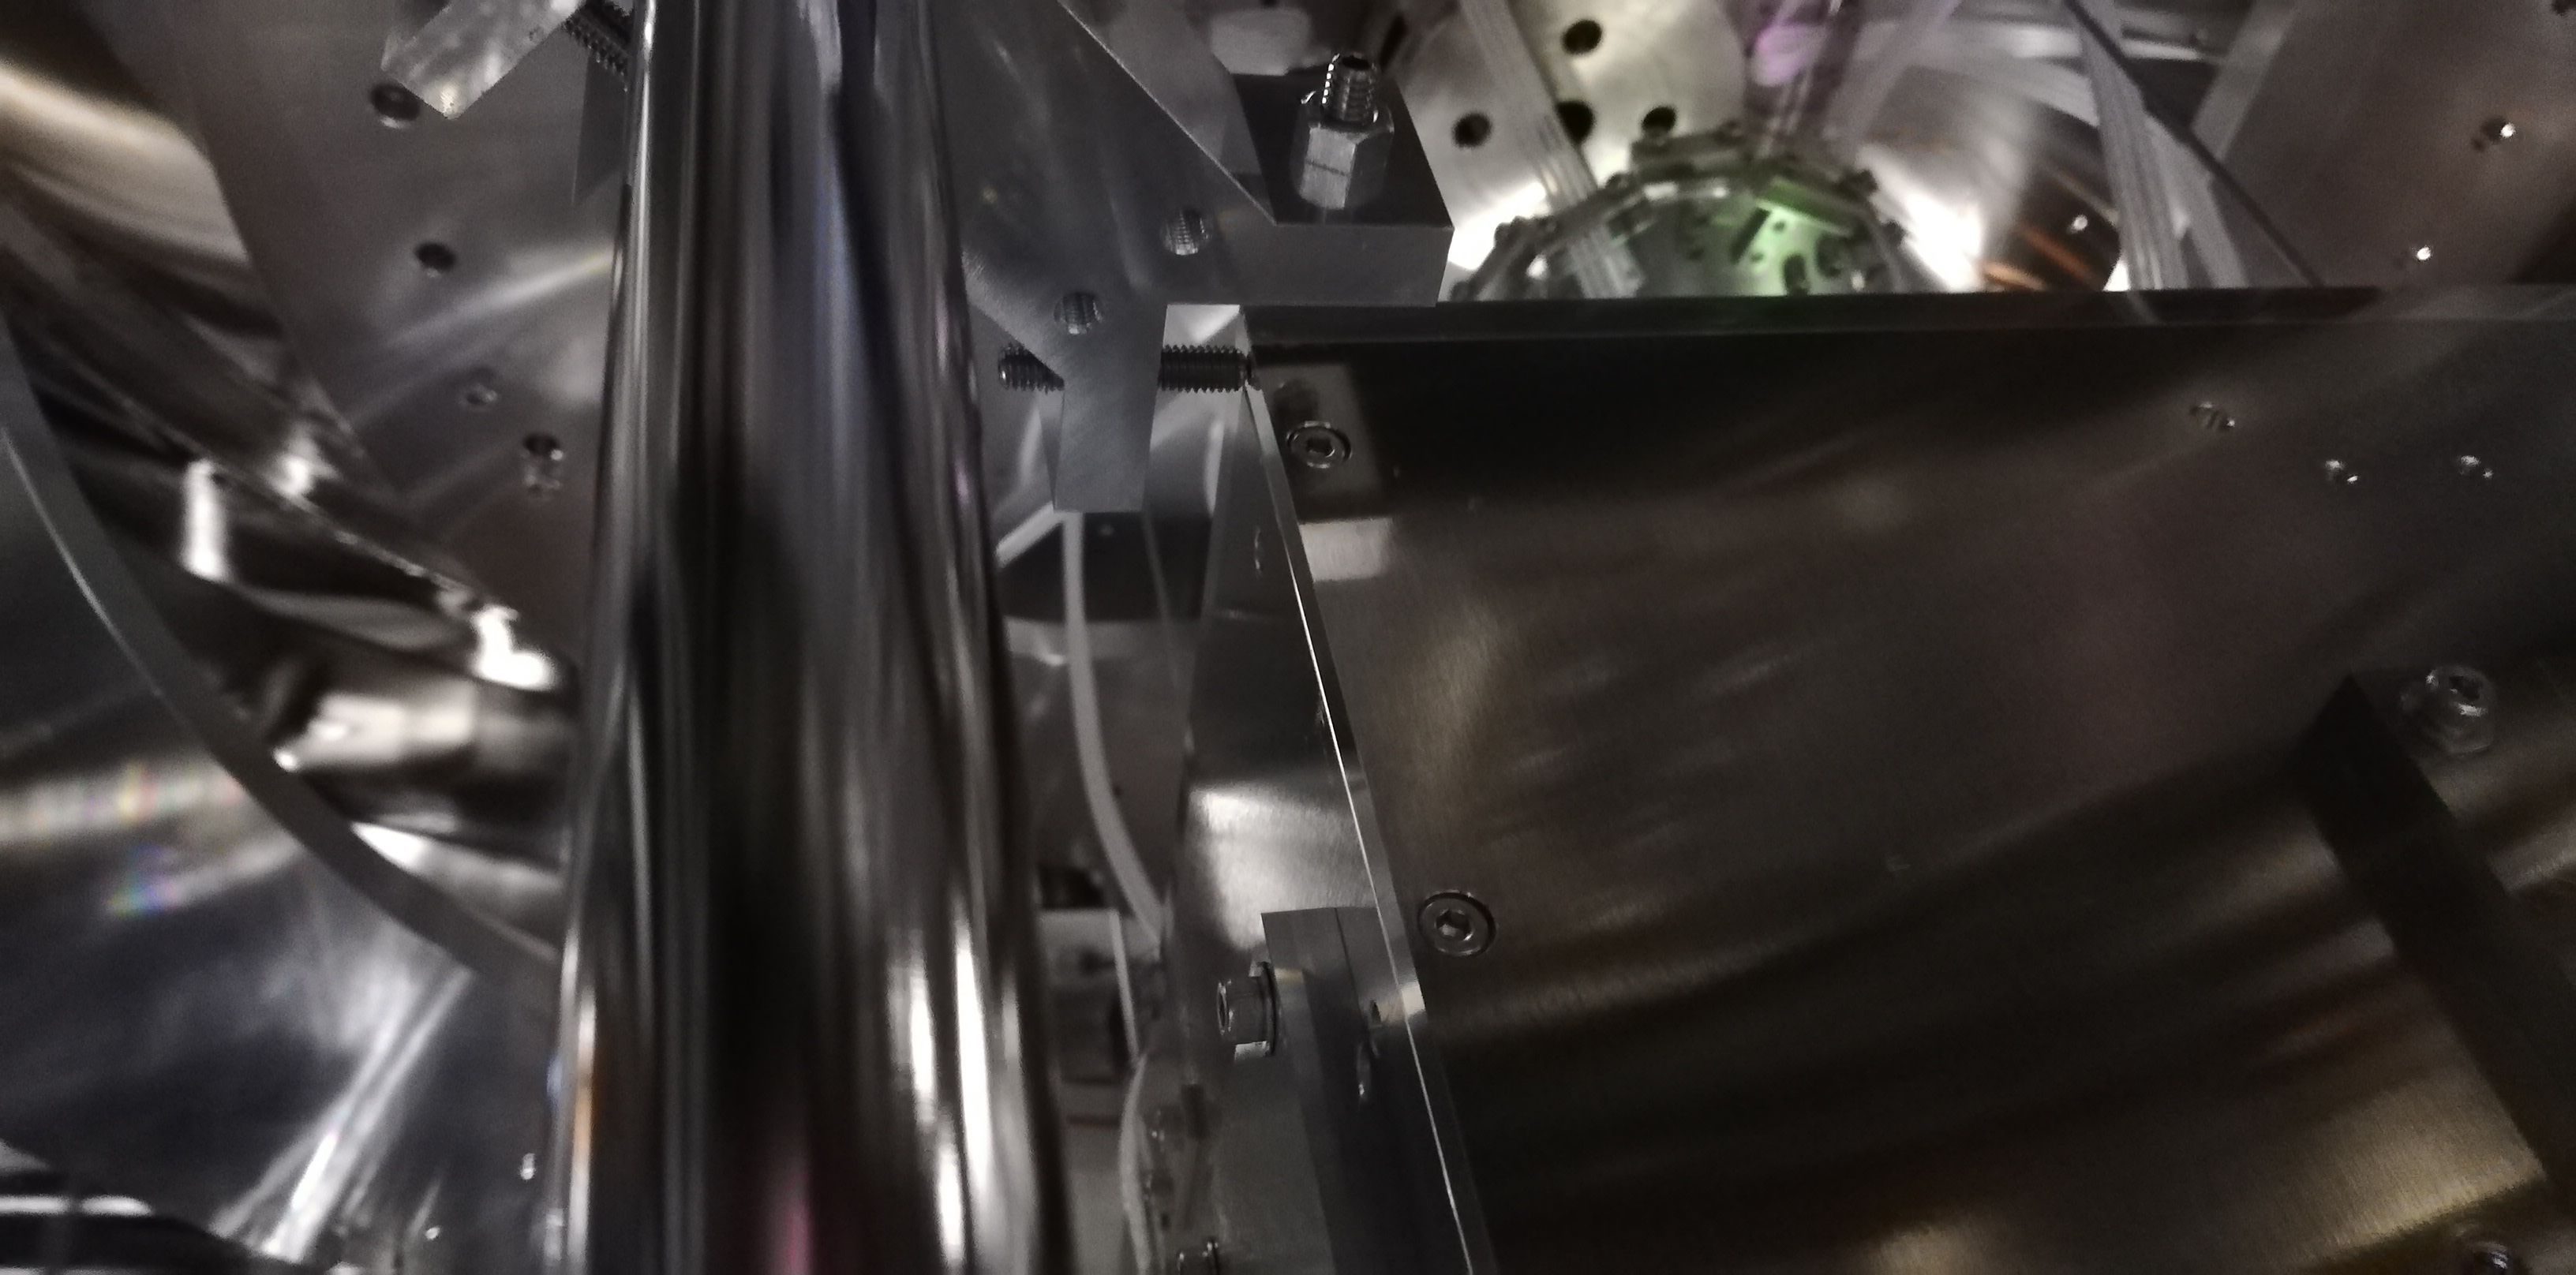
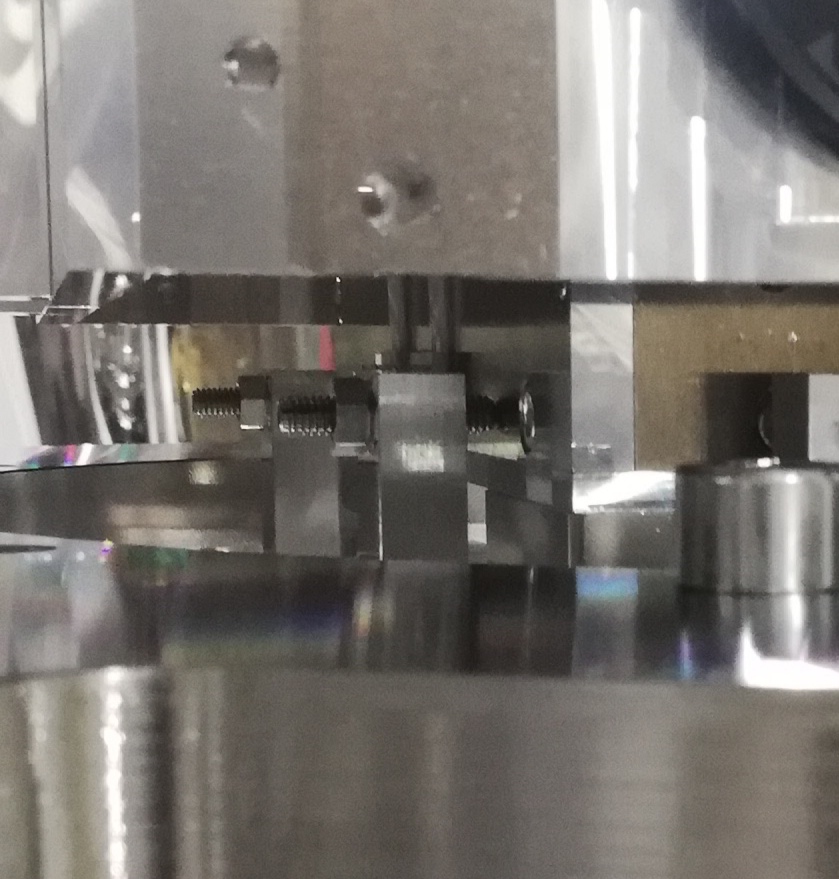
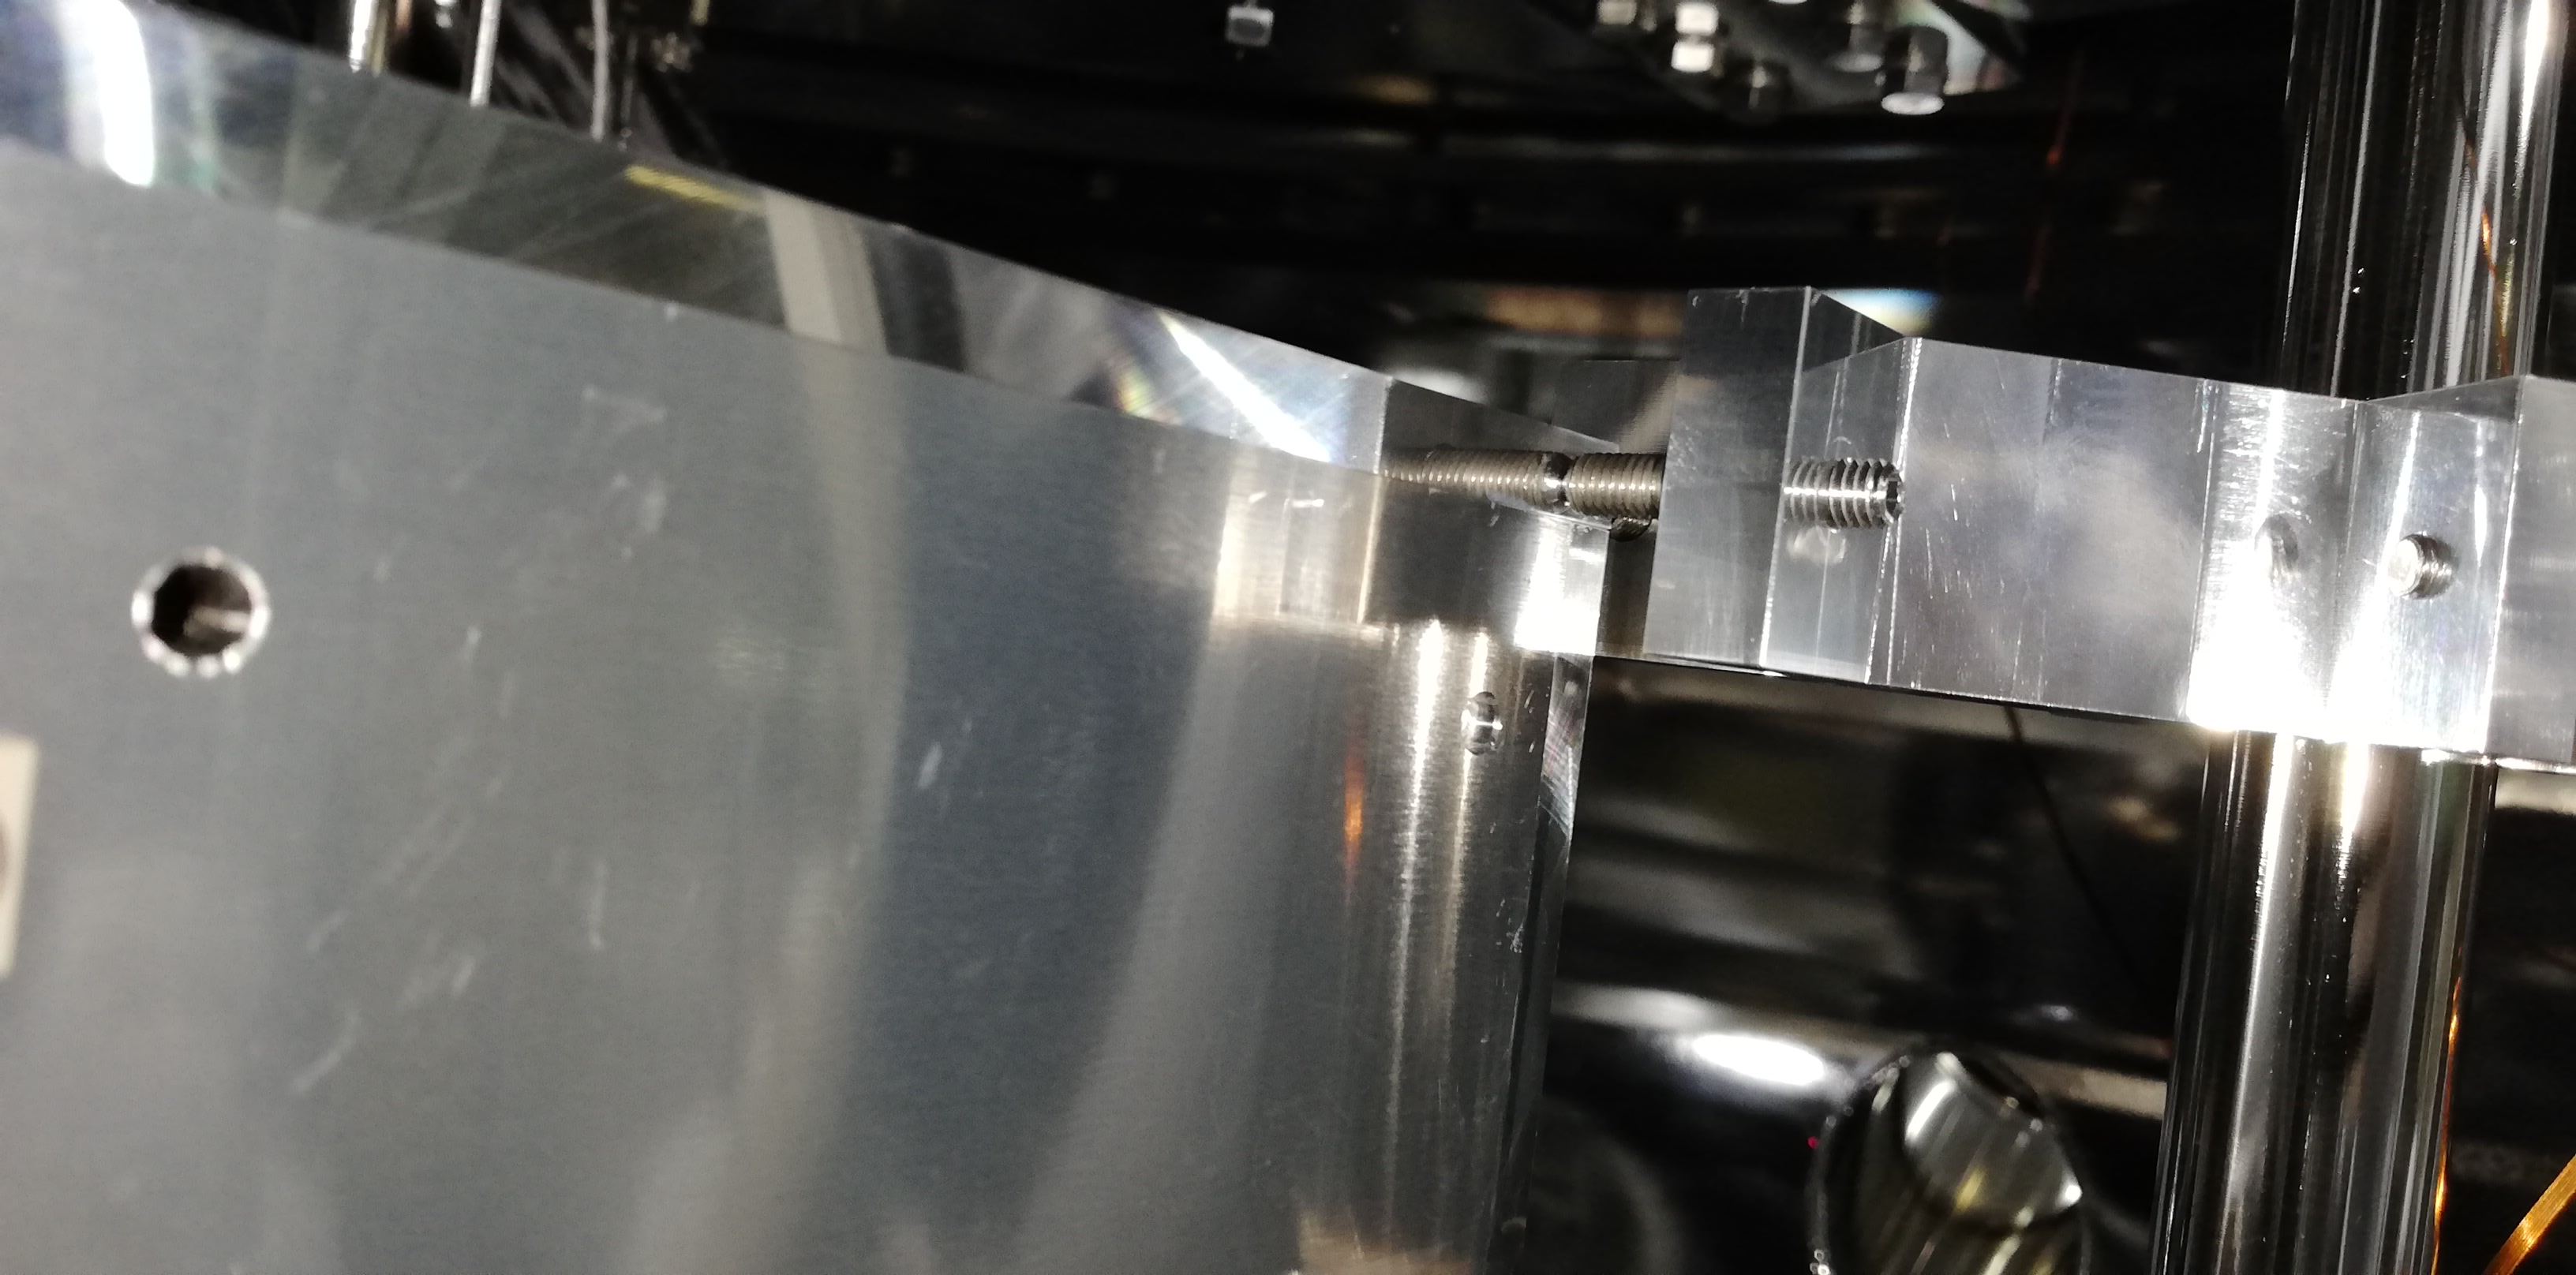
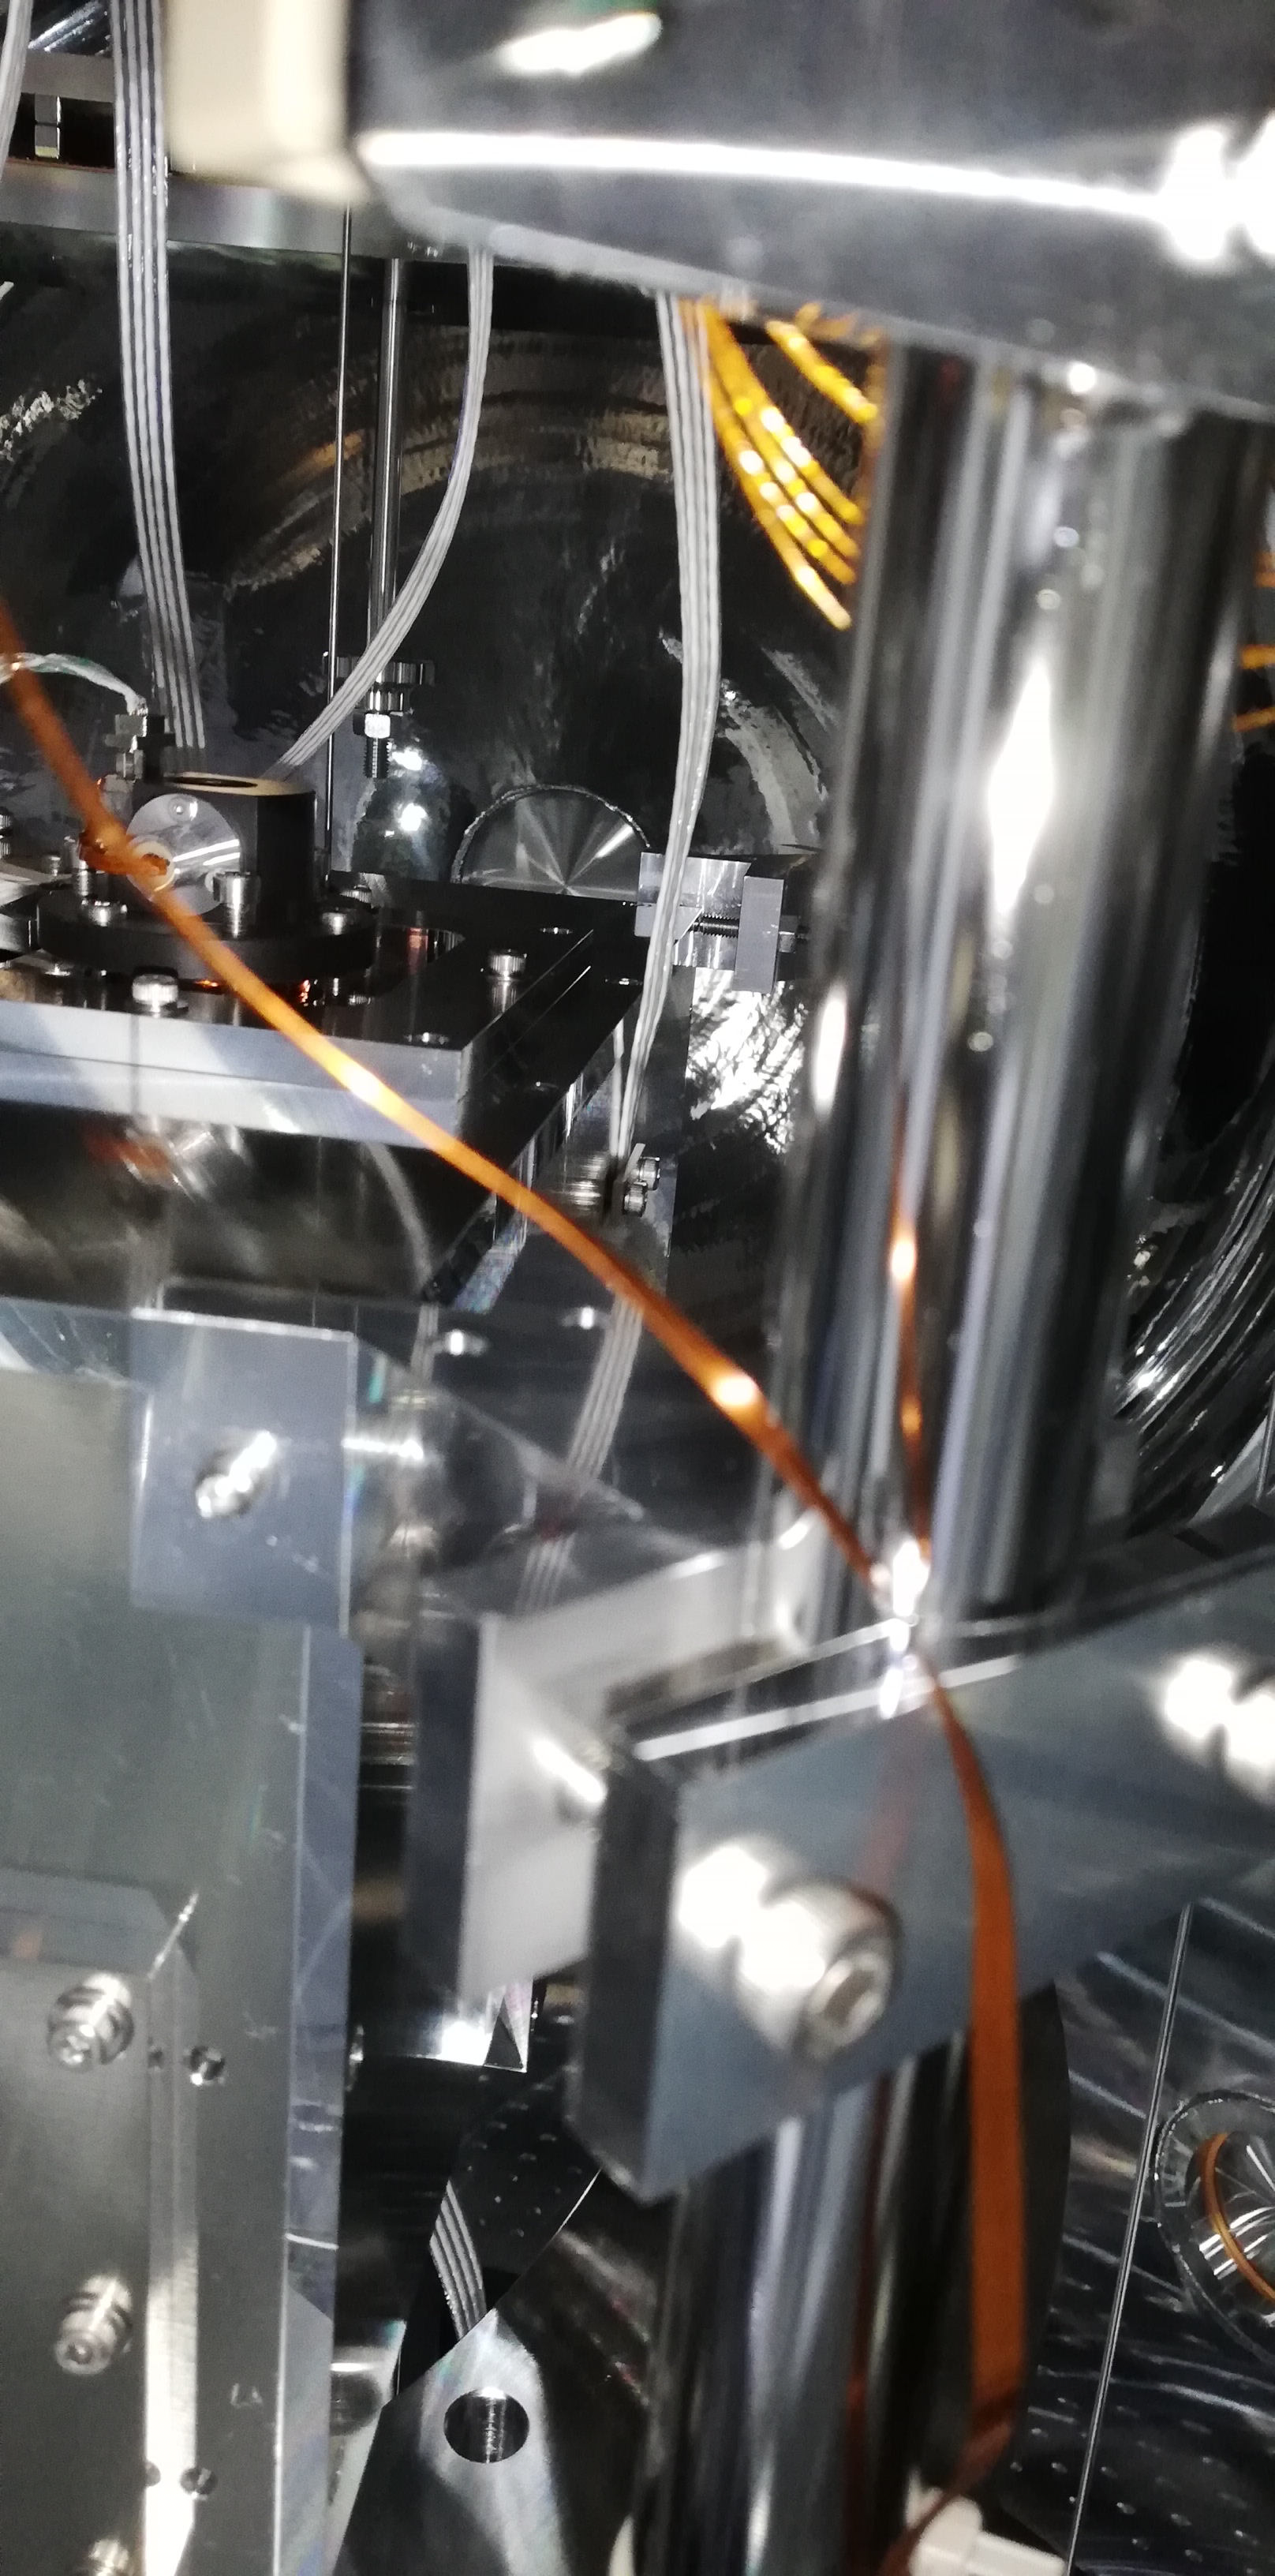
At this point, I am convinced that there's something wrong with SR3 at the hardware level and I will stop working on it. It requires closer inspection.
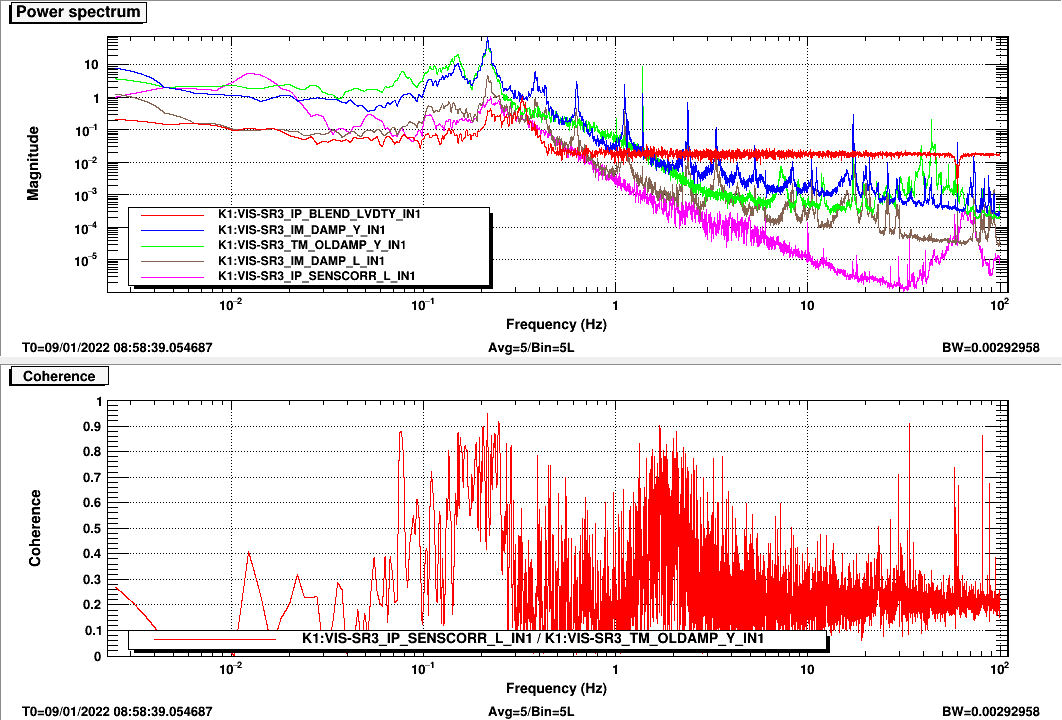
I also measure the free swing spectrum for all DoFs. This spectrum was measured with the stages put close to the setpoint using DC offsets.
In Fig. 5, the yaw spectrum in the IP, IM, and TM is shown. There's a peak at 0.215 Hz in both TM Y, and IM Y, and also a bit in IP Y.
It has very high coherence with the seismic noise in the L direction, as shown in the plot below.
If the IM is indeed rubbing somewhere in the T direction, it could create this L-Y coupling, which would explain why there's a persistent peak at 0.215 Hz, which happens to be the frequency of the microseism.
It doesn't quite explain why the F1 loop cannot be closed. But anyway, we should fix the IM first.


