[Ushiba, Tamaki]
We calculated ITMX TM sensing matrix and checked it's performance.
First, we modified calibration factor for TILT {VER, HOR} as follows.
TILT HOR (YAW): 104.7 [urad/count]
TILT VER (PIT): 119.6 [urad/count]
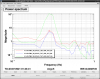
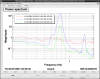
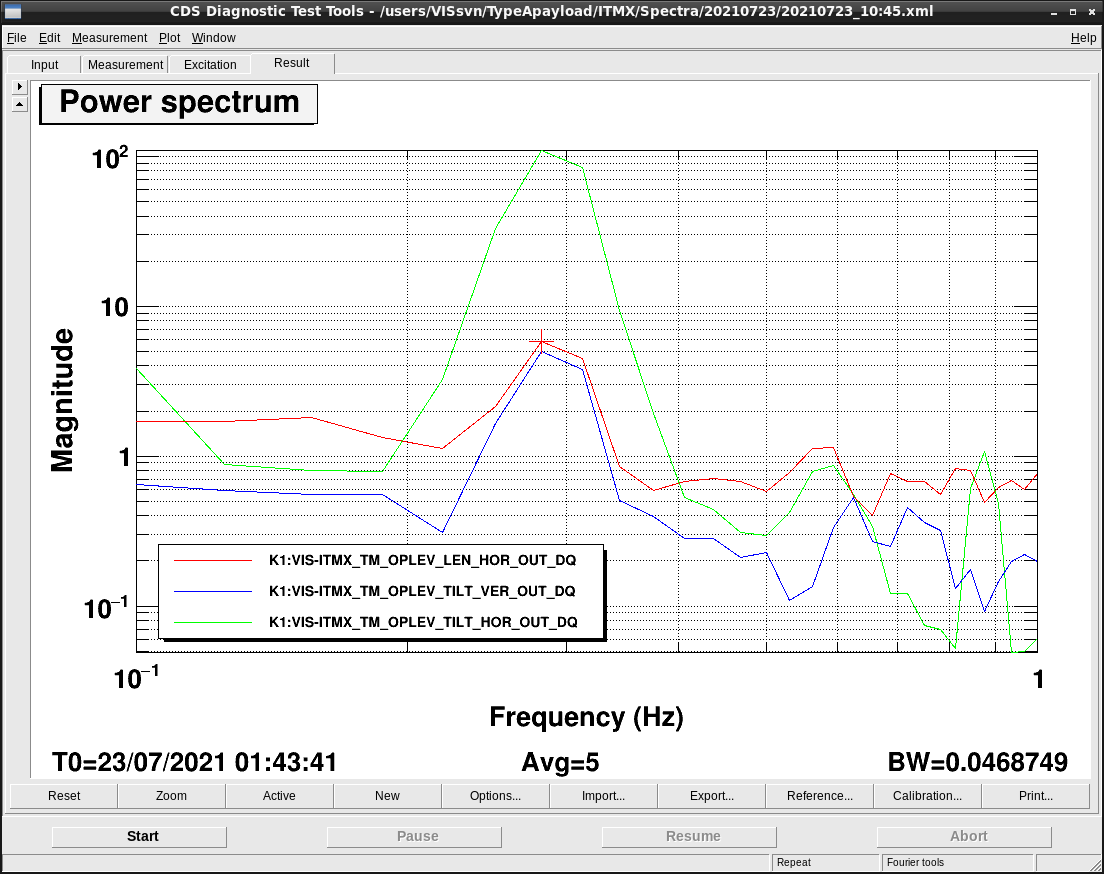
Then, to caluculate sensing matrix, we got power spectrums of TM OpLev's PIT, YAW, and LEN motion (K1:VIS-ITMX_TM_OPLEV_TILT_{VER, HOR}_OUT_DQ and K1:VIS-ITMX_TM_OPLEV_LEN_HOR_OUT_DQ).
We excited L (100 counts), P (40 counts), and Y (10 counts) resonant mode and cut excitation signal and see spectra of TM OpLevs during free decay.
These spetrums are in /users/VISsvn/TypeApayload/ITMX/Spectra/20210723 (Filename: 20210723_10:45.xml, 20210723_11:35.xml and 20210723_14:12.xml), or please see atattched figures (Fig 2-4).
To exite, we used the resonant frequency we got from figures in /kagra/Dropbox/Measurements/VIS/figures/TYPEA.
When we exited LEN, coupling from PIT motion also appeared, so we swung BF.
The matrix we calculated is here.
| LEN HOR | TILT VER | TILT HOR | |
|---|---|---|---|
| LEN | 1 | 0 | 0.053 |
| PIT | 0.136 | 1 | 0.046 |
| YAW | 0.356 | -0.076 | 1 |
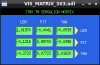
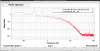
From the inverse of the above matrix, we obtained the decoupling matrix as follows (Fig1):
| LEN | PIT | YAW | |
|---|---|---|---|
| LEN HOR | 1.0197 | -0.0041 | -0.0539 |
| TILT VER | -0.1216 | 0.9970 | -0.0396 |
| TILT HOR | -0.3723 | 0.07723 | 1.0162 |
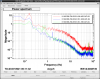
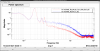
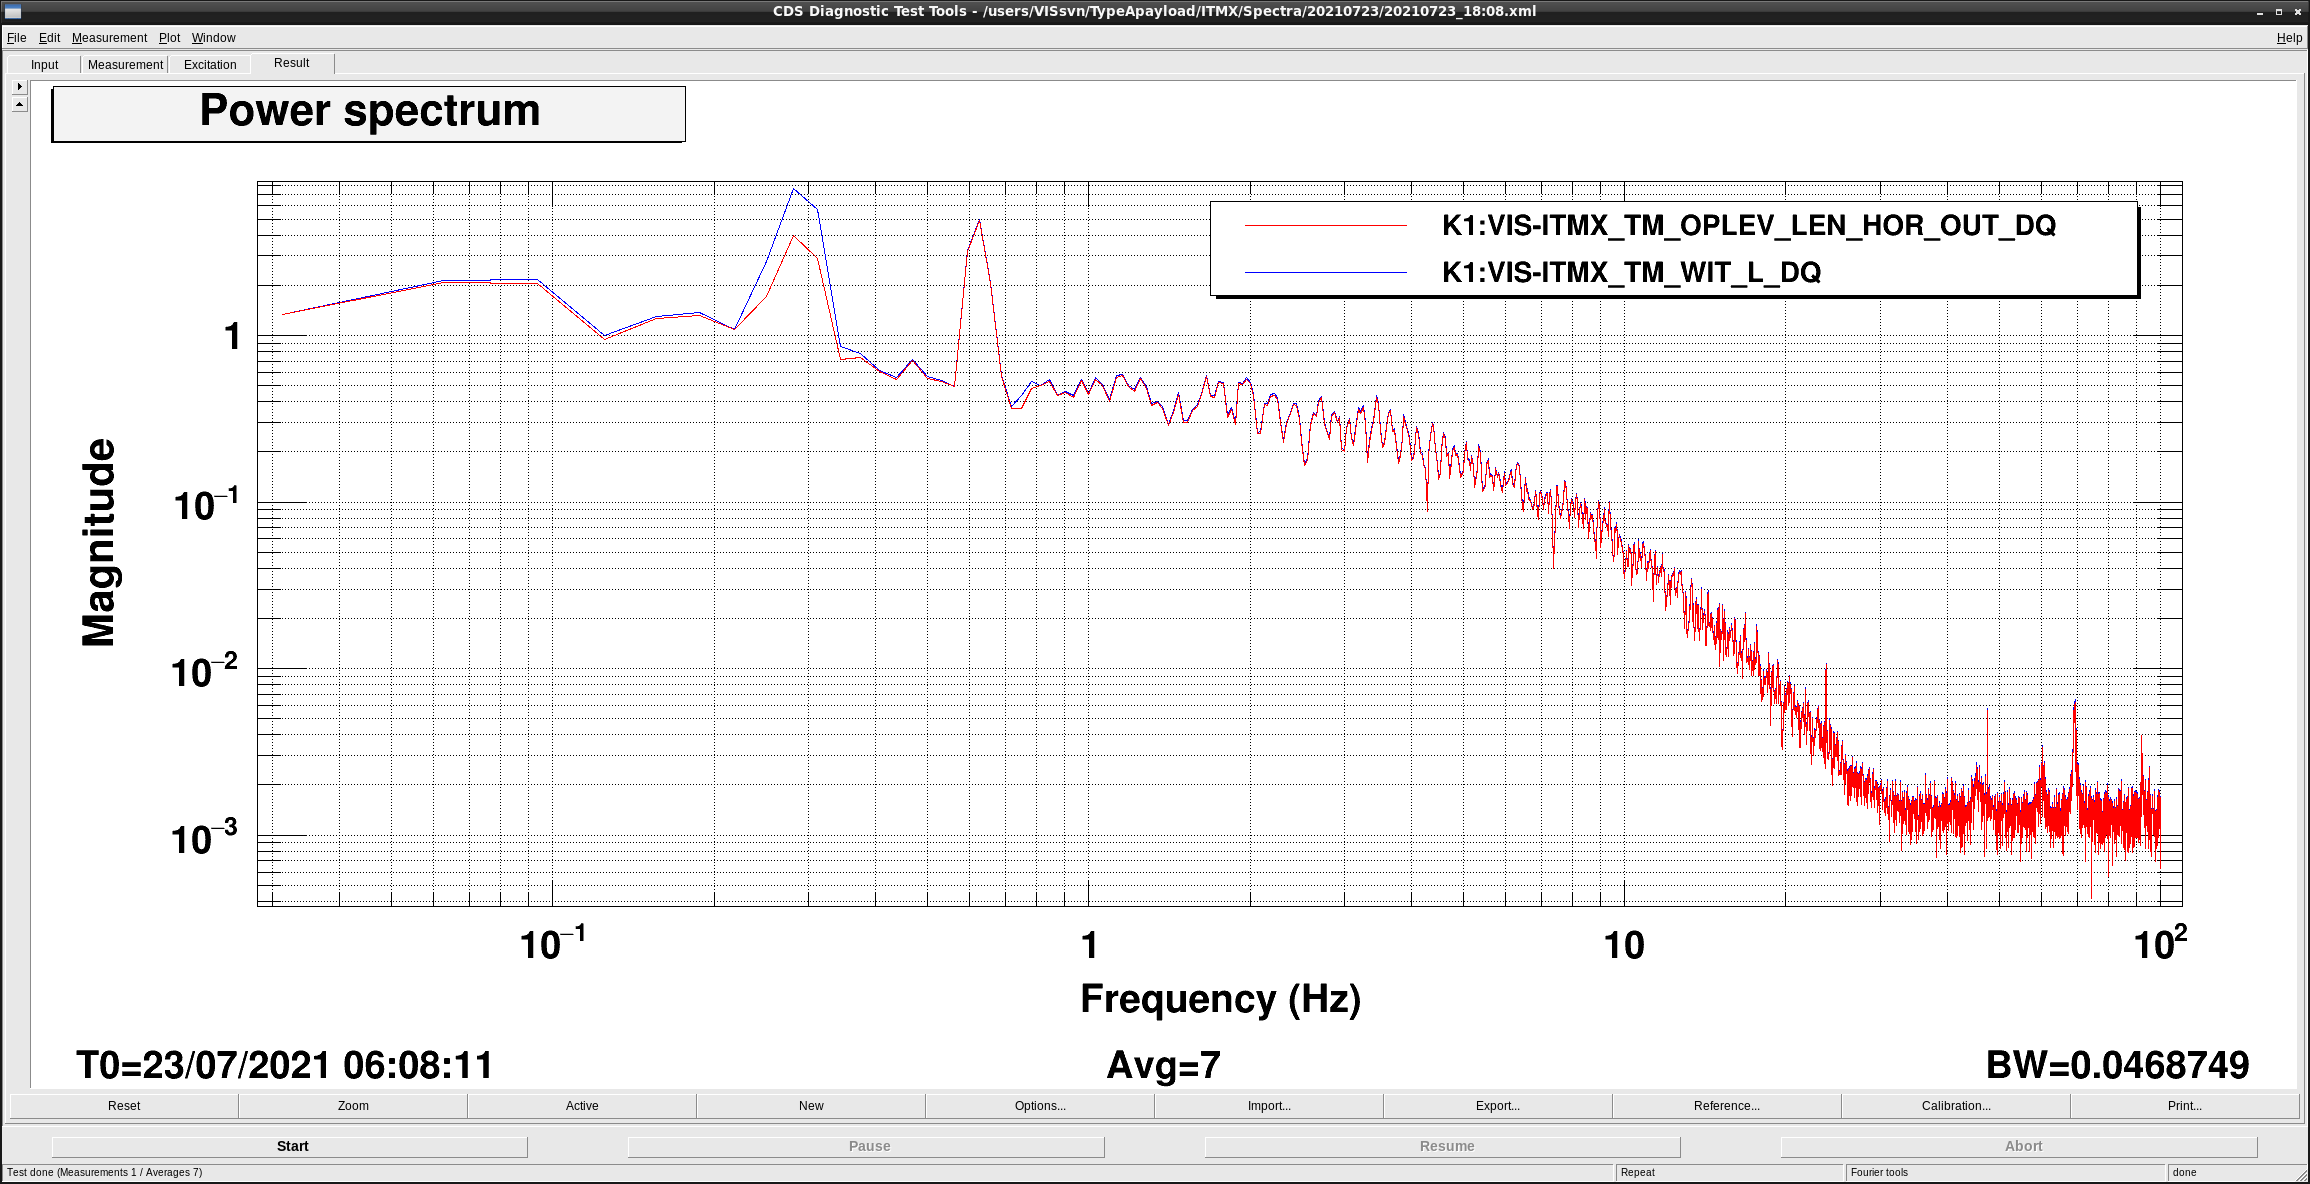
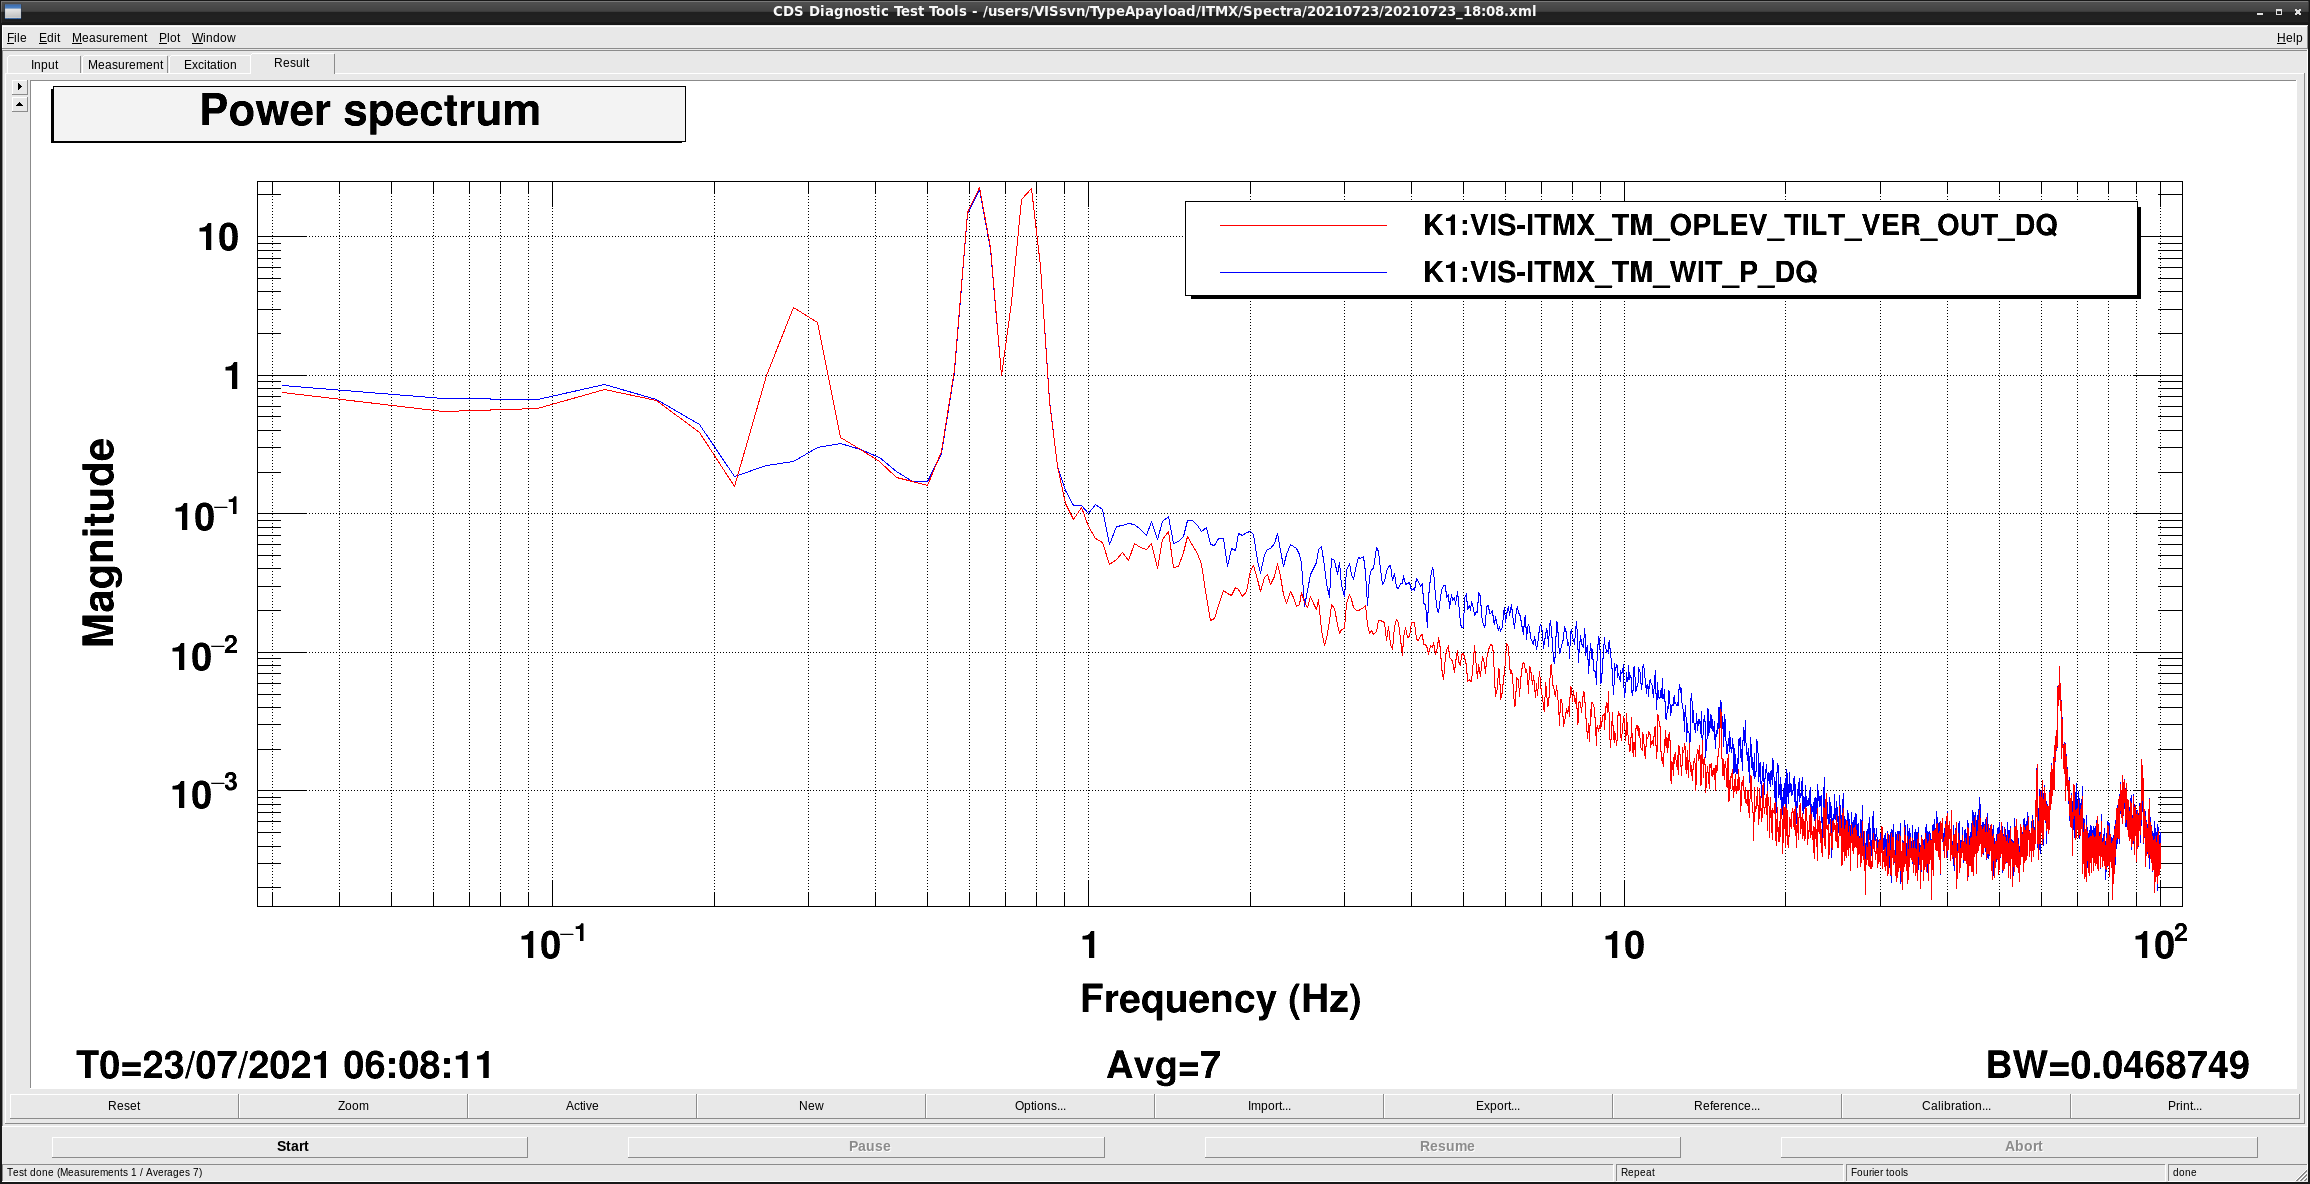
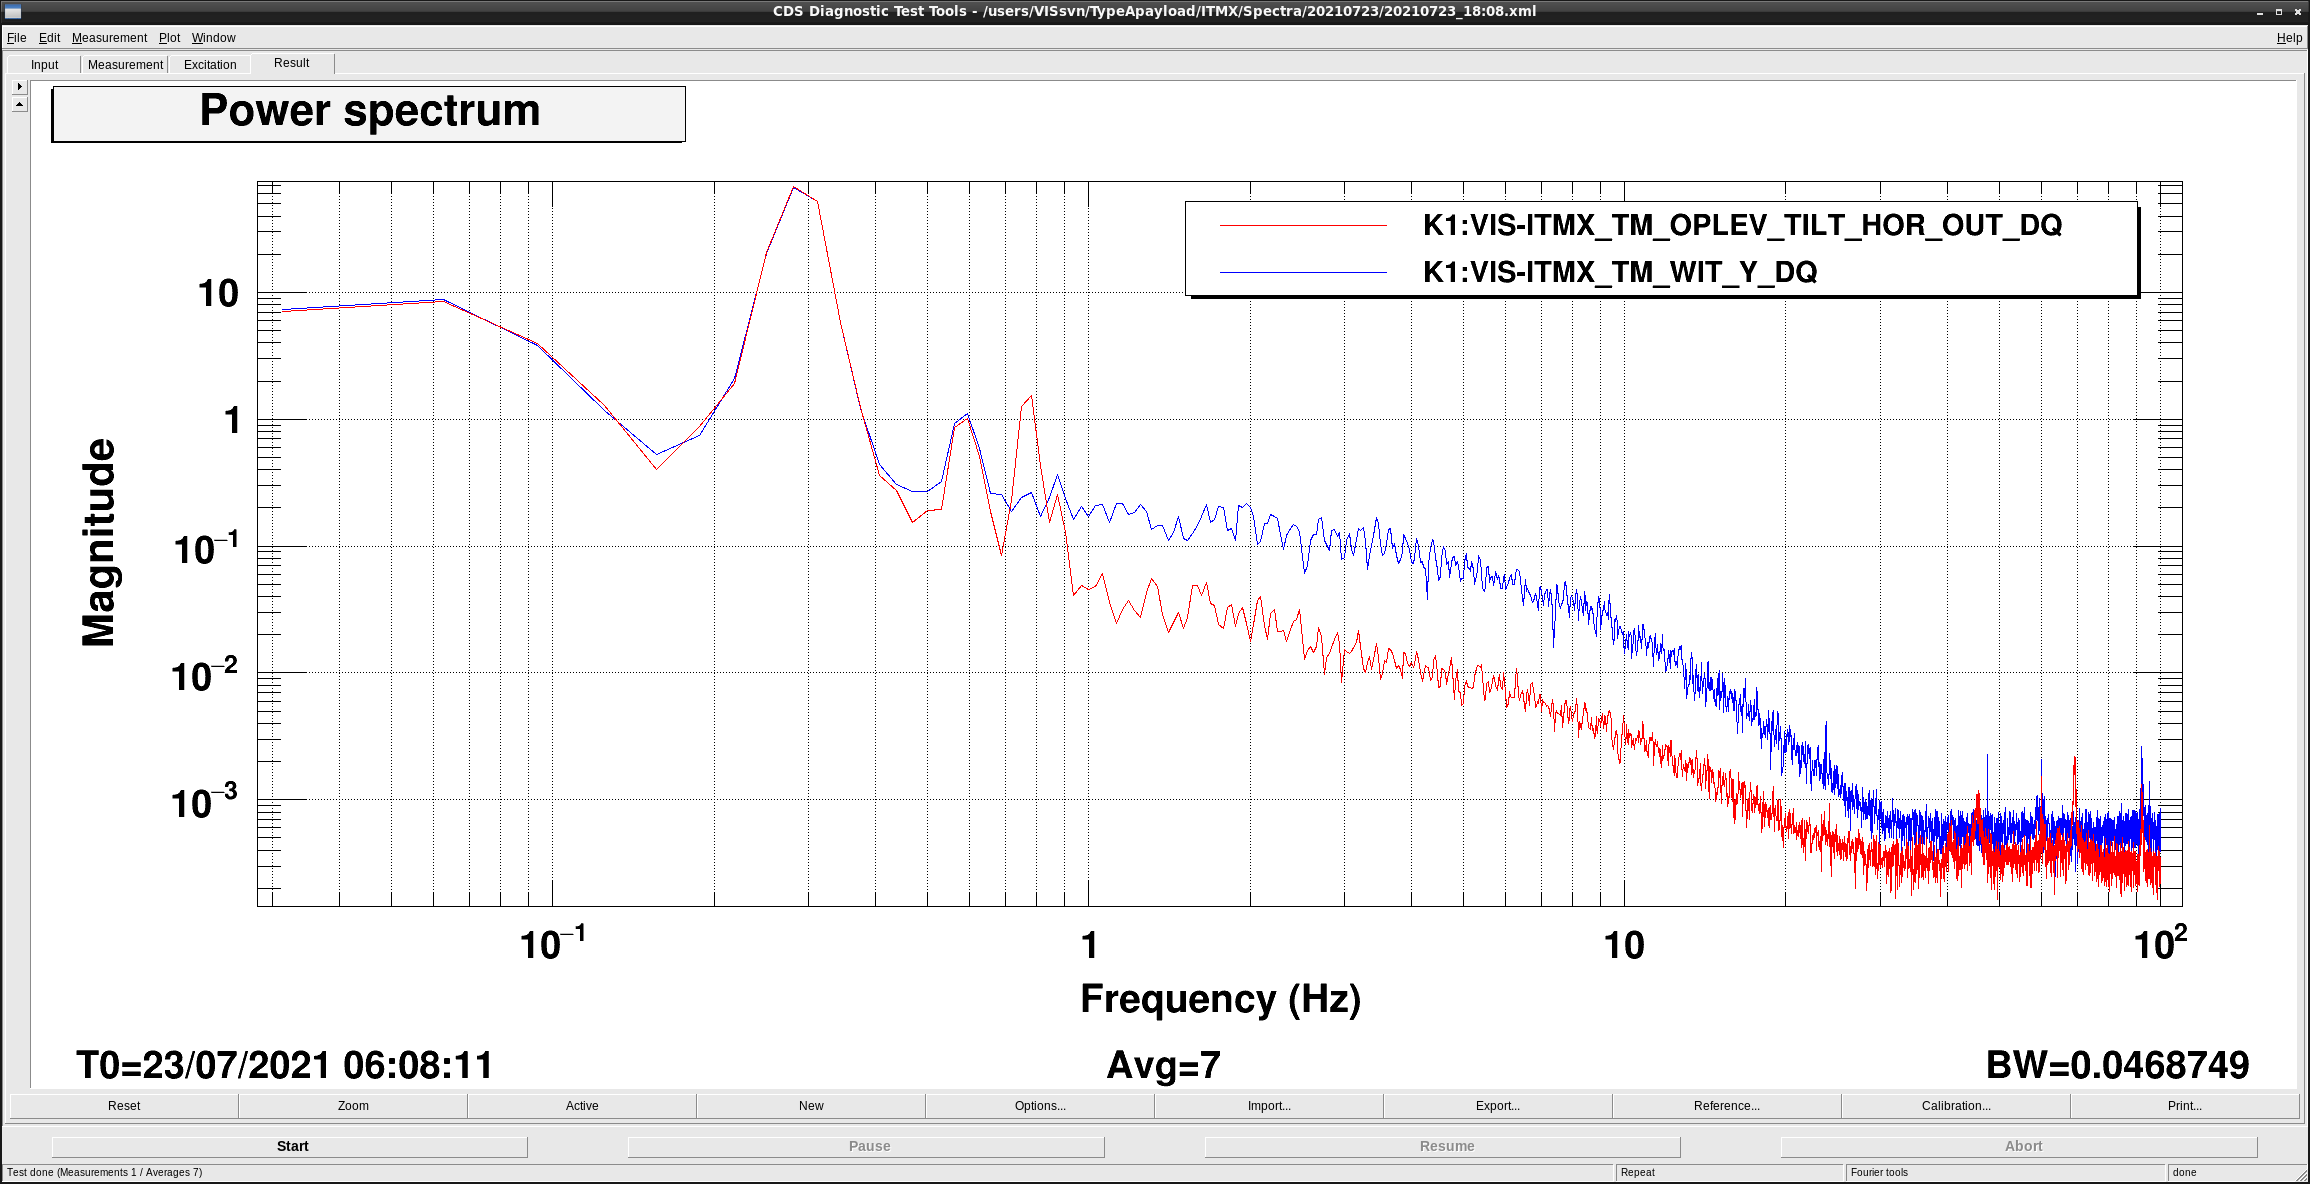
Finaly, we checked the performance of this decoupling matrix, and confirmed that it worked well-nigh (Fig5-7).
Only L to Y coupling has some trouble.
Moreover, LEN noise level is high. This is related to the fact that calibration factor of ITMX TM OpLev LEN HOR (418.2 [um/cnt]) is higer than other factors (17497).
