Miyo, Ushiba, Yokozawa, Akutsu
Abstract
In order to start to starndardize the acceptance check method of oplevs among the relevant subsystems (VIS, CRY, and AOS), we performed a course of the check measurement with the MCo oplev as an example. What we measured were
- Wavelength of the light source at Tx
- Power of the light source at Tx and Rx
- Beam profile of the light source at Rx
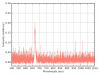
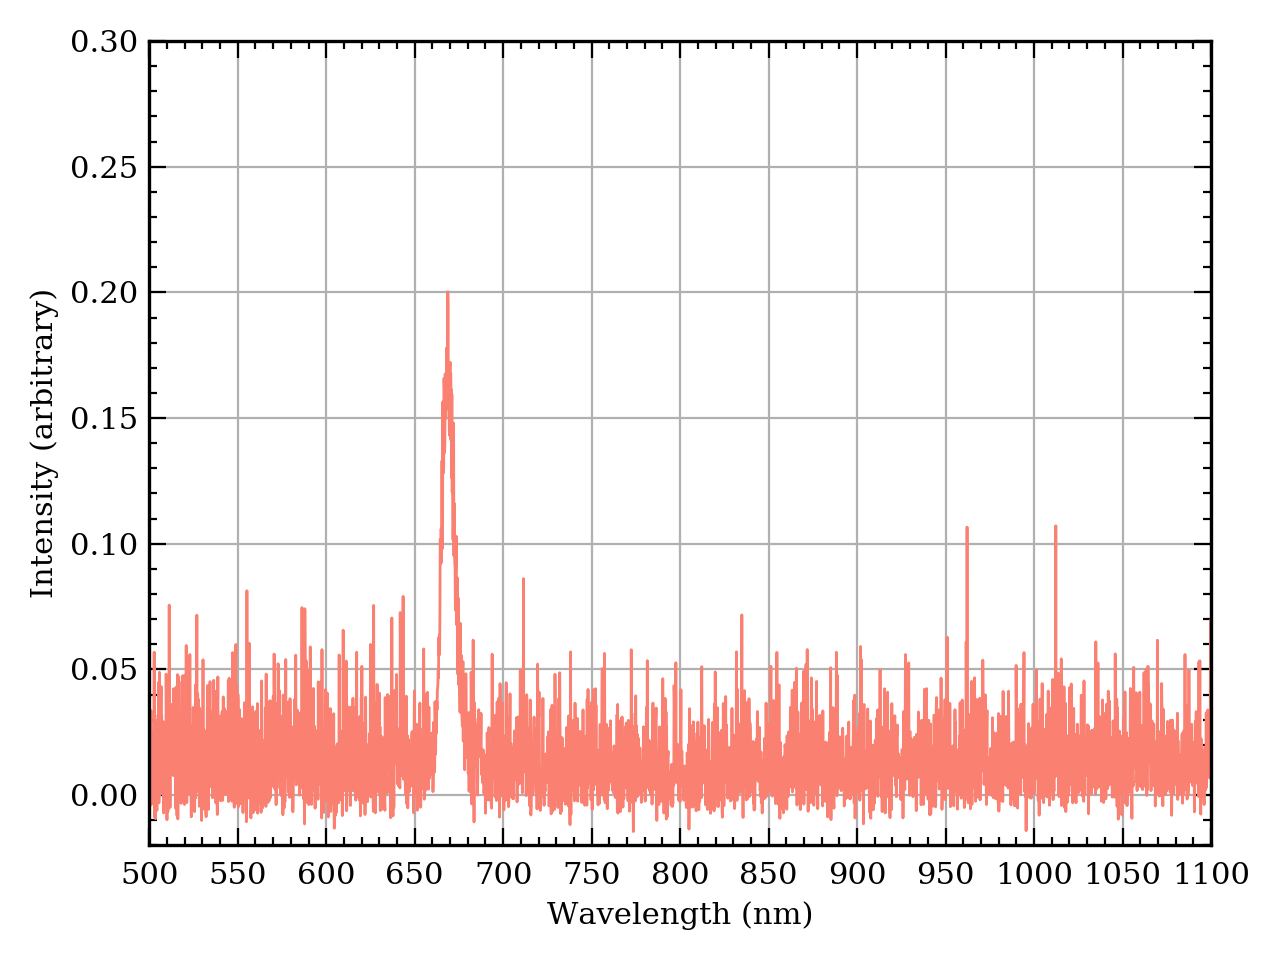
Wavelength measurement
Anway, the measured wavelength was around 670 nm as in the specification (Fig. 1). The wavelength of the light source was measured with a spectrometer CCS175/M by Thorlabs, which is a compact CCD spectrometer (Czerny-Turner type). The light collector was a cosine collector CCSA1 (Thorlabs), and the body of the spectrometer and the collector was connected with a patch fiber cable that was included in the set of the CCS175/M; using this specific fiber cable is important, as the spectrometer was calibrated with this cable aaccording to the company's explanation. Thanks to a diffuser in the cosine collector, I personally guess it is easier to align the setup to bring the light into the spectrometer.
The acceptance check list should include a text data (binary? which is preferred?) from the spectrometer software (Tholabs' software), and also the plot, maybe a fit result with a Lorentzian curve, and the estimated center wavelength (plus the width?). A script for this have to be prepared and shared later. The integration time was set to 8000 ms for example, but we could not easily find where to set the average number. When I saw the resultant csv file, there was description of Average, 1, and when I check the software manual now, I find the way to do averaging. Ok, next time.
Power measurement
Several power budget measurements for the oplev light sources had been already done as reported (for example, 16279 and 16332), but today we repeated it to share and confirm our understandings each other. One important discovery today was that I mistook the wavelength setting of the power meter in 16279! It should be 670 nm, not 760 nm! Due to this mistake, the measured power changed as follows:
| Mirror | Power at Tx (uW) | Power at Rx (uW) | Counts (By eyeballs) |
| MCo | 803 | 399 | n/a |
Please compare the mistaken data in in 16279. Today we didn't much care about the digital counts in DGS, but for the calibration of the QPD, it must be recorded. I guess Miyo-kun would prepare a script to take an average of the objective time.
Note that the power meter head has an inch-type screw hole!! Please use with a dedicated post!!! (and do not detach them each other...).
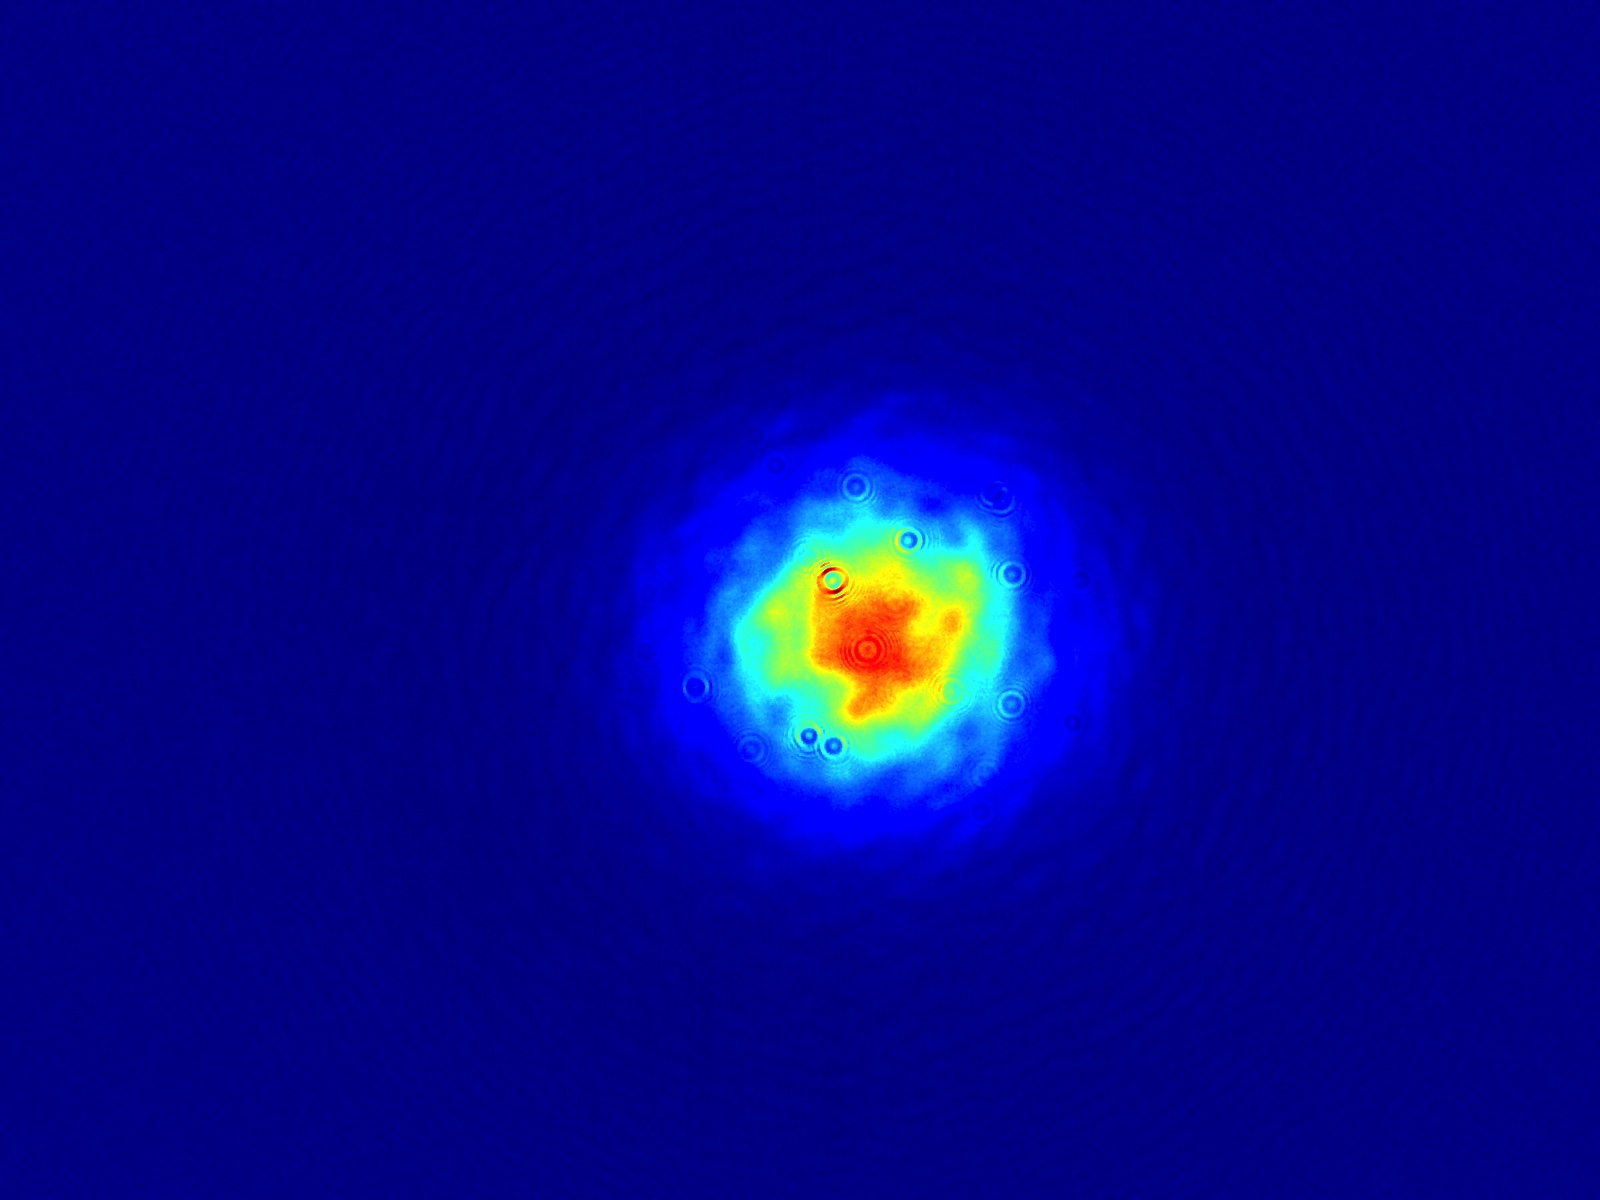
Beam profile measurement
The beam profle at Rx was measured (Fig. 2) with CinCam CMOS-1203 by Cinogy and the software RayCi 64 Standard ed. For a memo for the future, the specification of the beam profiler is as follows (see here as of today):
- Active area (w/o cover glass): 7.2 mm x 5.4 mm
- Number of pixel: 1600 x 1200
- Pixel size: 4.5 um x 4.5 um
- Beam diameter min / max (recommended): 45 um / 4 mm
Here, you can confirm the relation of the numbers by that 4.5 um x 1600 = 7.2 mm and 4.5 um x 1200 = 5.4 mm.
The software requires a little bit complicated setup parameters. Maybe we need to prepare a basic setup file, and with which we would modify the measurement settings that depend on each oplev setup (PR2, BS, Type-A... etc). According to my memo, in LiveMode, the wavelength should be set to 670 nm (but I do not think this could affect the measurement outcomes), and set Exposure time: 100us, Gain: 0dB, Frame rate: auto (14fps --- I think this is just for diplaying... see and confirm with the manual by yourself!), Background: 100 frames. and take Background. Then choose Single Measurement from the meeur, and set Meaasurement 8 frames, Median filter ON, and Beamwidth Fit Gauss, and the Threshold 13.53% (meaning 1/e^2). Then run the single meaasurement. Save the resultant measurement in *.tif file. (Note that Fig. 2 is a corresponding jpg file that was converted from the saved tif file for showing in this klog.) I hope the tif file is a group of raw bitmap data, and we can re-anaylize them later. Anyway, on the screen, we can see Statistic X Cross Section Fit Gauss: Width (1/e^2): 1.930 mm, Y Cross Section Fit Gauss: Width (1/e-2): 1.747 mm.
Still there are several questions on the usage of this software, we might need to read the manual furher.
- Note that this beam profiler has several M4 screw holes... when we did our work today, I misunderstood that the screw hole was in the inch type, but the inch-type was the stop screw itself! and that matched to the power meter, which required an inch-type screw. OMG.
- Note also that the software requires a proper dongle USB key.