Nakano, Ushiba, Kenta
## Abstract
we did cavity scan for PRMI and DRMI to measure round trip gouy phase of PRCL and SRCL. We found that the PRCL gouy phase is 26.6 +/- 1.5 degrees and the SRCL gouy phase is 80.18 +/- 5.9 degrees. The result of SRCL is inconsistent largely with the previous result, But according to Fig 11 in KAGRA design doc, It may not be necessary to adjust the SRCL for the time being, either in this or the previous results.
## What we did
- To make cavity scan measurement of PRCL, we aligned PRMI, and only lock the MICH loop. At this point, we used the REFL DC power as the trigger and REFL51Q was used as the error signal. The PRM was not controlled, and free-swung. With that configuration, the POP DC power was measured.
- Then, we misaligned PRM by 10urad in yaw direction, had same measurement.
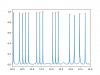
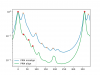
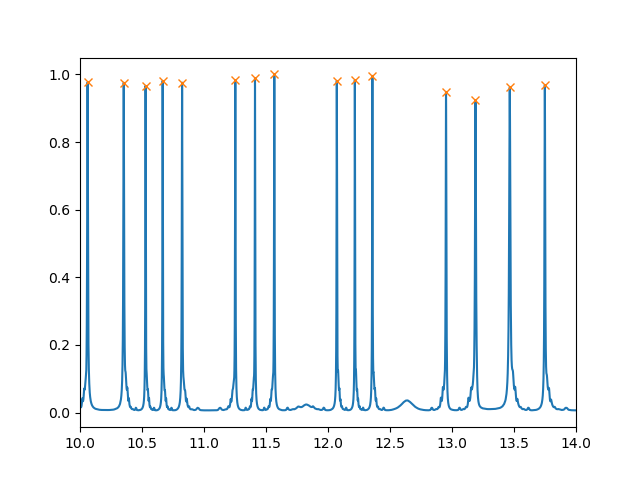
- We picked up the good period where the PRM is moving for several FSRs to guarantee that the PRM swing speed is constant as shown in Fig. 1. Then, we analyze 1FSR spectrum. The horizontal axis was calibrated to degree, and superimposed two spectra with PRM aligned/misaligned. This plot allows us to determine the phase difference from the fundamental mode to the first harmonic of the Gaussian beam, and we can check which peak is the TEM10/01 mode which is enhanced by the PRM misalignment. Figure 2 shows the change in the amount of light coming out of the POP in response to the movement of the PRM. Green line in the figure is the amount of light when PRM is aligned, Blue is the one when PRM is misaligned. The vertical axes shows the sideband power normalized with the maximum value among the time block we selected.
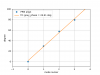
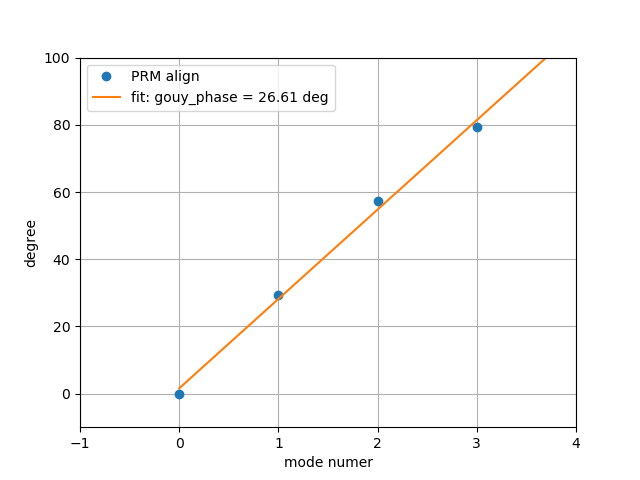
- The each peak of higher order mode appears by equal distance. Therefore, the relation between the relative phase and peak index is linear and we obtain the gouy phase as the incline coefficient. Fig 3 shows the plot of the relation between the relative phases and mode order. As you can see, the relation is linear. By fitting in the four peaks seen in the green line, we got this slope of 26.61 degrees,
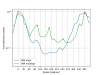
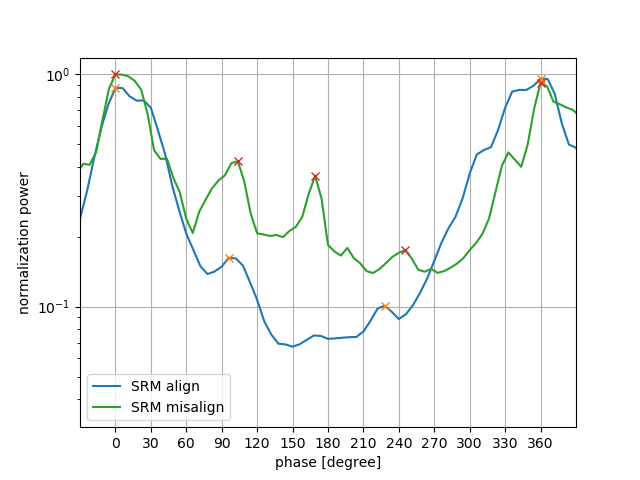
- The same measurements were performed with the PRMI locked and the SRM free swinging. At this time, SRM was misaligned by 10 urad in the yaw direction. Fig. 4 shows the change in the amount of light coming out of the AS in response to the movement of the SRM. Blue line in the figure is the amount of light when SRM is aligned, Blue is the one when SRM is misaligned.
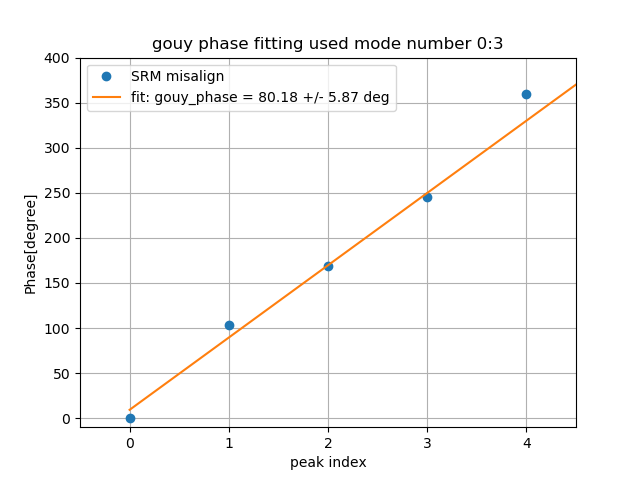
- Similarly, we plotted the relation between the phases and the indexes of each peaks(Fig 5). we obtained the SRCL gouy phase 80.2 +/- 5.9 deg by fitting in the first four peaks seen in green line.
- However, the gouy phase of SRM in this time is suspicious because the one measured by Stefuns previously was about 50 degree, which is inconsistent with the measurement in this time. According to Figure 11 in the design document, The vertical axis in Figure 11 is the one-way gouyphase of the SRCL (i.e., half of the round trip gouy phase of the SRCL). The horizontal axis is the gouy phase of the PRCL one-way trip. Looking at the present results (PRCL/,SRCL/2) = (13, 40), we can see that we are in the blue area in Figure 11. And even if the SRCL is about the same as last time, we may not need to adjust the SRCL because we are in the blue area as well.
