KAGRA strain sensitivity is calculated online starting from 10 Hz and below there is not direct way to monitor it.
However, to know how much the actual sensitivity is far from the nominal value of 10^-18 m/sqrt(Hz) at 10 Hz and to identify which noise sources are limiting there, it is also important to estimate it from [0.1 10 Hz].
One way to estimate the sensitivity in this region is to use the feedback force (F) sent through the End TMs filtered with the transfer function M (actuation-displacement along the optical axis of the mirror) as following:
Darm_lf = sqrt((Fex ⋅ Mex)^2 + (Fey ⋅ Mey)^2 ). (for more details see this document: https://gwdoc.icrr.utokyo.ac.jp/cgibin/private/DocDB/ShowDocument?docid=11694).
At this point it is possible to project on Darm_lf the noise sources and see who is the guilty guy.
In this frequancy range, first contribution is given by the the IP residual motion trasmitted to TM which can be calculated as following:
S_tm = S_ip ⋅ D_ip2tm
where S_ip is the IP spectra and D is the transfer function displacement- displacement IP to TM along the optical axis of the mirror.
The second contribution comes from the vertical residual motion transmitted to the TM. In fact, due to Earth curvature, a vertical to horizontal coupling is expected and for this reason It is interesting to calculate it.
In particular for KAGRA, EY suspension has 3 GAS filters stuck and this reduce the passive attenuation of the vertical direction of a factor 1/f^6 and consequently the sensitivity in low frequency region may be limited by it.
The EY_F0 residual motion trasmitted to TM and can be calculated as following:
S_tm = S_f0 ⋅ a_grav*D_f02tm
where S_f0 is the F0 spectra and D is the transfer function displacement- displacement F0 to TM along the vertical axis of the mirror.
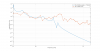
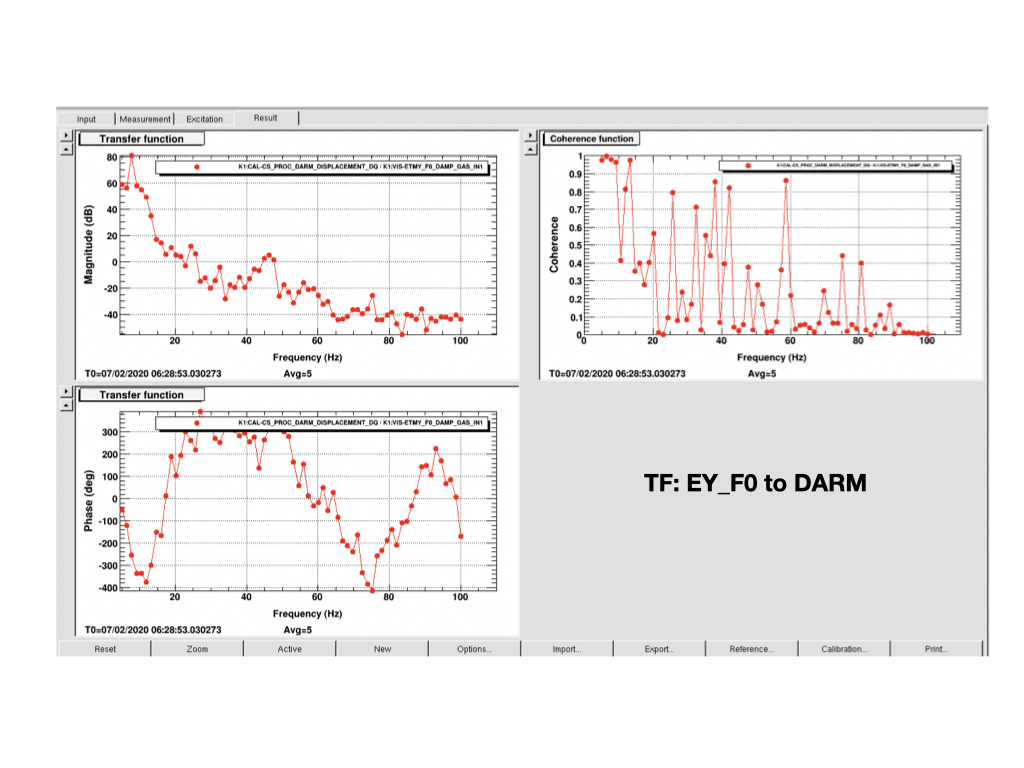
Pic1 shows the EY transfer function from F0 to DARM (a_grav*D_f02tm ).
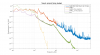
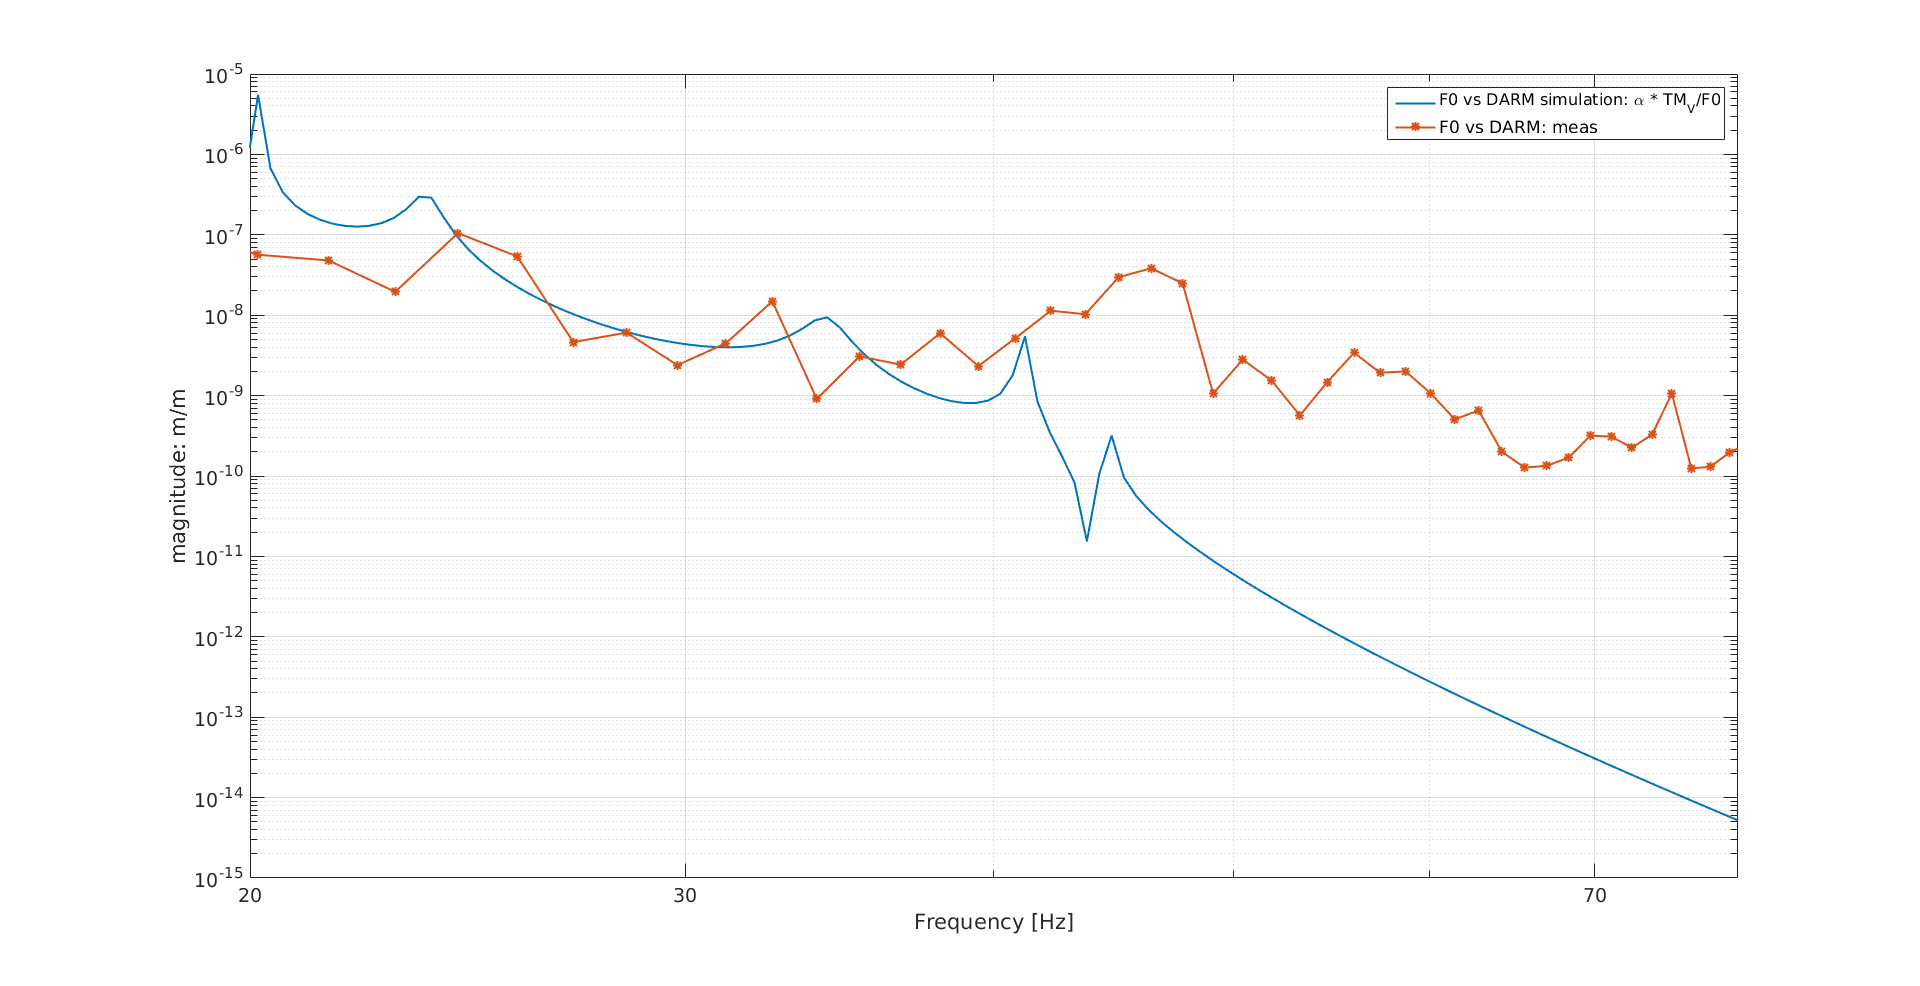
Rescaling this data on the theoretical TF TM_v/F0 (kindly provided by Shoda-san) it is possible to estimate the coupling factor. Since the coherence is not good above 45 Hz, I rescaled the gain around 30 Hz and I estimated that a_grav is about 2.66 10^-4 (see Pic2).
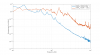
By combining the Type A IP signals and EY F0 (filtered with the mechanical TFs) It is possible to project their mechanical noise contribution onto the DARM sensitivity.
By looking at Pic3, we can see that:
-From 0.1 Hz to 0.8 Hz DARM is limited by longitudinal motion of the IP (this part of the spectra changes according with the microseismic conditions)
-the longitudinal passive attenuation is about 2 10^-18 m/sqrt( Hz) @ 3 Hz
-Because of the GAS filters stuck at EY, the vertical passive attenuation is 10^-14 m/sqrt(Hz) @ 10 Hz. Nevertheless this, the sensitivity is not limited by it.
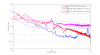
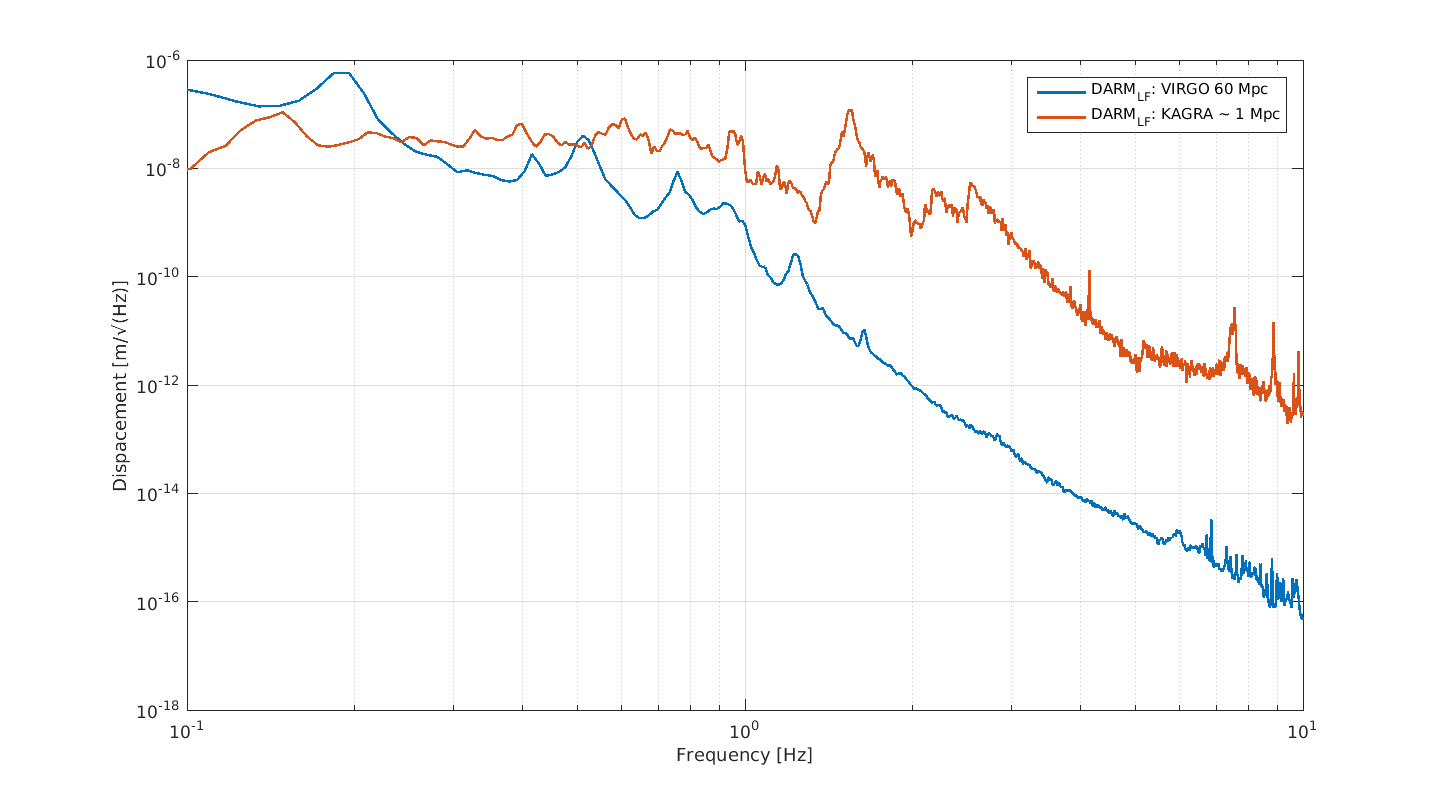
In Pic4 I compared the KAGRA and VIRGO sensitivities (VIRGO sensitivity kindly provided by Paolo Ruggi of Virgo collaboration) in the region [0.1-10Hz].
We can see that above 1 Hz, KAGRA sensitivity is worse than VIRGO one by a factor 10000:
Virgo= 5 e-17 m/sqrt(Hz) @ 10 Hz KAGRA:8 e-13 m/sqrt(Hz) @ 10 Hz
This large gap can be explained by:
1. EY GAS filter stuck—> less vertical passive attenuation (10^-14 @ 10Hz)
2. Payload control noise
3. aligneament fluctuations, etc..
Below 1 Hz the sensitivities are comparable, but still the KAGRA one is worse by a factor 6 in the microsemsic region (0 -1)Hz.
This can be explained by the fact that in VIRGO the IP are controlled with blending technique (LVDT and accelerometer are mixed at around 0.05 Hz) thank to that it is possible to achieve a large suppression of the microseismic noise (more than a factor 10) while in KAGRA the IP are controlled with the sensor correction technique that provide a suppression of the micro seismic peak of about a factor 3.
Pic 5 shows the residual motion of the VIRGO IP controlled with blending technique and KAGRA IP controlled with sensor correction technique.
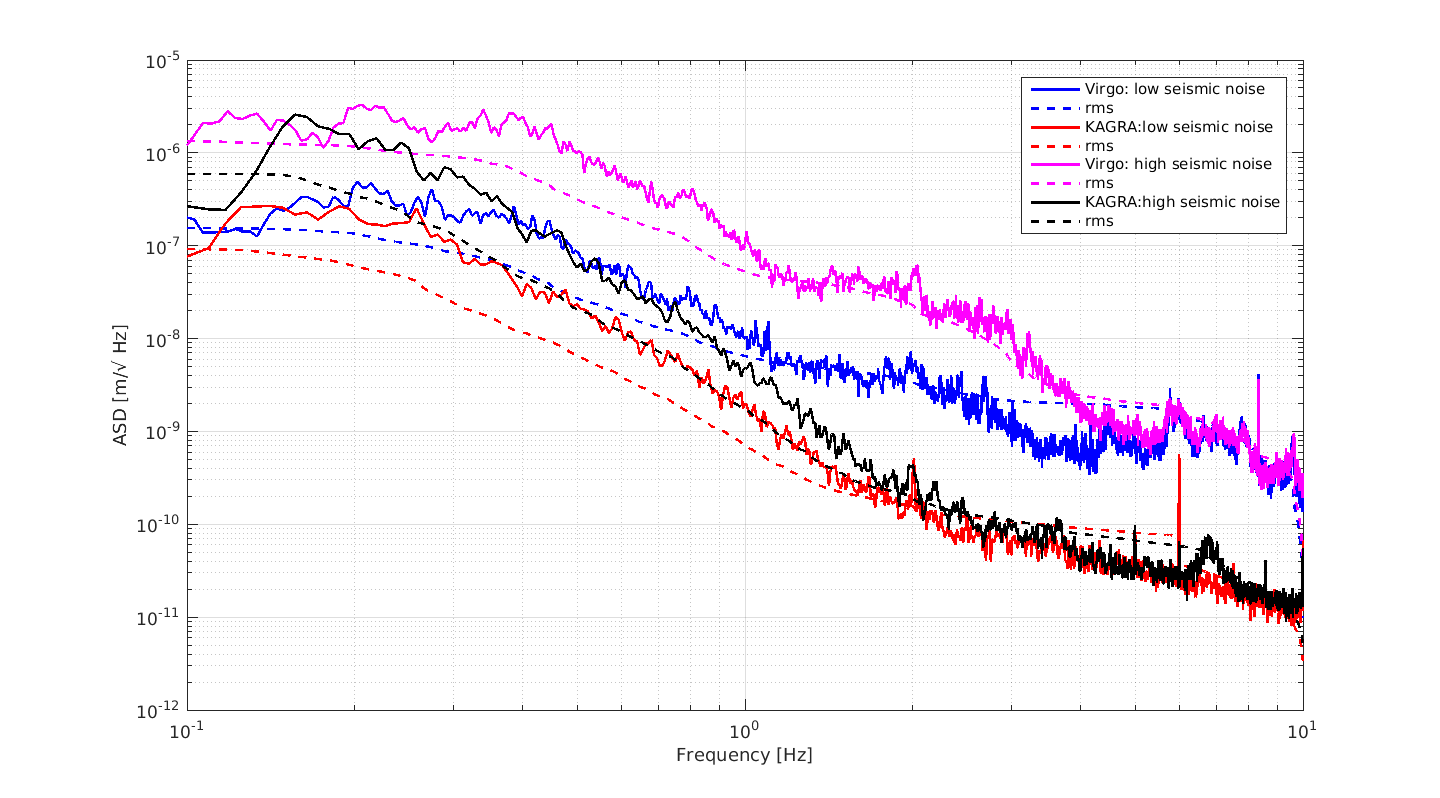
Pic 6 shows the comparison of micro-seismic spectra measured at VIRGO site and KAGRA site in two different condition (High and low micro-seismic noise).
We can conclude that to improve the sensitivity we have to:
- Recover the GAS filters stuck at EY
- Improve the sensitivity of the inertial sensor below 0.1 in order to implement a suitable blending technique which help to suppress more the microseismic noise so to reach the VIRGO's IP performance (see Pic5).
%% Aknowledgements %%%
I want to thanks Paolo Ruggi of Virgo collaborazion who kindly provided to me the VIRGO data and Shoda-san who kindly provided to me the theoretical transfer function TM_v/F0.
