Reports 1-1 of 1 Clear search Modify search
DetChar (General)
tatsuki.washimi - 18:36 Friday 10 April 2020 (14096) Print this report
Line noise caracterization : 60Hz

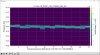
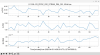
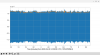
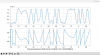
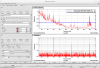
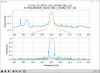
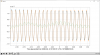
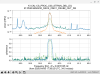
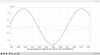
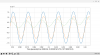
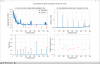
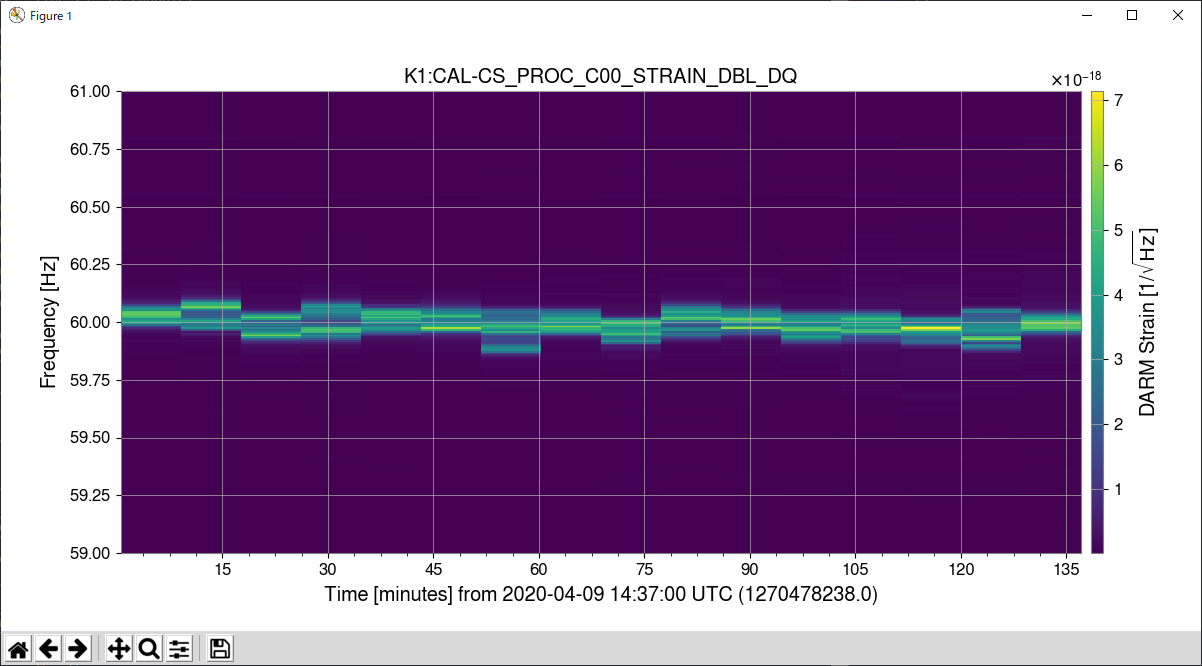
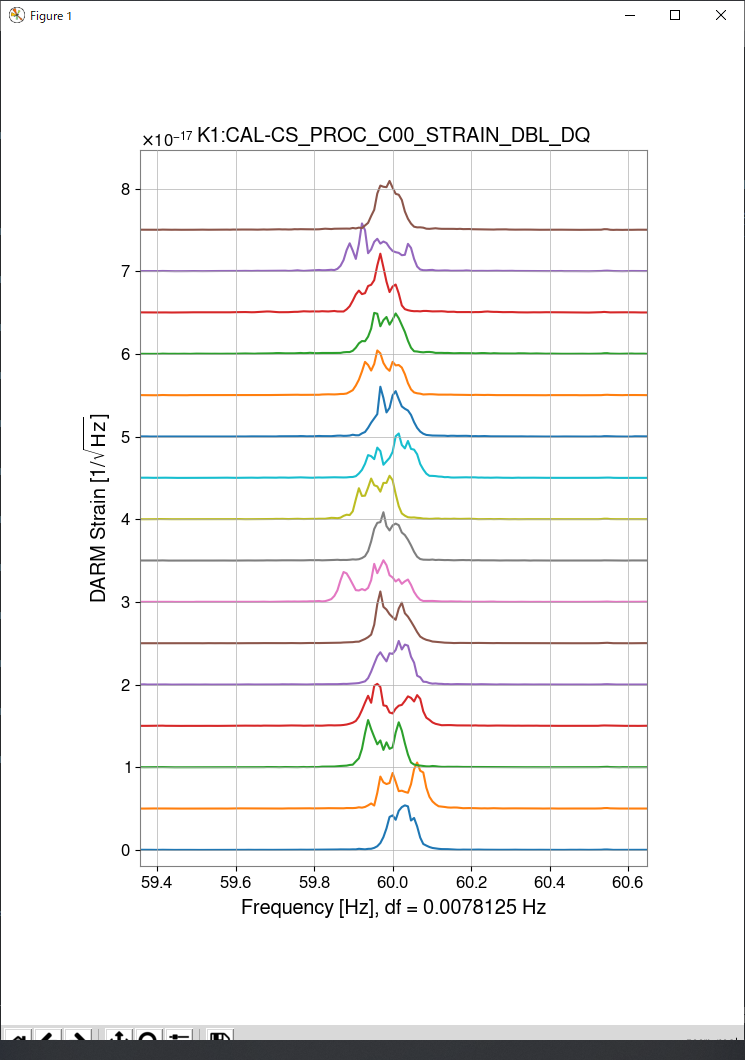
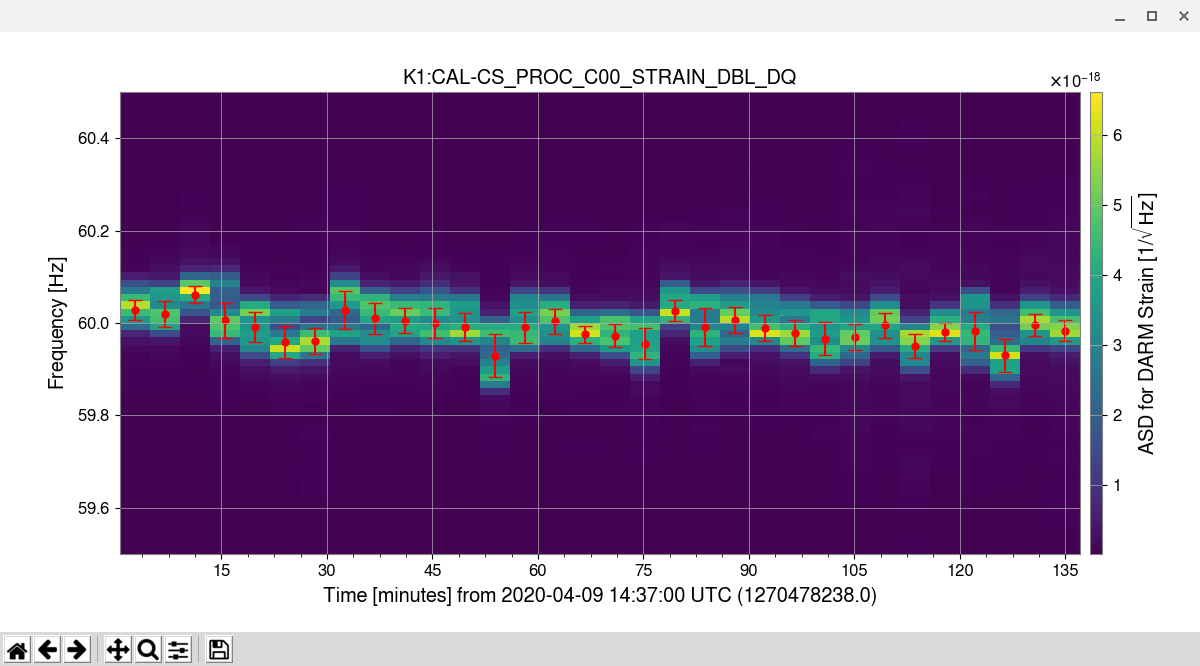
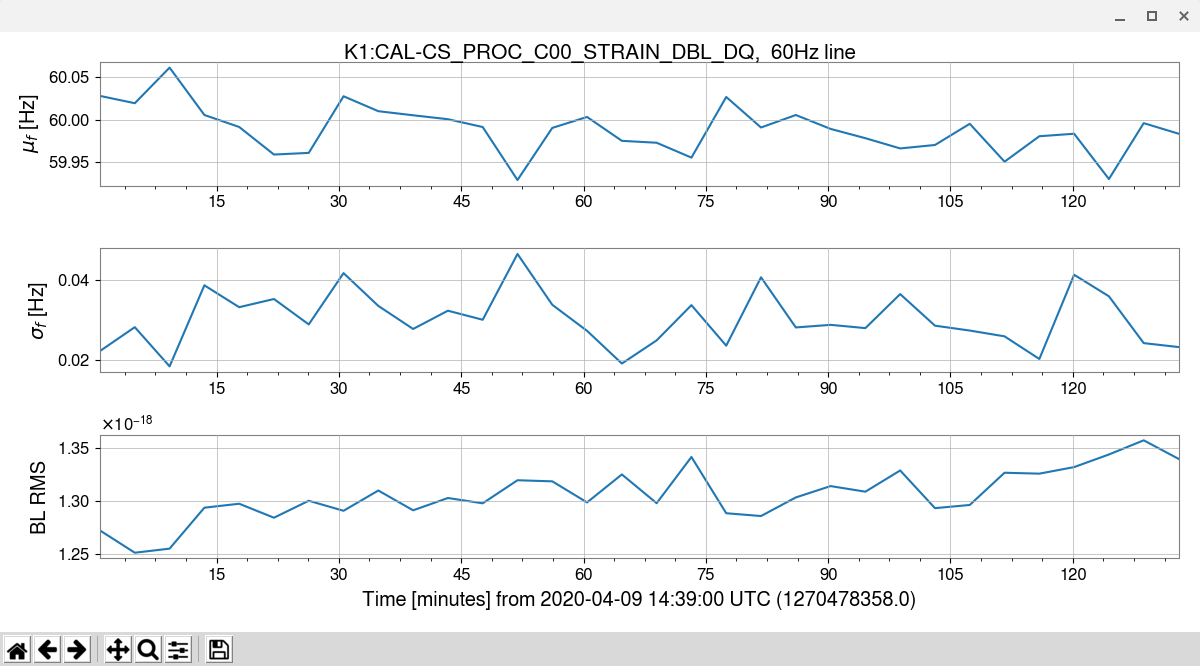
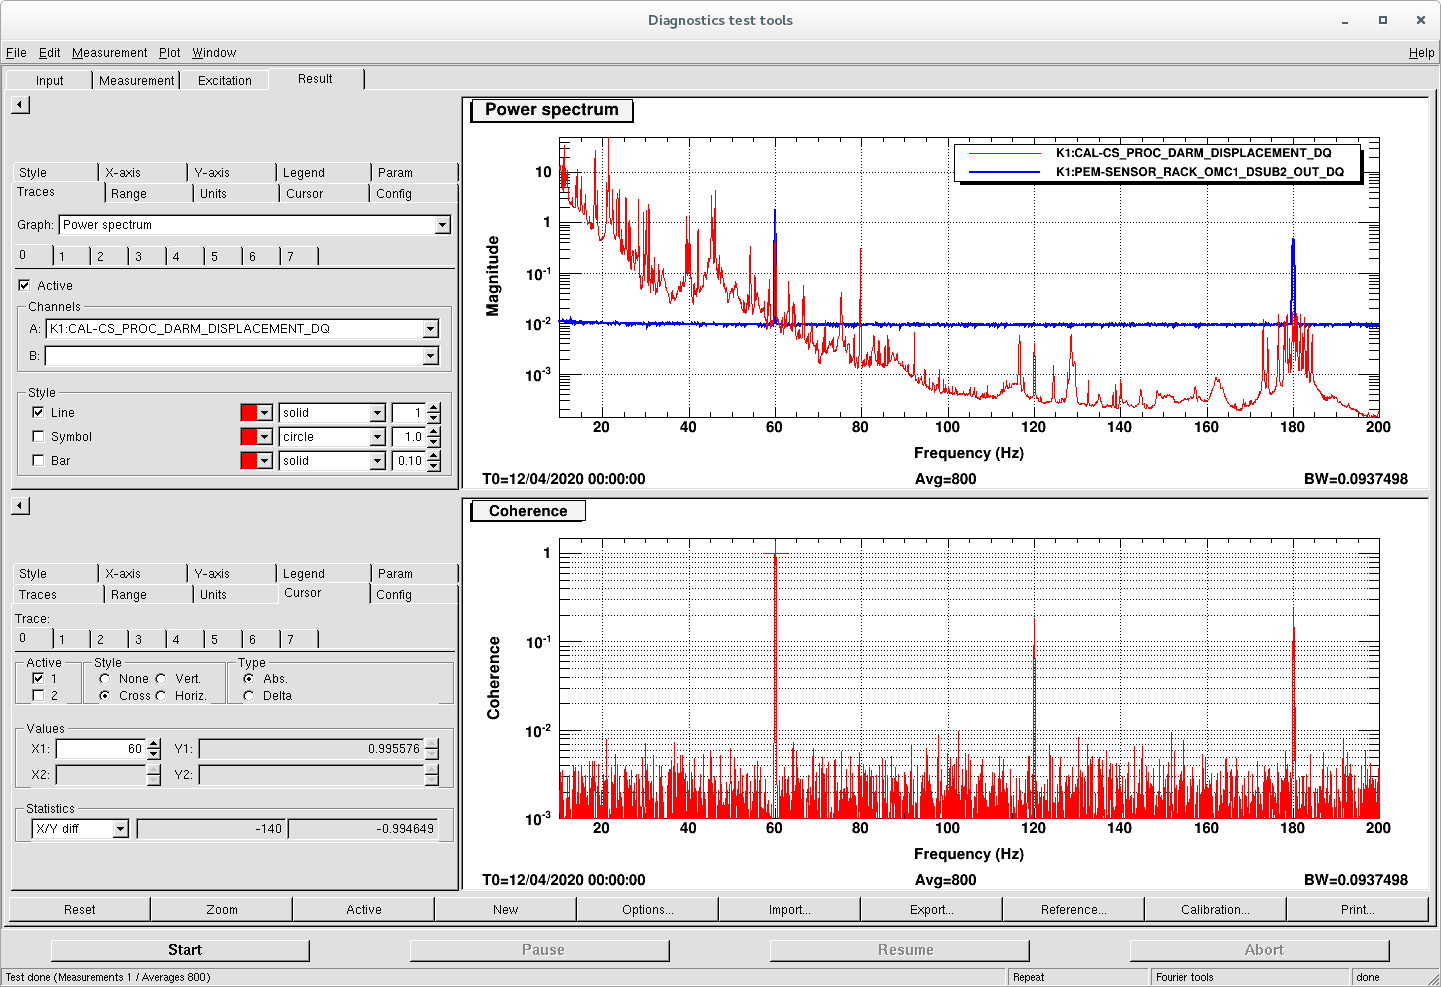
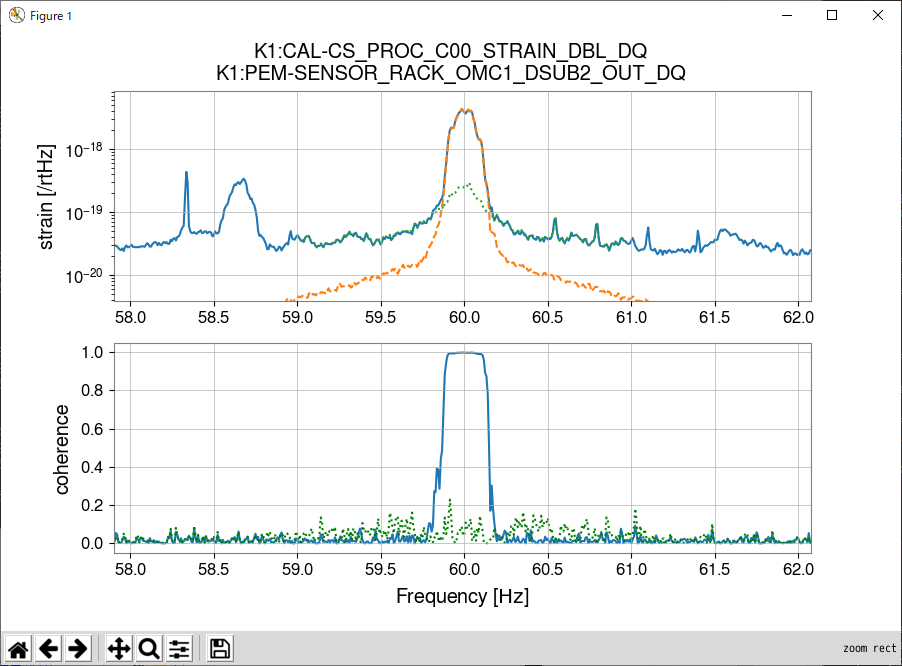
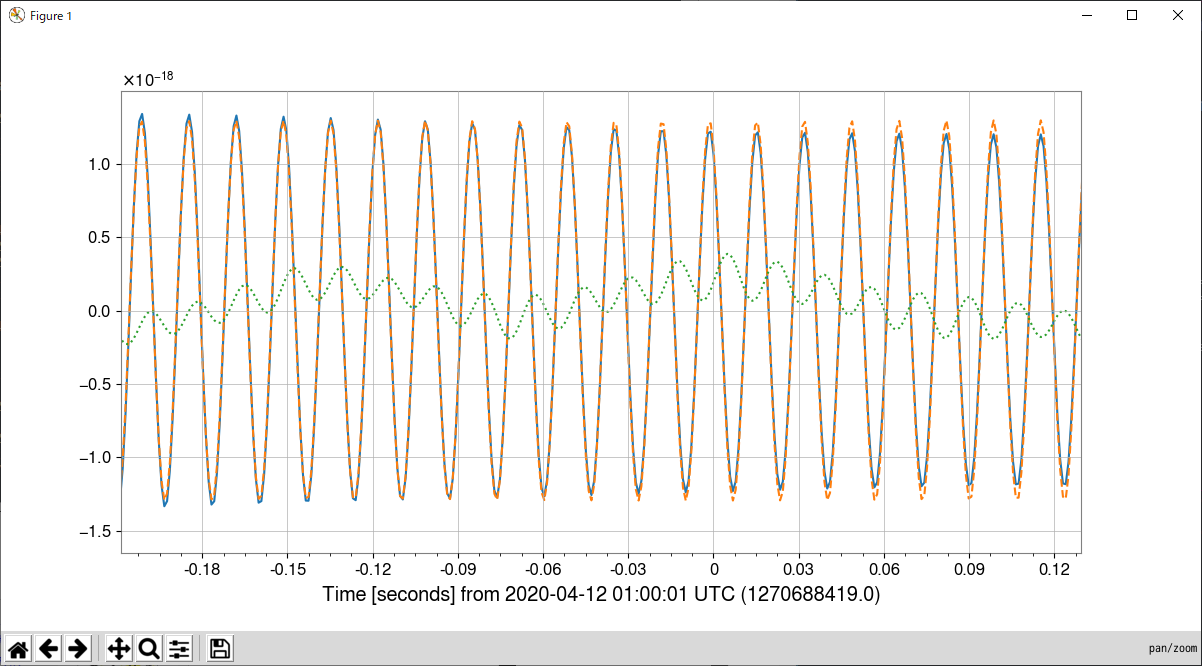
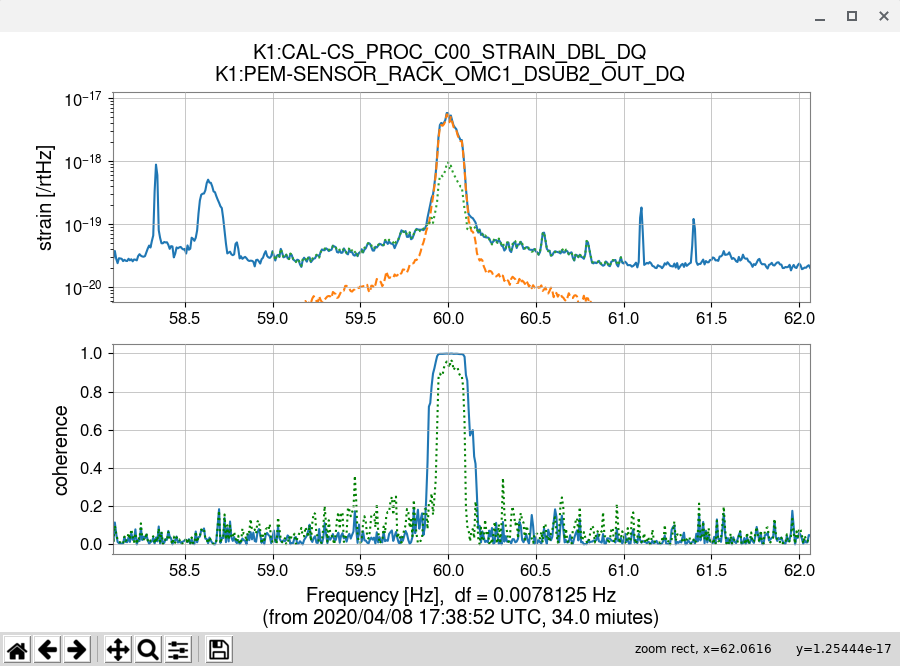
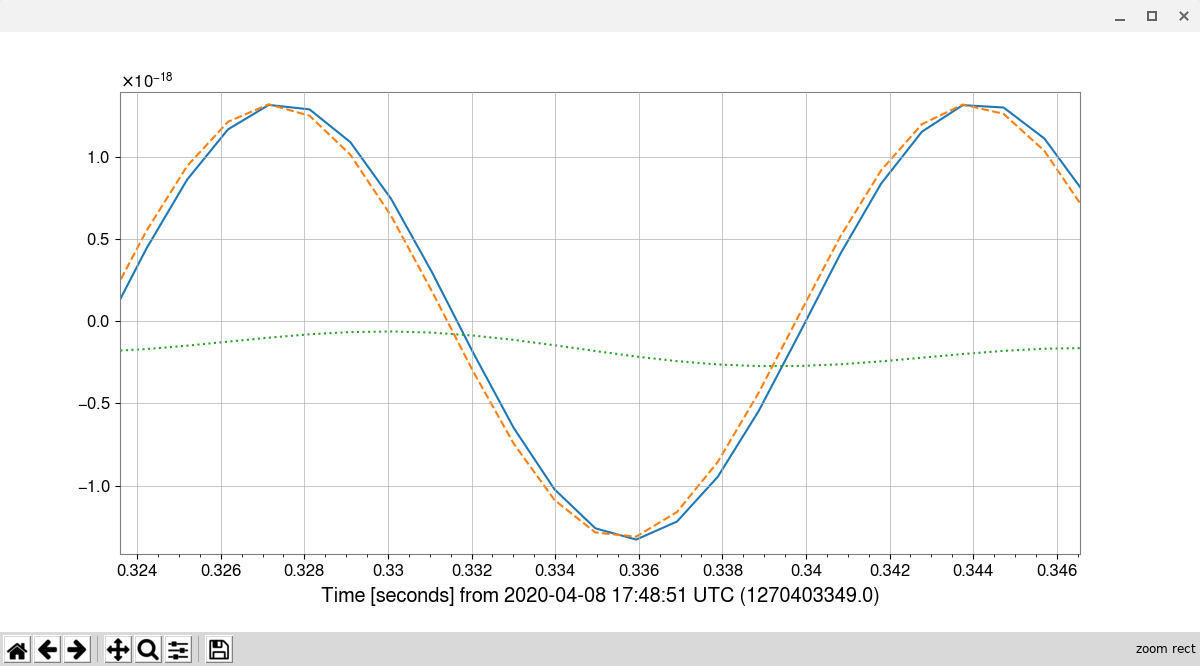
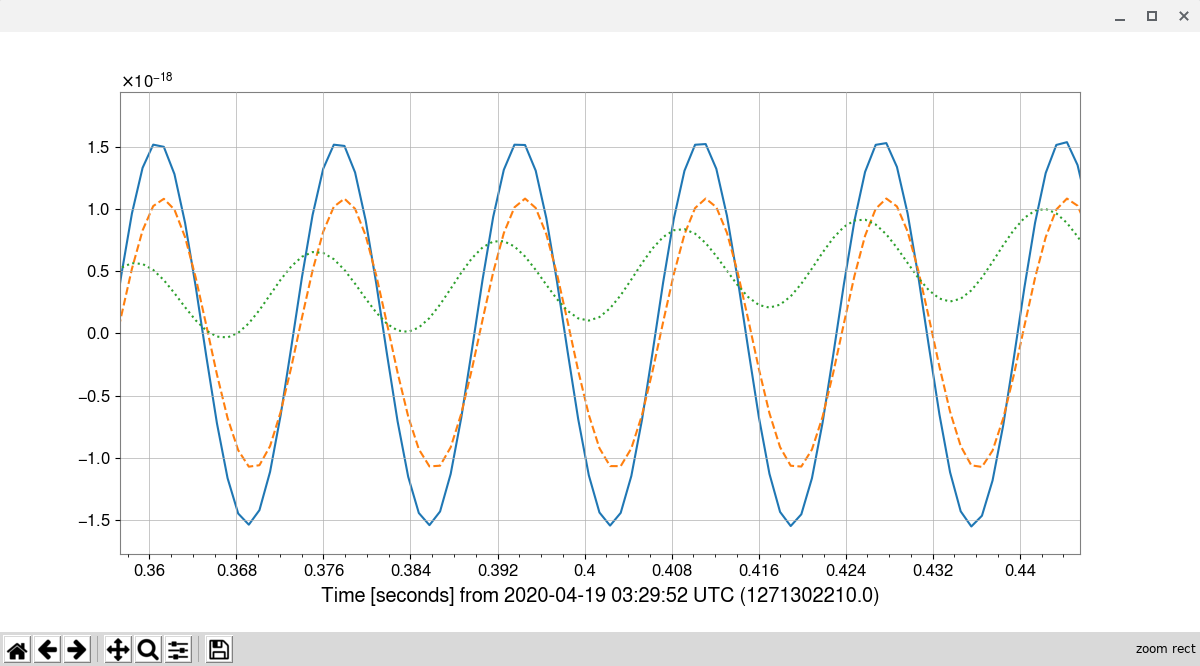
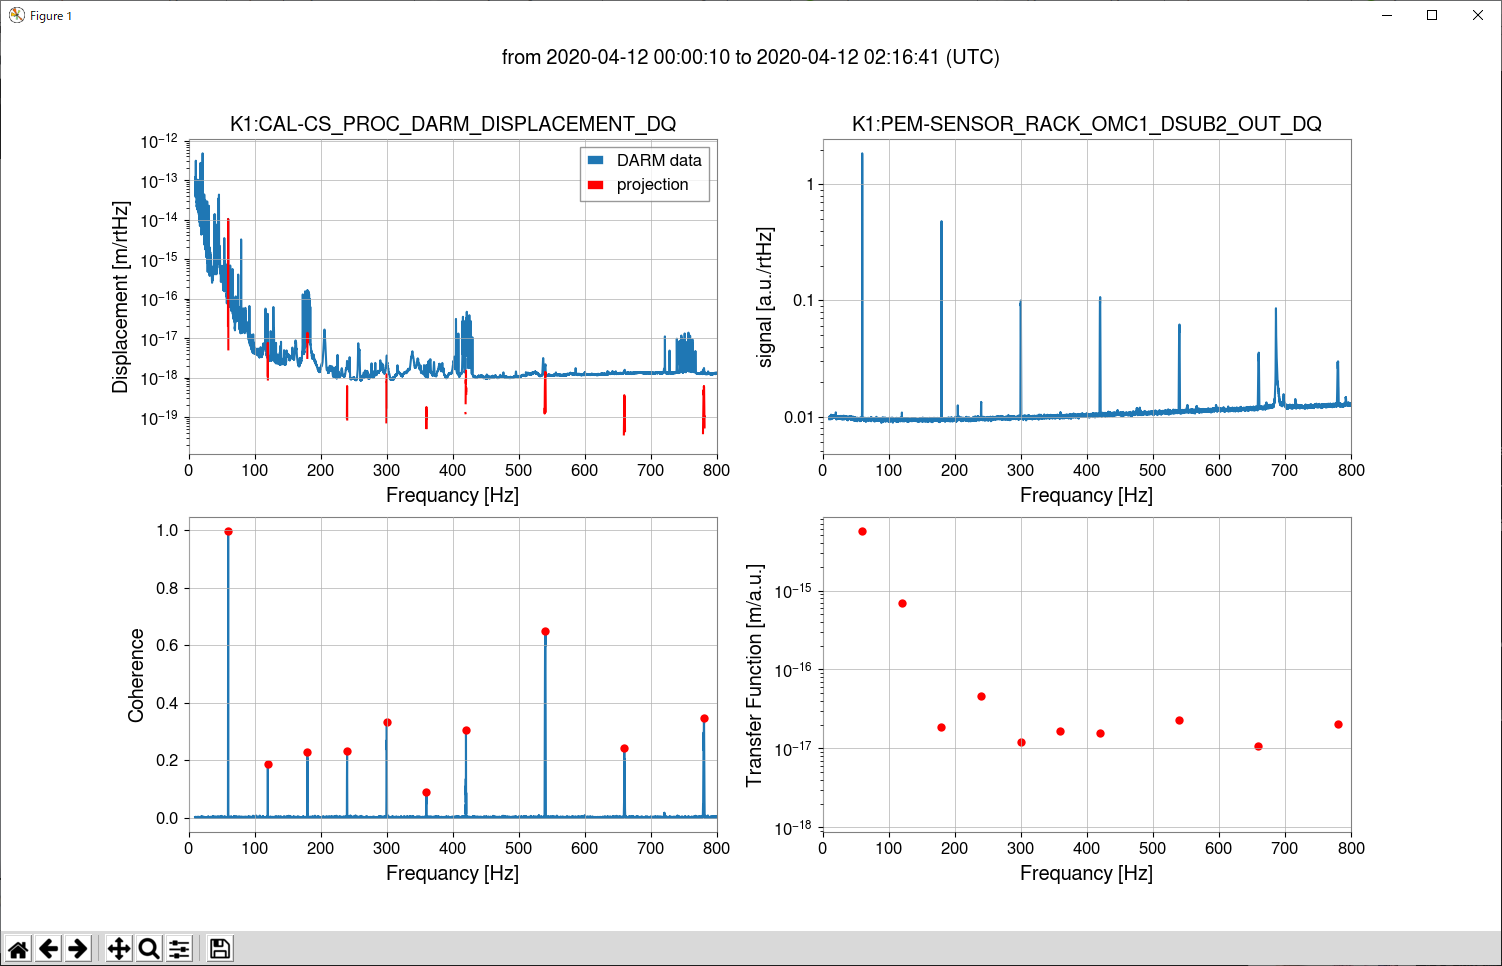
I start a study of caracterization for line noise in DARM, from 60Hz AC noise.
(I'm planning to apply this study for the 180 Hz violin modes, if this will work well)

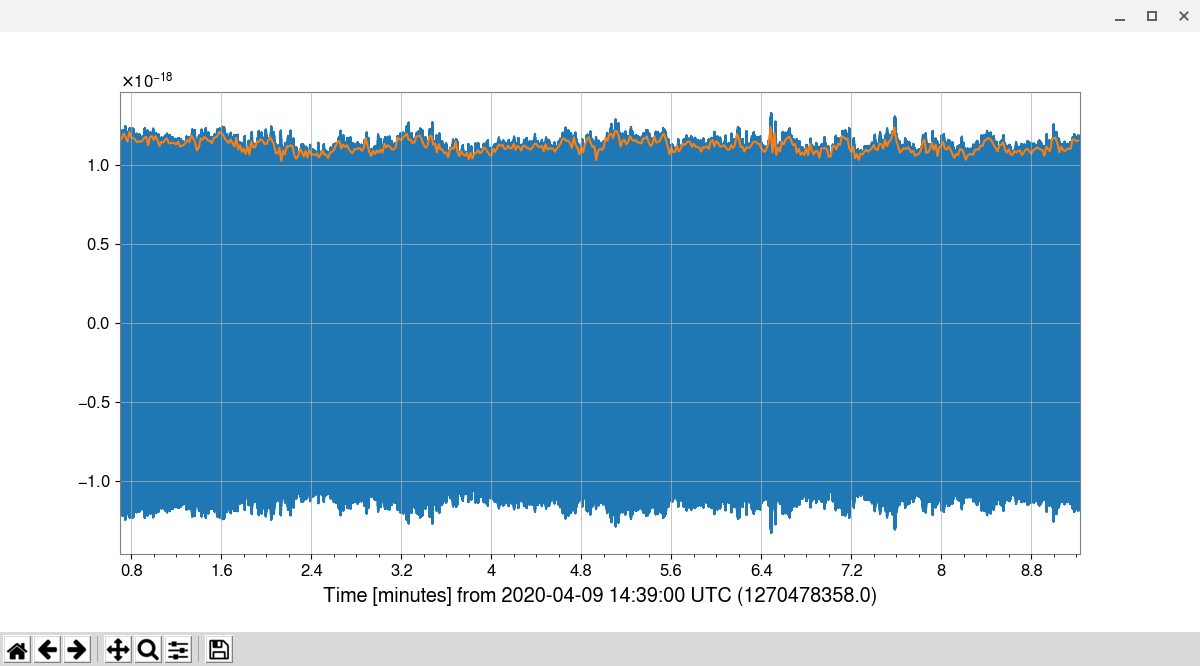
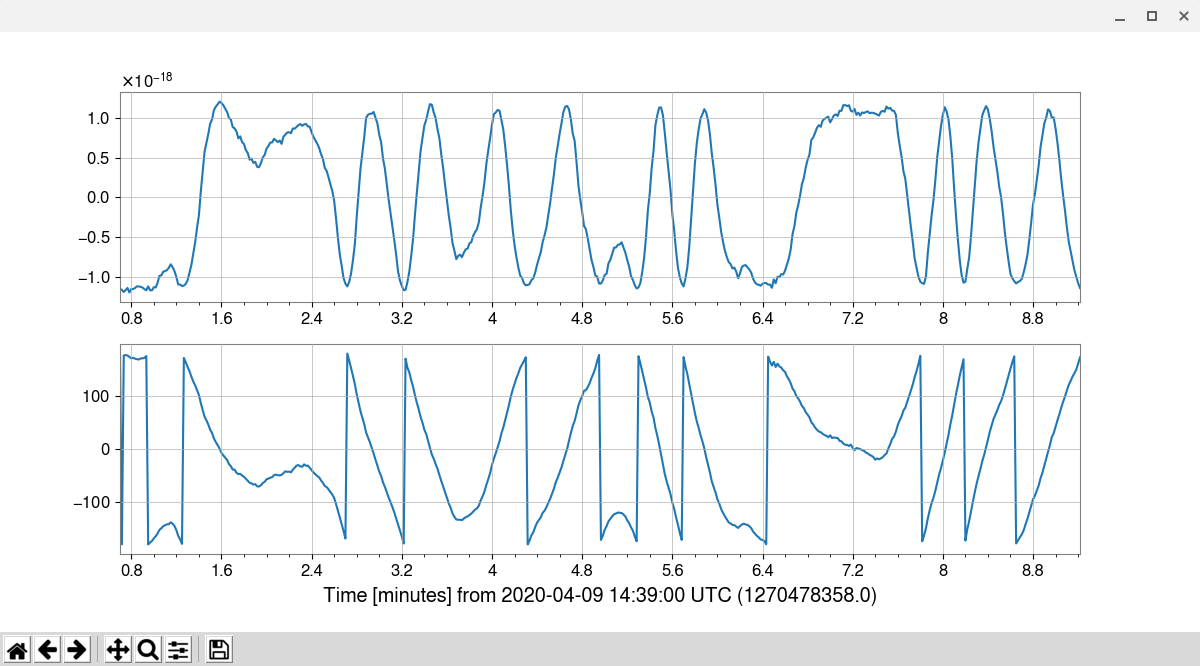
I generated a spectrogram and each ASDs for the longest segment on April 9.
From these plots, some dynamics of this line (these lines) can be seen.

Images attached to this report
Comments to this report:
tatsuki.washimi - 11:53 Saturday 11 April 2020 (14111) Print this report

Due to the fine structure, it is difficult to evaluate the peak value of the 60 Hz line.
So I evaluate the mean and sigma of the frequency weighted by the amplitude, instead.

In this plot, they are over plotted on the spectrogram as a graph and error bars. It looks working well.

The time series for mean f, sigma f, and very narrow band limited RMS are plotted here.

Images attached to this comment
tatsuki.washimi - 13:49 Sunday 12 April 2020 (14124) Print this report

I tried to subtract the 60 Hz power line from h(t), as a simple cosine function.
However it didn't work well, due to the modulation of this line.

In the 1st plot, the blue line is the band limited(59-61Hz) h(t) and the orange line is the magnitude of the demoduration with  60.0285Hz (mean frequency).
In the 2nd plot, the upper one is the demodulation h(t) and the bottom one is the phase of it.

The phase changes drastically, in less than 1 min scale.

Images attached to this comment
tatsuki.washimi - 13:55 Sunday 12 April 2020 (14125) Print this report

I checked the coherence between the DARM displacement and an unused ADC channel in the OMC1 rack. [plot]

Coh ~1 @ 60hz, ~0.2 @ 120Hz and 180Hz.

Images attached to this comment
tatsuki.washimi - 1:11 Tuesday 14 April 2020 (14138) Print this report

I tried to subtract the 60 Hz AC noise from h(t), by an unused ADC channel + bandpass filter (59.6 - 60.4 Hz) + time shift (-0.069 s) + scale (2e-18) .

Fig.1 top : ASDs for the strain (blue), subtruction (orange), and subtructed (green) signals.
Fig.1 bottom : coherence between the unused ADC channel and original (blue) / subtructed (green) strain.
Fig. 2 : 59-61 Hz band passed timeseries for  for the strain (blue), subtruction (orange), and subtructed (green) signals.

It looks working well.

Images attached to this comment
tomotada.akutsu - 2:19 Tuesday 14 April 2020 (14139) Print this report

It's nice!

tatsuki.washimi - 16:25 Wednesday 22 April 2020 (14275) Print this report

I applied the same analysis for the other days with the same parameters (scale=2e-18, time shift = 69ms).

This subtruction doesn't work well.

Images attached to this comment
tatsuki.washimi - 17:38 Sunday 02 August 2020 (14848) Print this report

Line noise estimation for AC 60Hz by coherence analysis

Images attached to this comment
Search Help
×

Warning

×