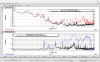
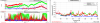
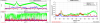
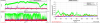
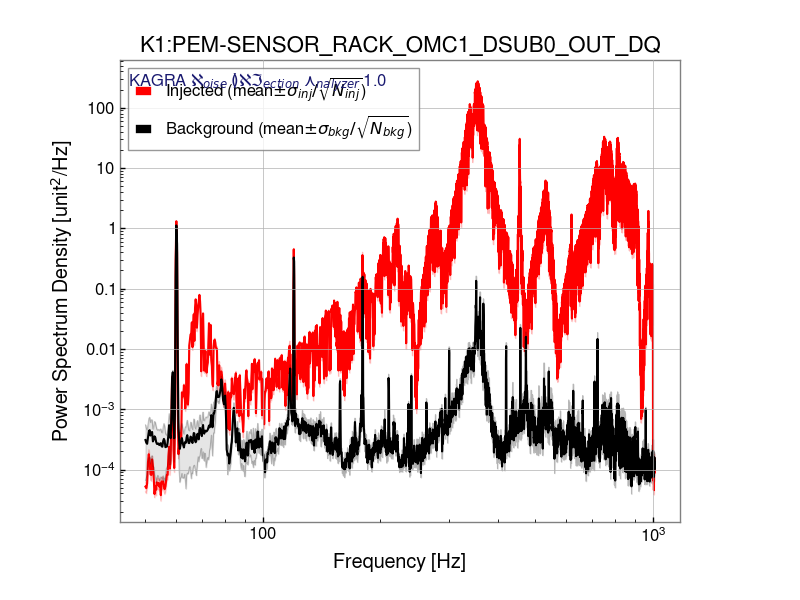
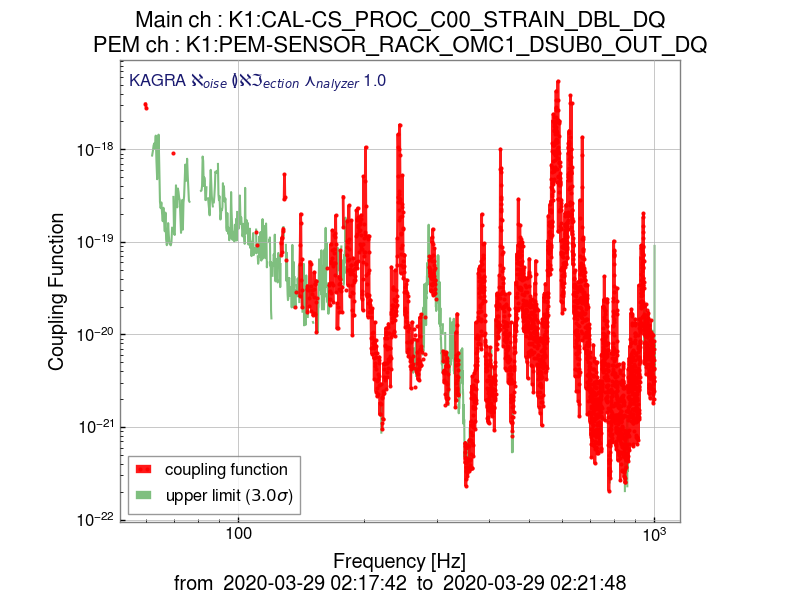
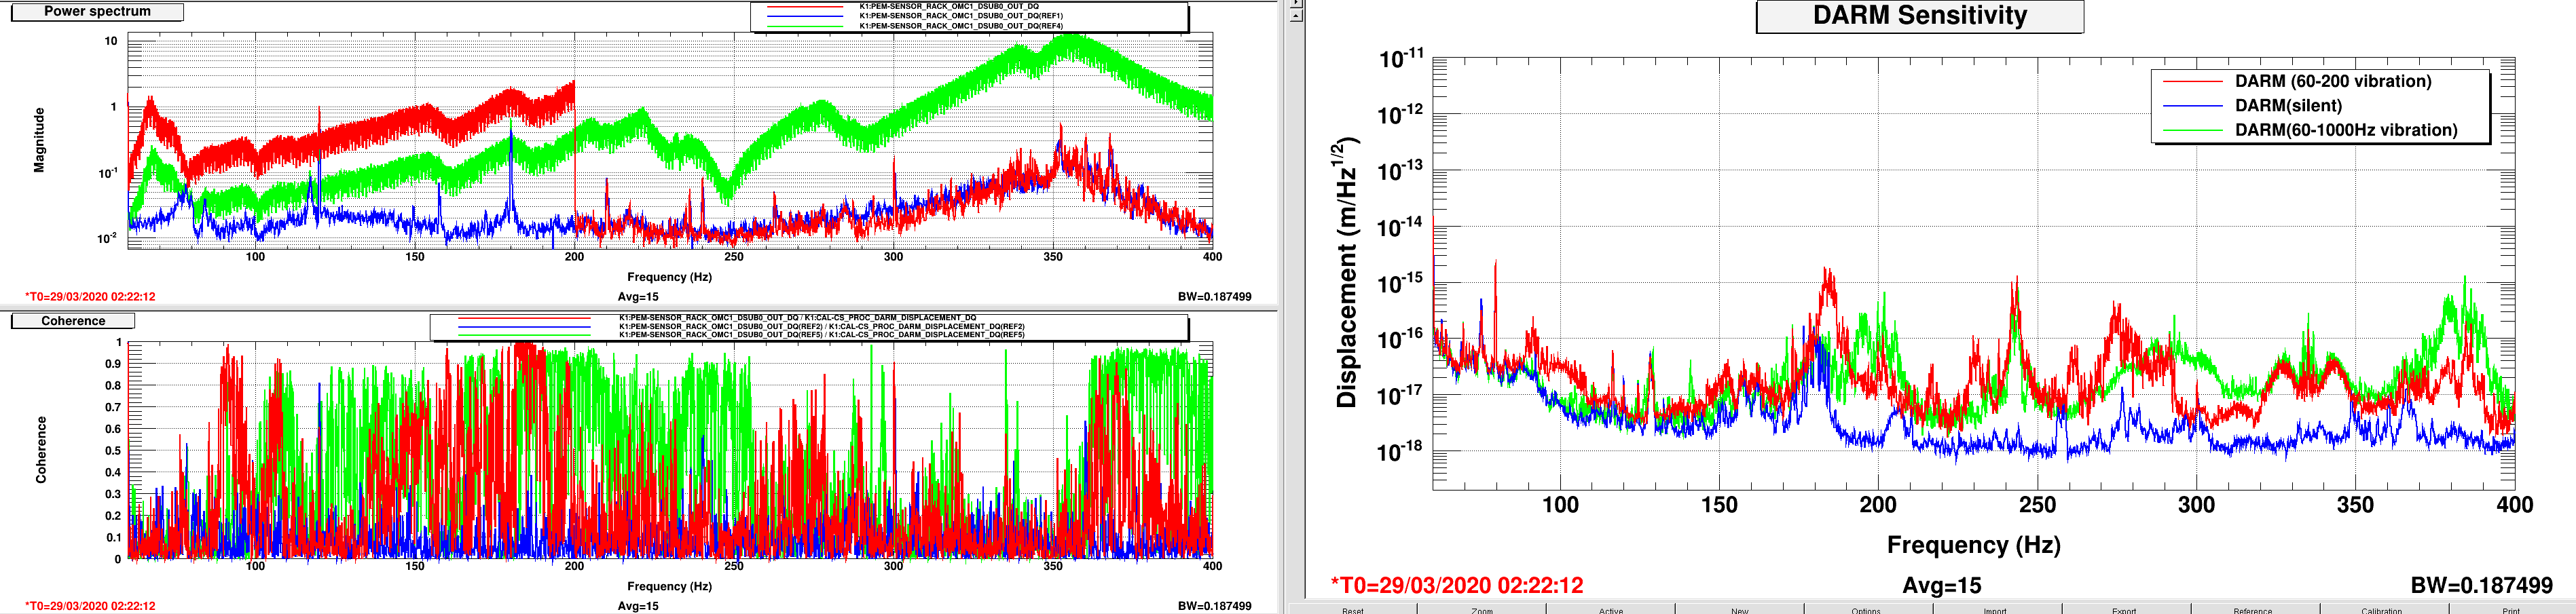
I performed the shaker injection on the OMC leg with my Bluetooth shaker.
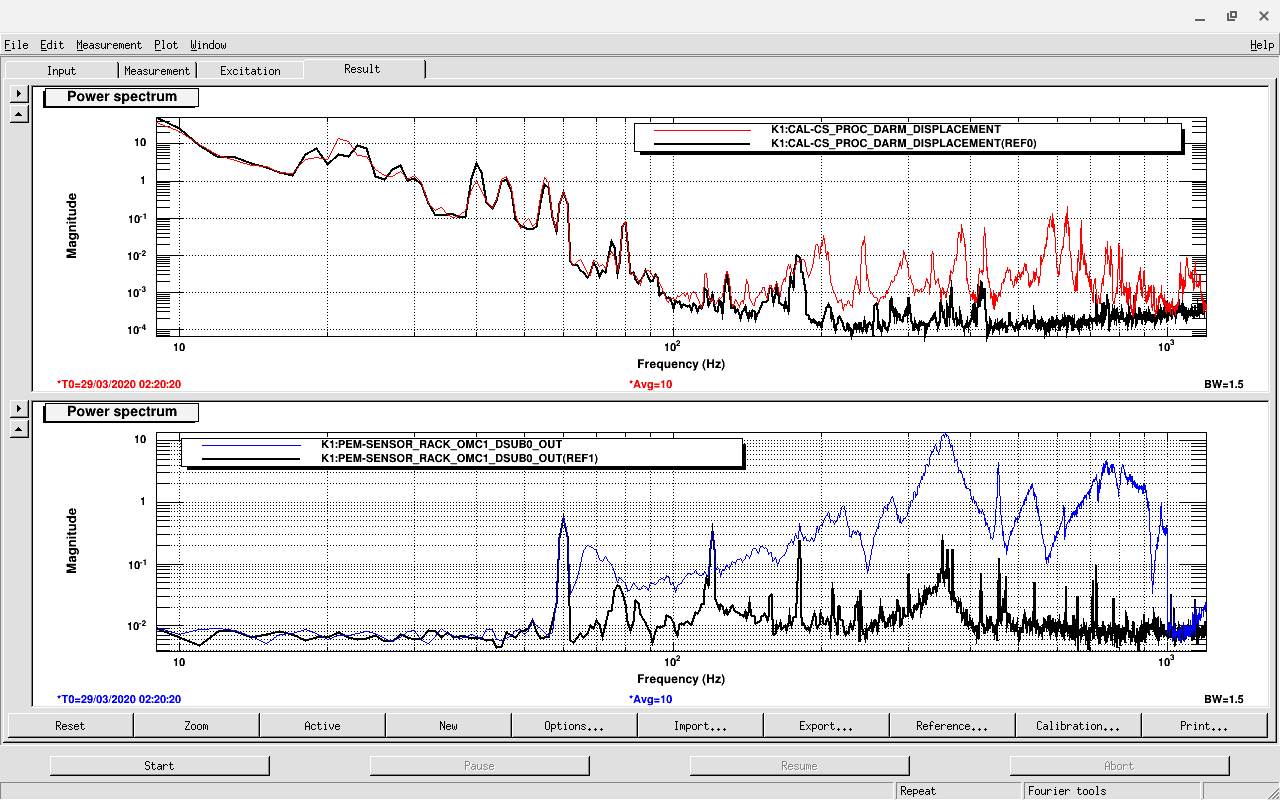
(1) 60-1000Hz white noise (diaggui) : start time is 2020-03-29 02:20:20 UTC
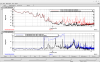
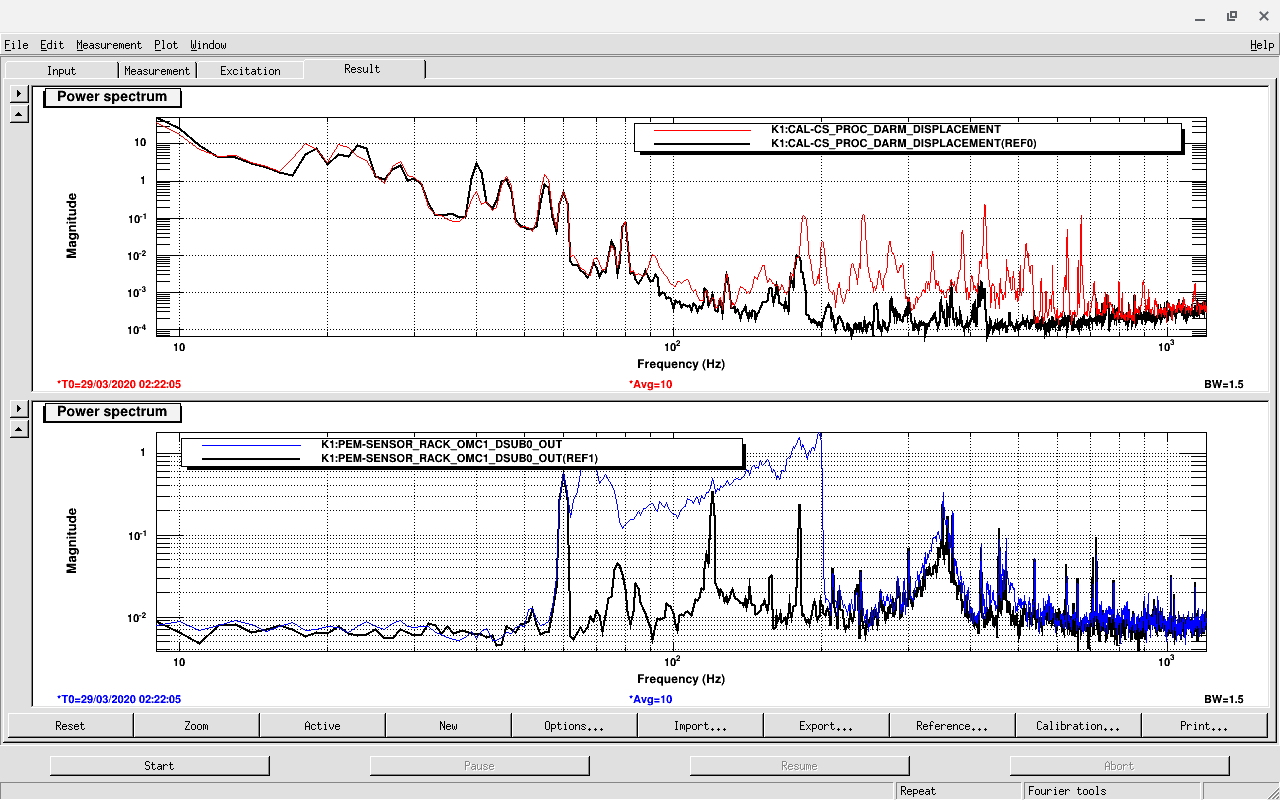
(2) 60-200Hz white noise (diaggui): start time is 2020-03-29 02:22:05 UTC
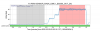
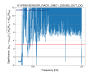
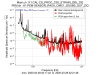
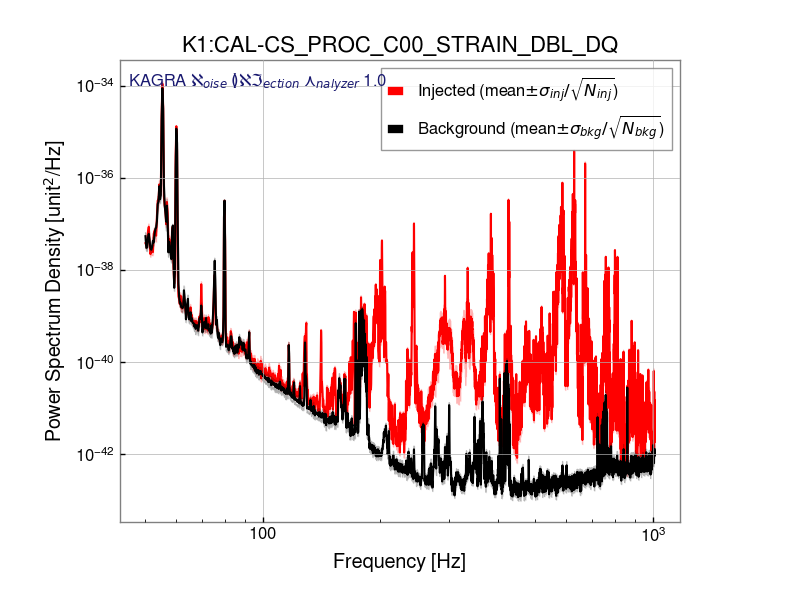
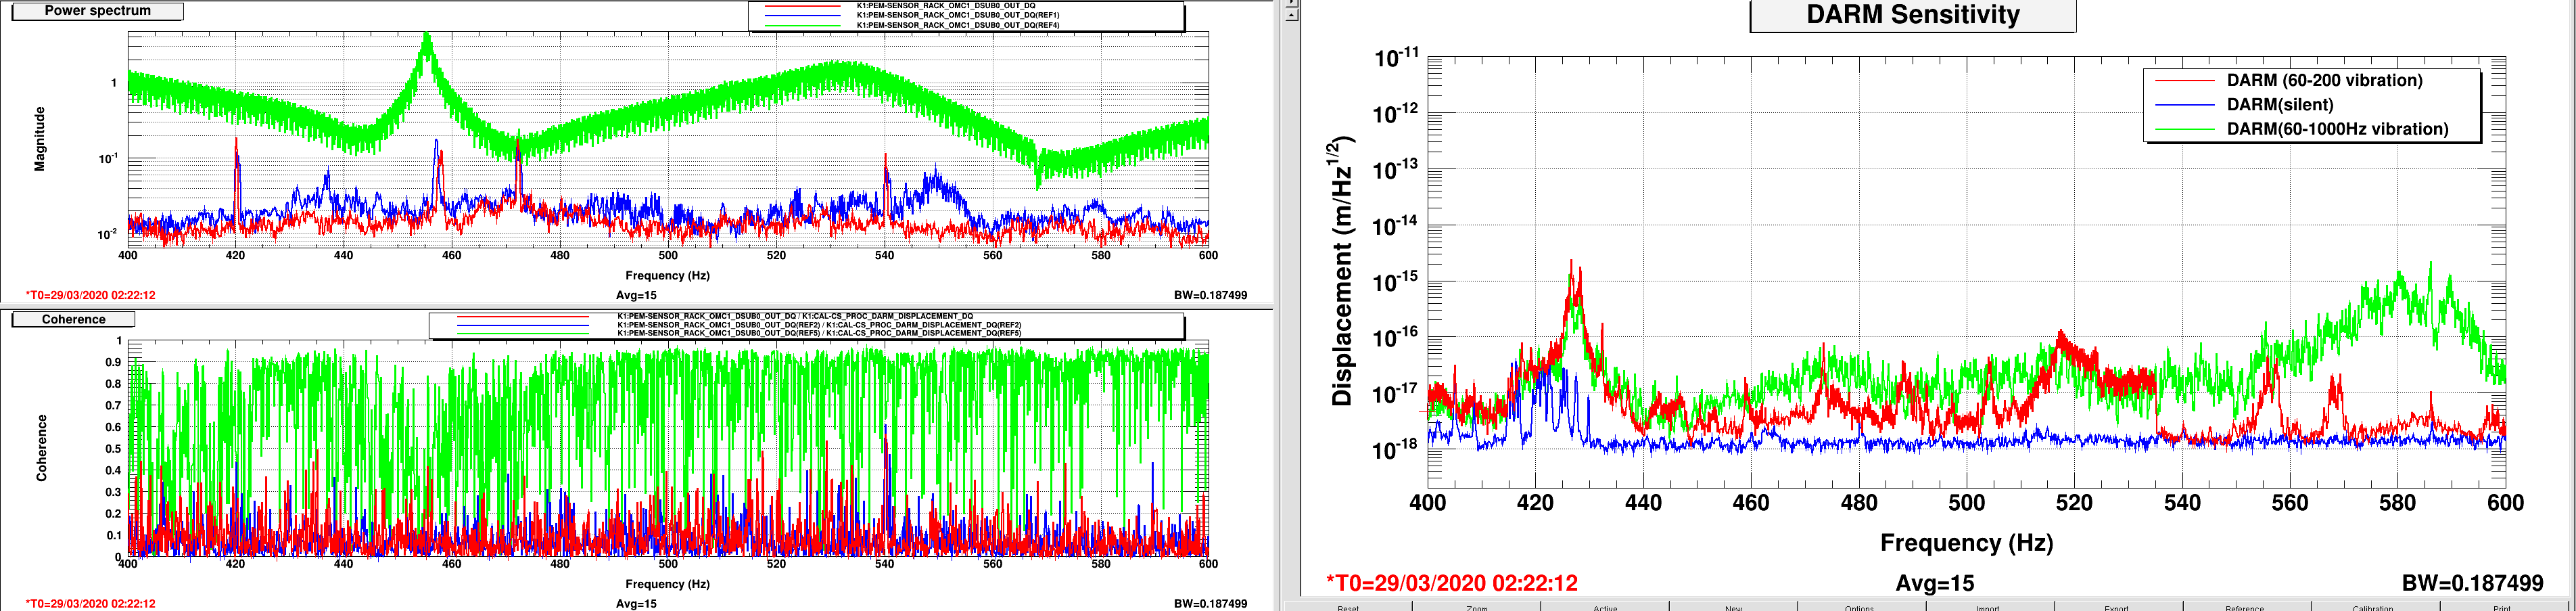
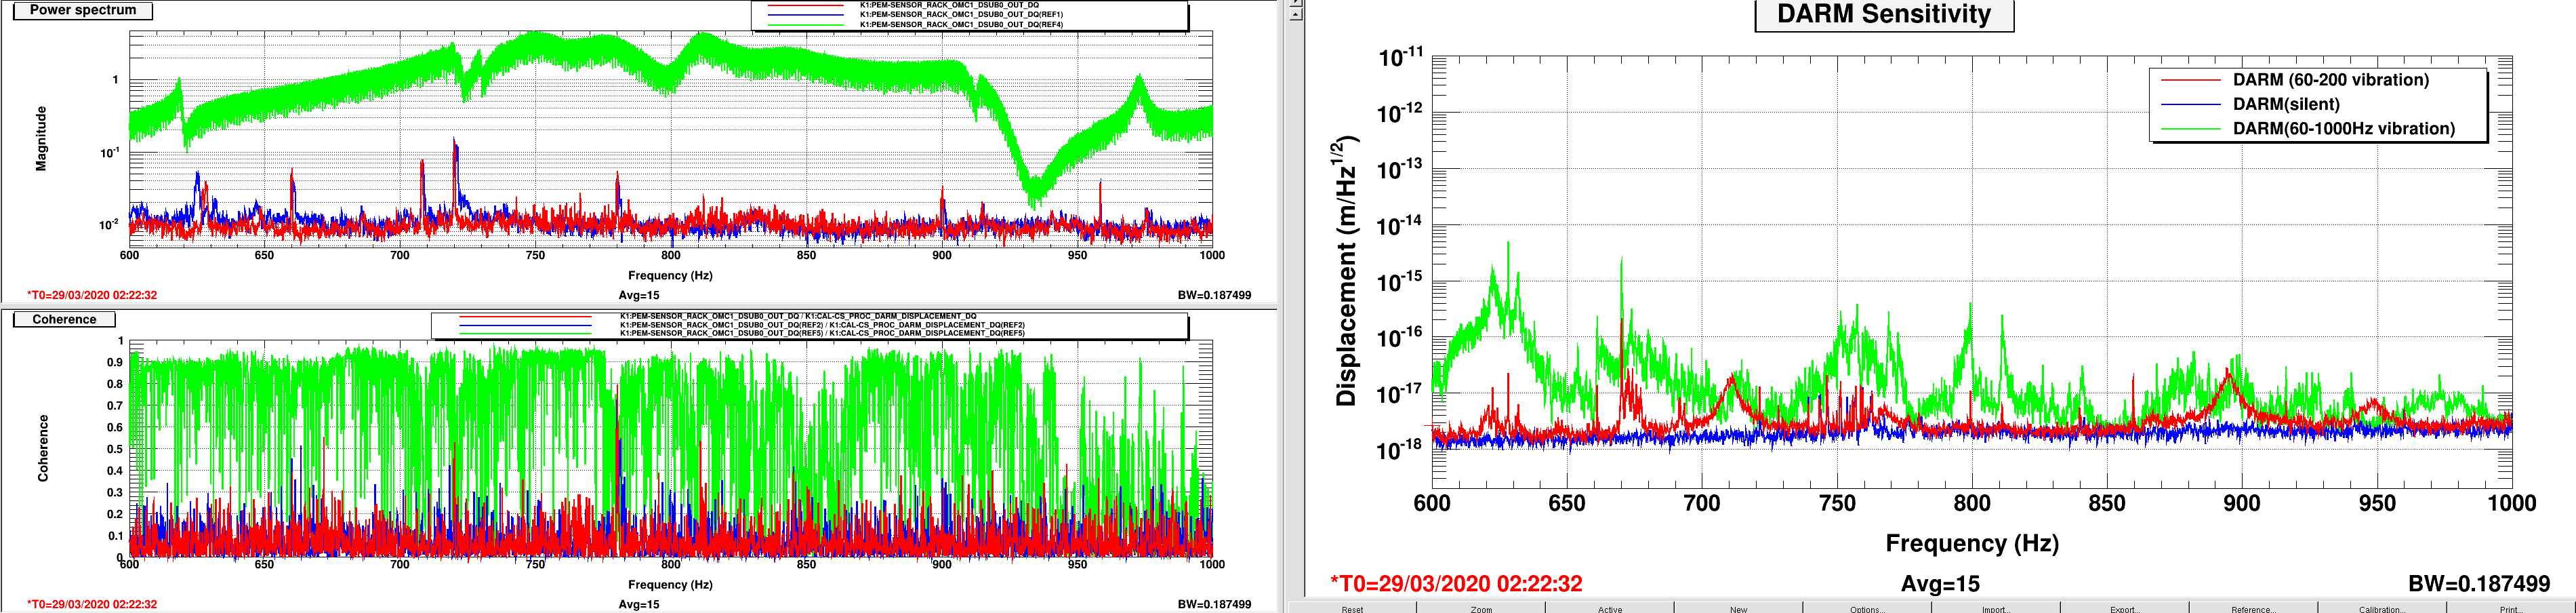
In the second data, we can see many upconversion peaks in DARK, although the accelerometer signal is well cut off at 200Hz.
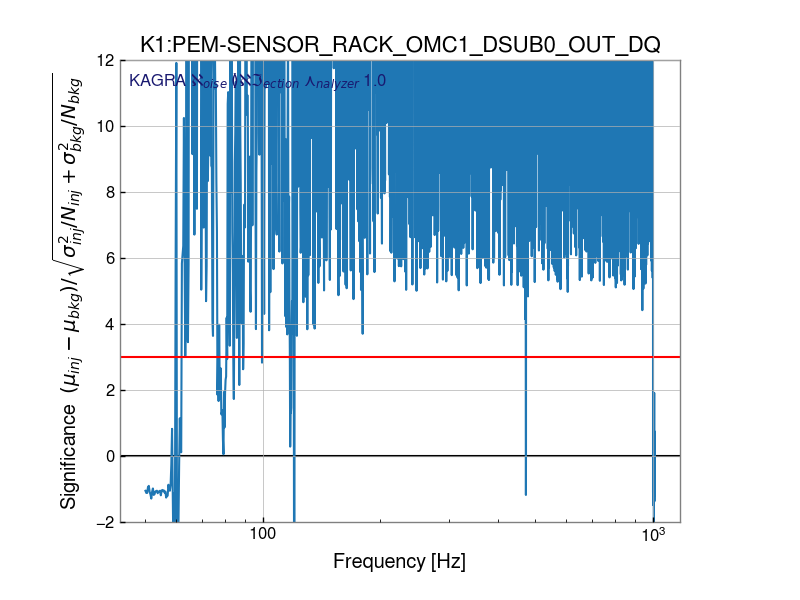
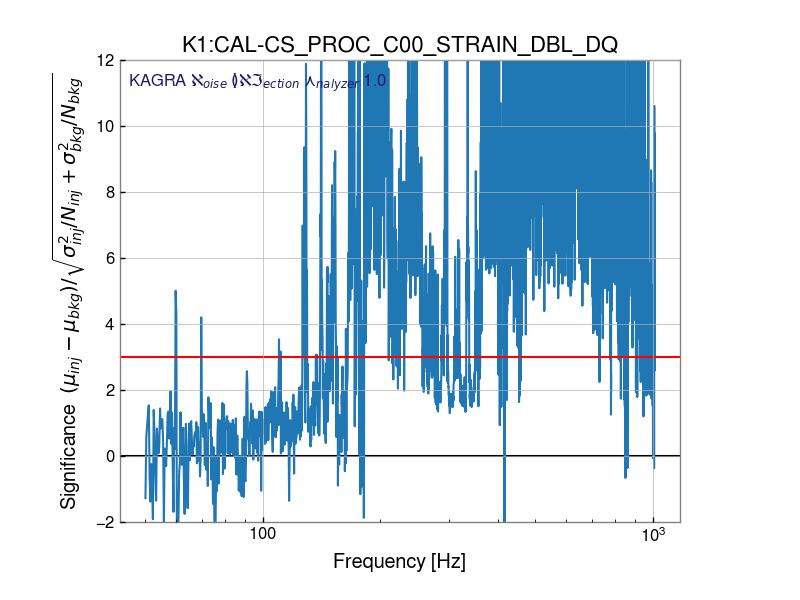
The peak frequencies (in Hz, less than 1kHz) are below :
184,
201, 231, 243, 262 274,
335, 385,
426, 473,
504, 518, 532, 556, 569, 586,
622, 628, 661, 670,
712, 744, 746, 751, 759, 767, 778, 799,
811, 895,
916, 919, 945, 948, 953,
The structure of the DARM spectrum is not similar between shaking and no-shaking data.
So I guess the current vibration of the OMC leg is not a problem.


