Reports 1-1 of 1 Clear search Modify search
PEM (General)
tatsuki.washimi - 15:32 Wednesday 25 March 2020 (13813) Print this report
Summary of Earthquake events (2020-2-10 ~ 2020-3-9)

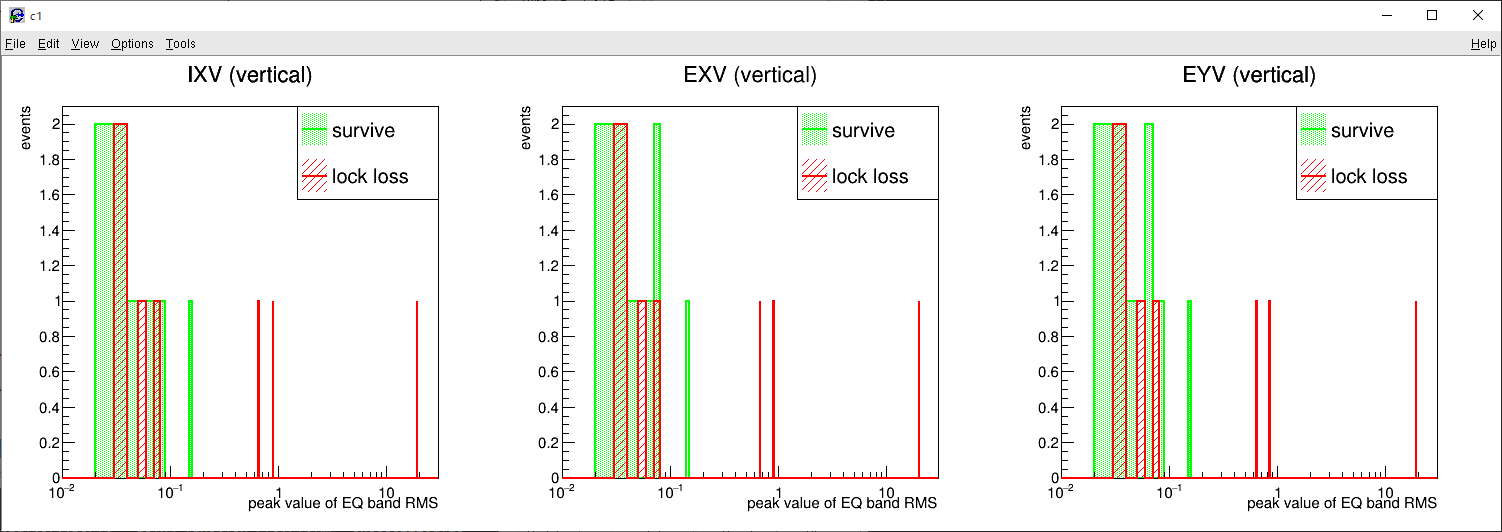
I summarized the Earthquake events during 2020-2-10 ~ 2020-3-9.
https://gwdoc.icrr.u-tokyo.ac.jp/cgi-bin/private/DocDB/ShowDocument?docid=11568

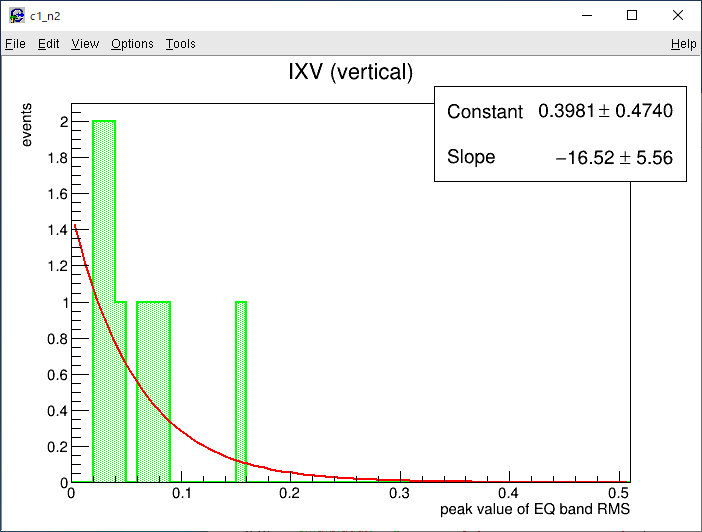
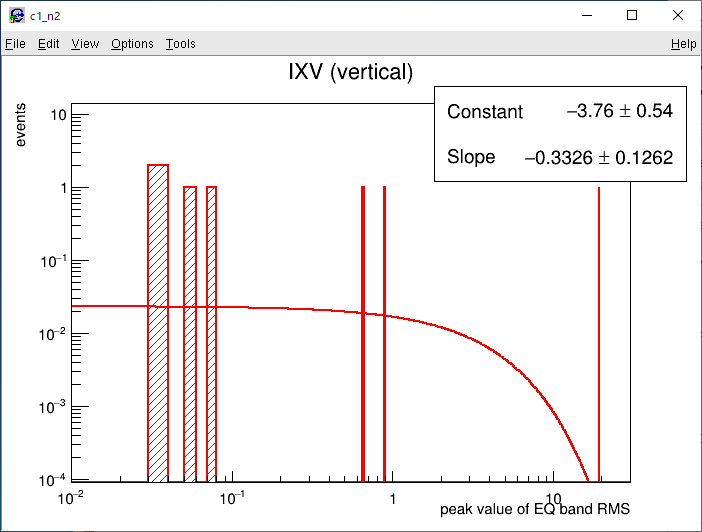
Due to the instability of the IFO itself, it is not so easy to evaluate the effects of earthquakes.


Lock loss (due ti eqrthquake?)

1265539246
1265625796
1265697042
1266615258
1266963042
1267145508
1267783272


Survive

1265364965
1265483866
1266920984
1267263512
1267294937
1267361606
1267617350
1267624651
1267631834

Comments to this report:
tatsuki.washimi - 11:07 Thursday 26 March 2020 (13827) Print this report

I compared the histograms of peak value of Earthquake band RMS between lock-loss events and survived events. (plot1)
It looks difficult to define a clear threshold to distinguish them.

I fitted the histograms (IXV) with a exponential function (binned likely method). (plot2, plot3)
If we assume that the probability distribution function is  P(x) = λ-1 * exp(-x/λ), the parameter λ is 3 (for lock-loss) and 0.06 (for survived).
So we can calicurate the value for

  • Ploss / Psurvive = 1     ->  x = 0.23
  • Ploss / Psurvive = 0.1  ->  x = 0.097
  • Ploss / Psurvive = 10   ->  x = 0.37


Images attached to this comment
tatsuki.washimi - 15:22 Thursday 26 March 2020 (13837) Print this report

So I recomend to set the threshold as

  • yellow zone : between 0.03-0.1 
  • red zone : over 0.1

for eacn (IXV, EXV, EYV) seismometers' 30-100Mz band RMS (Z-axis)

Search Help
×

Warning

×