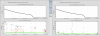
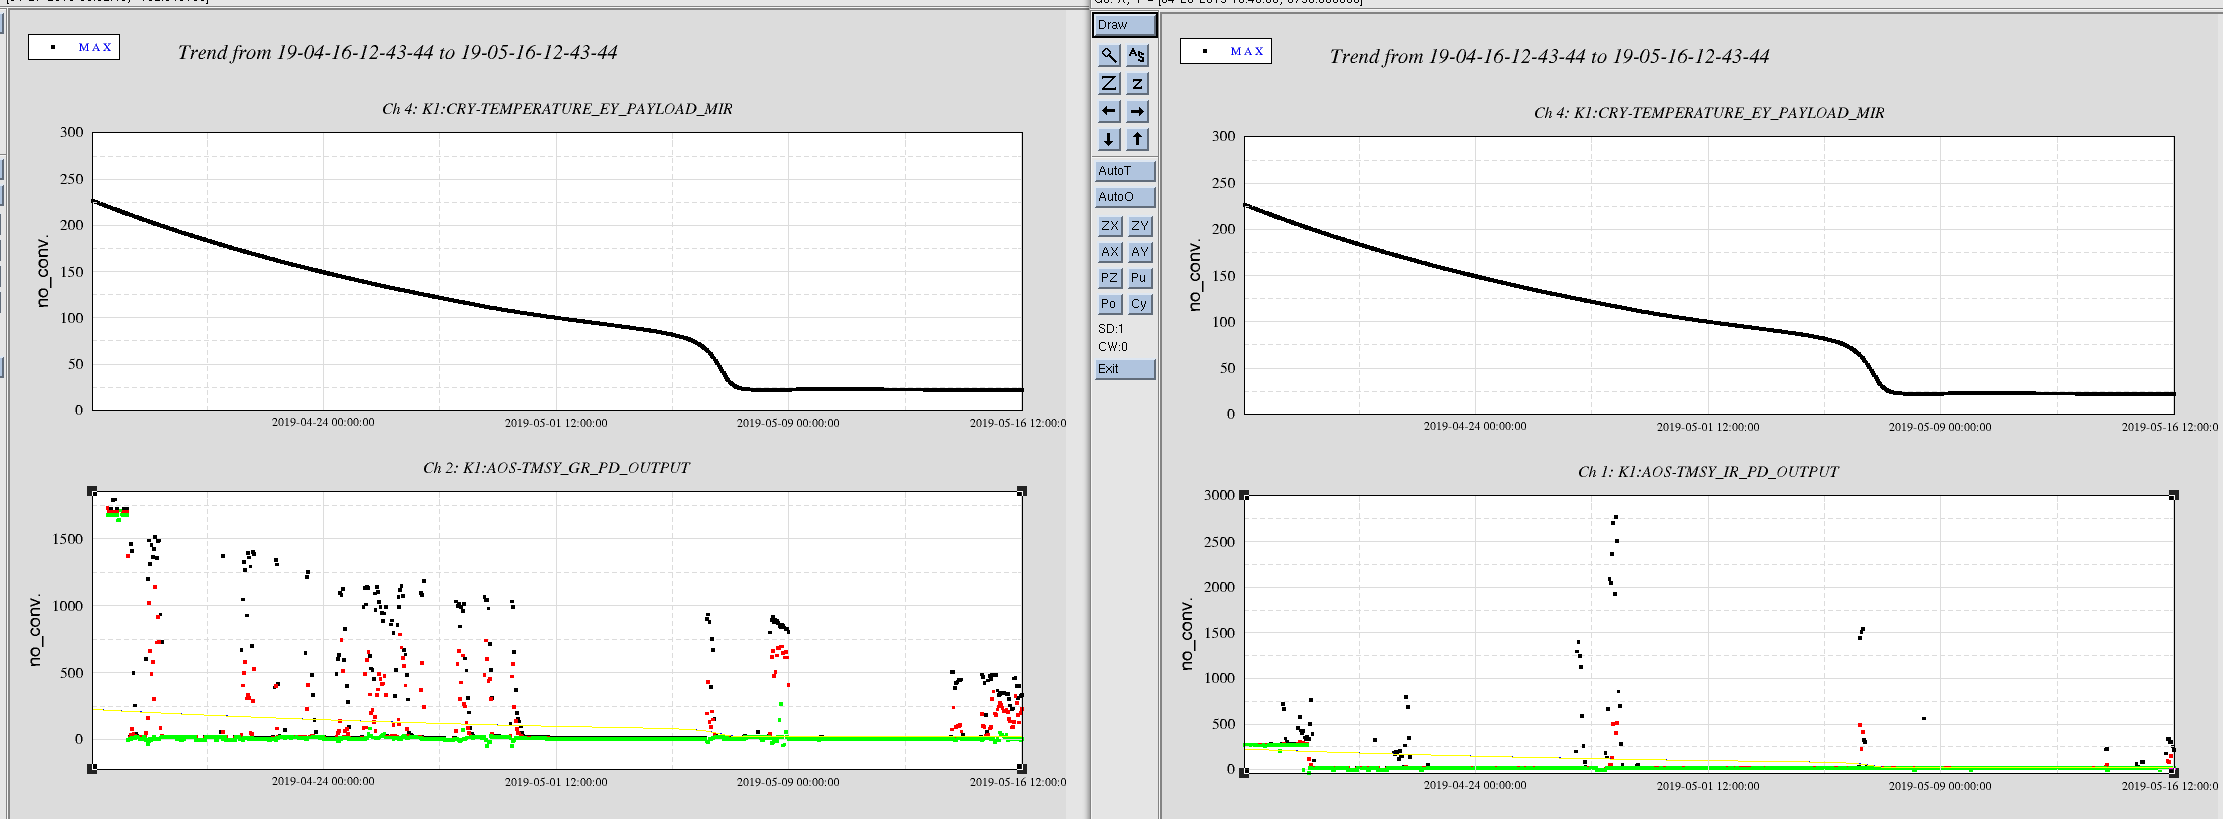
Attached plot is long term trend of the IR (right) and GR (left) transmitted power with the the temperature of ETMY (upper). The transmitted IR power was around 3000 and the GR power was 1500 about one month ago, and seems to get smaller with the ETMY temperature.
Mmm, does it indicate anything?