Summary
Gouy phase separation between WFS1 and WFS2 was measured => The gouy phase telescope part was reconstructed => Sensing matrix was measured.
Gouy phase separation measurement
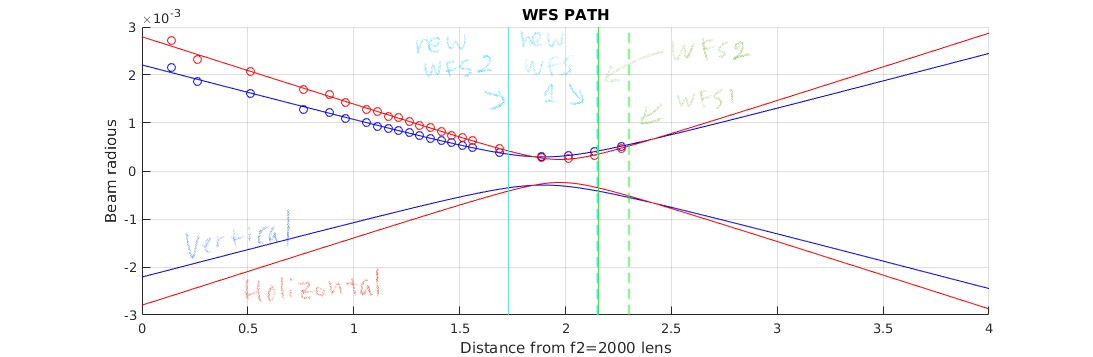
From the last Tanioka-kun's mesurement, I assumed the gouy phase separation must have been not enogh (also it is pointed out when the commissoning workshop last year - and I completely forgot). To confirm this, the beam profile of the IMC_ASC path was measured. See, the attachement. Actually, this was the first measurement after the PMC was installed upstearm.
Fitted parameters
- beam waist holizontal 293um radius
- beam waist vertical 240um radius
- beam position from the lens (f=2000), holizontal -1.89m
- beam position from the lens (f=2000), vertical -1.98m
Measurement and fitting methods
- beam profiler wincam D was used
- used the matlab tool for the mode matching "a la mode"
- data and script /users/kokeyama/alam/myfit/fit_mcwfsB_20181130.m
- the position reference z=0 is at L2 (lens with f=2000)
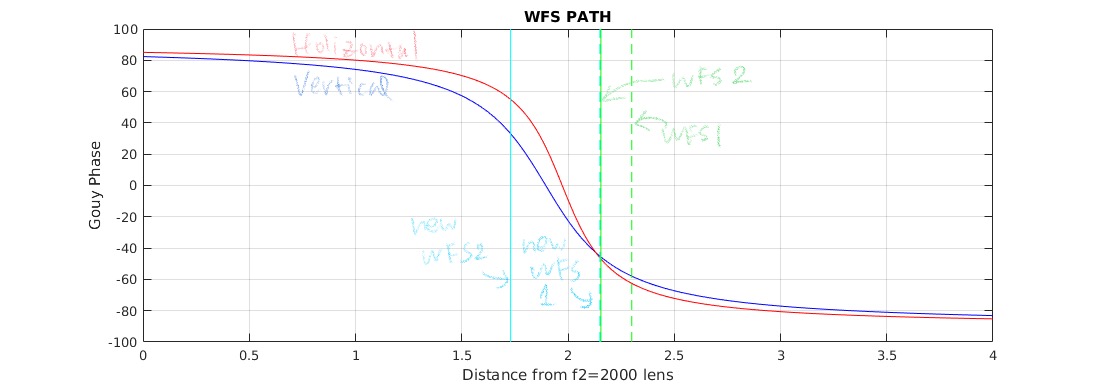
From the result, and with the WFS positions at this time 2.3m (WFS1) and 2.16m (WFS2) from the lens L2, the gouy phase separation between the two WFSs are resulted in only 11 deg (holizontal) and 9.7 degrees (vertical) which are waaay too small!
Note that, compared with the old measurement (before the PMC was installed), the holizontal waist size didn't change much but the vertical waist size changed more than 50&. So the elipticity got better, but somehow it's till eliptic (the holizontal is longer than the verticall).
Guouy Phase telescope reconstruction
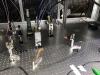
It was done so that gouy phase separation between WFS1 and WFS2 is 90 degrees. I decided to put WFS1 and 2 are at z = 2.15m and 1.73m, respectively. The new positions are also shown in the above plots in cyan color. The new layout (not very precise) is shown below. The table photo is also attached.

Sensing matrix measurement
The below tables are the measured sensing matrices with the new telescope. Each measurement was done manually with DC offsets was applied on the suspension TEST filters (3000cts for P, 200cts for Y), or the PZT offsets epics values (a few counts), while the DC centering loops on the WFSs were closed.
PIT
| MCE | MCI+MCO | MCI-MCO | PZT1 | PZT2 | |
| MCE T QPD2 | 0.0824 | -0.1047 | 0.0072 | 0.0008 | 0.0005 |
| WFS1 Q | -31.6 | 12.0 | -13.6 | 14.1 | 17.6 |
| WFS2 I | 259 | -76.6 | -91.3 | 229 | 198 |
YAW
| MCE | MCI+MCO | MCI-MCO | PZT1 | PZT2 | |
| MCE T QPD2 | -0.0976 | -0.0025 | -0.0024 | 0.0038 | -0.0044 |
| WFS1 I | 49 | -20.0 | -66.0 | -15.2 | 22.4 |
| WFS2 I | -134 | 52 | -116 | -128 | 111 |
Next Steps
Decide the input matrix and close the loops.