I have released a web app to plot the modeled suspension response: VIS Plotter.
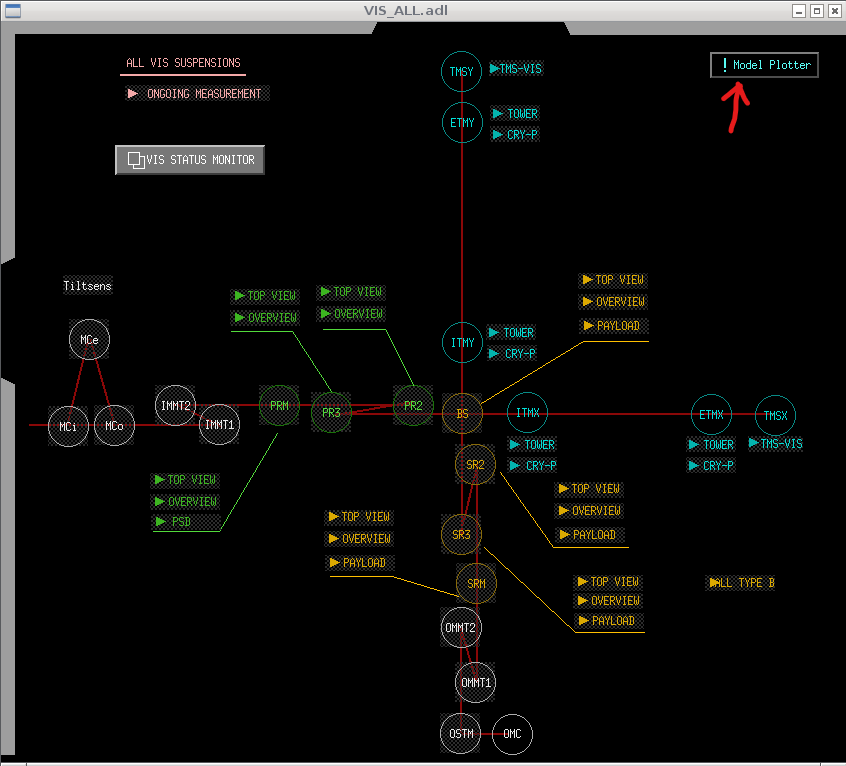
You can visit the app from the top left buttom of VIS overview medm screen:
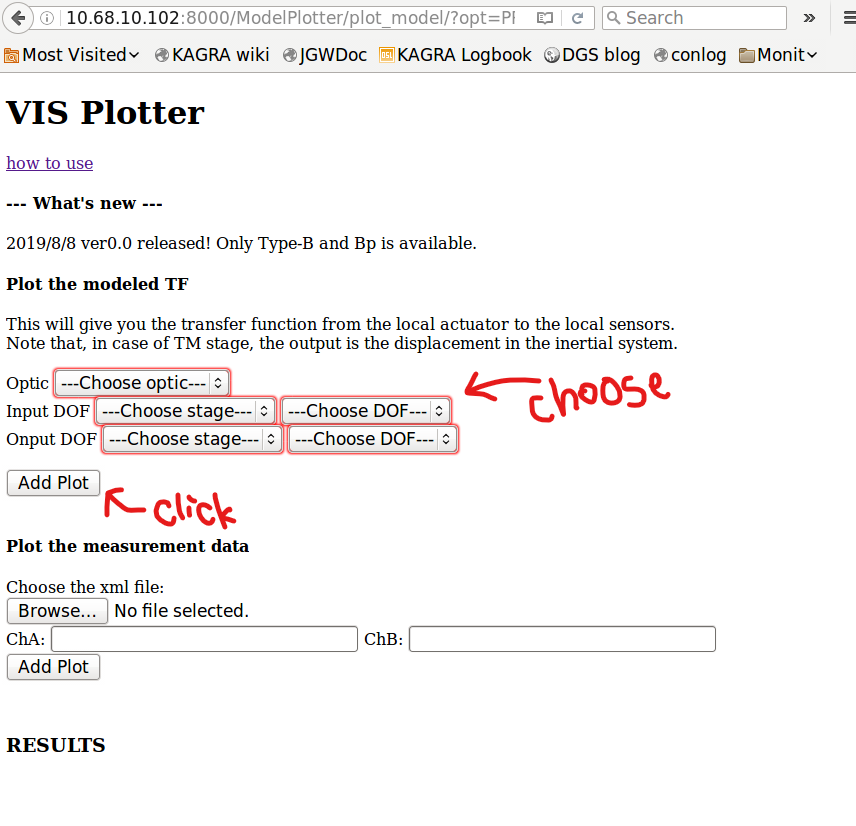
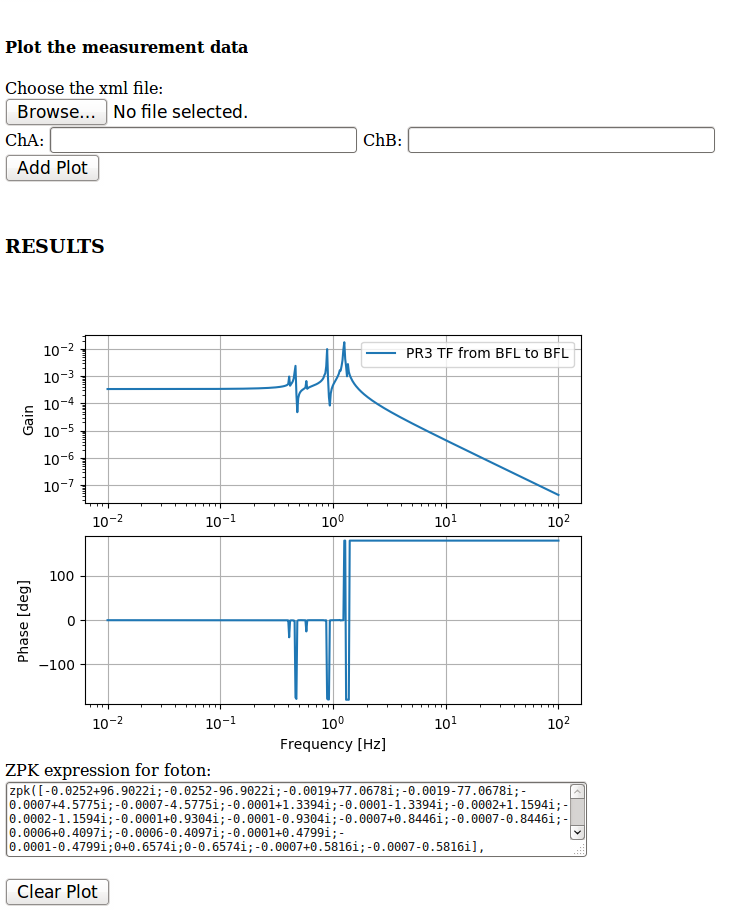
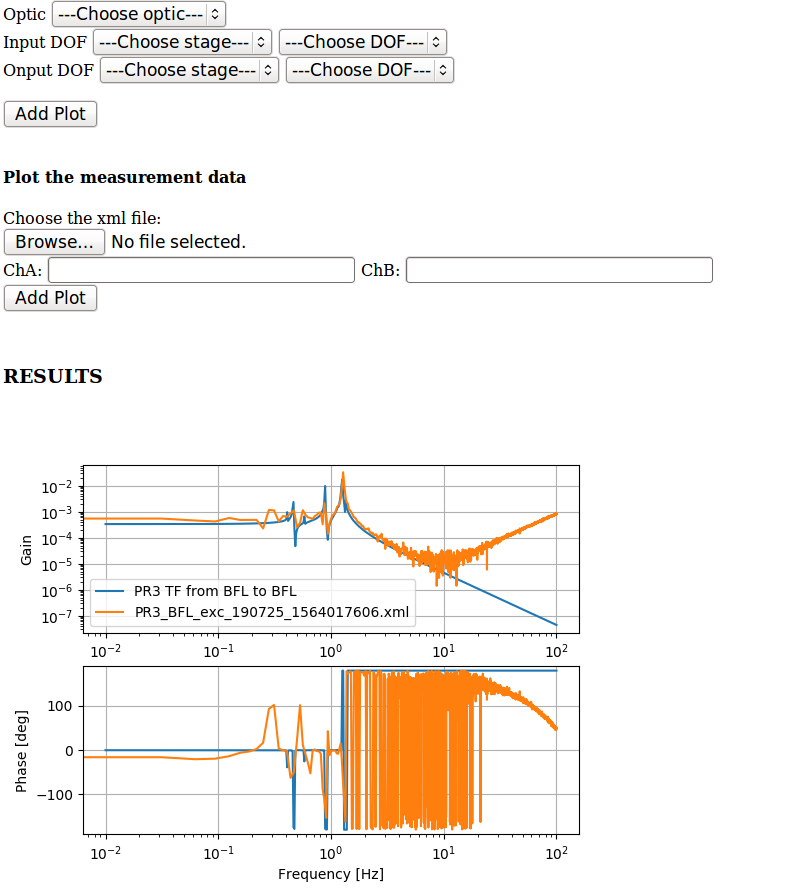
You can plot the transfer function of what you choose from the pulldown. Then clock 'Add Plot' bottun. Then the transfer function appears at the bottom of the page.
You can plot the multiple transfer functions in the one figure. If you want to clear the figure, click 'Clear Plot' bottun.
Also, the zpk expression of the transfer function will appear below the figure. You can directly copy and paste it to foton. Then it would be easier to estimate OLTF while you are wothe control design.
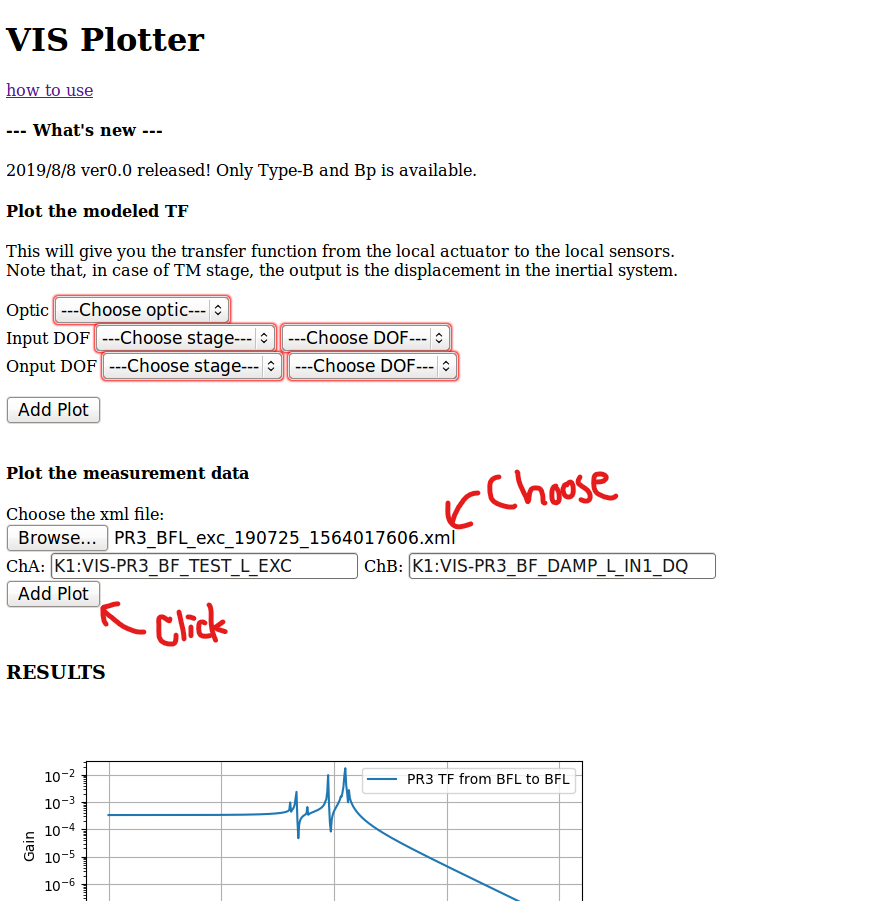
Also, you can plot the measured transfer function on the same figure.
Currently, this works only for Type-B and -Bp!! Type-A model will be added soon. Stay tuned.
And the link to the wiki page is now under construction. Sorry for the inconvenience.
I hope this will help the comissioning and VIS works.
If you find any bugs or whatever, please ask Shoda.


