Miyo
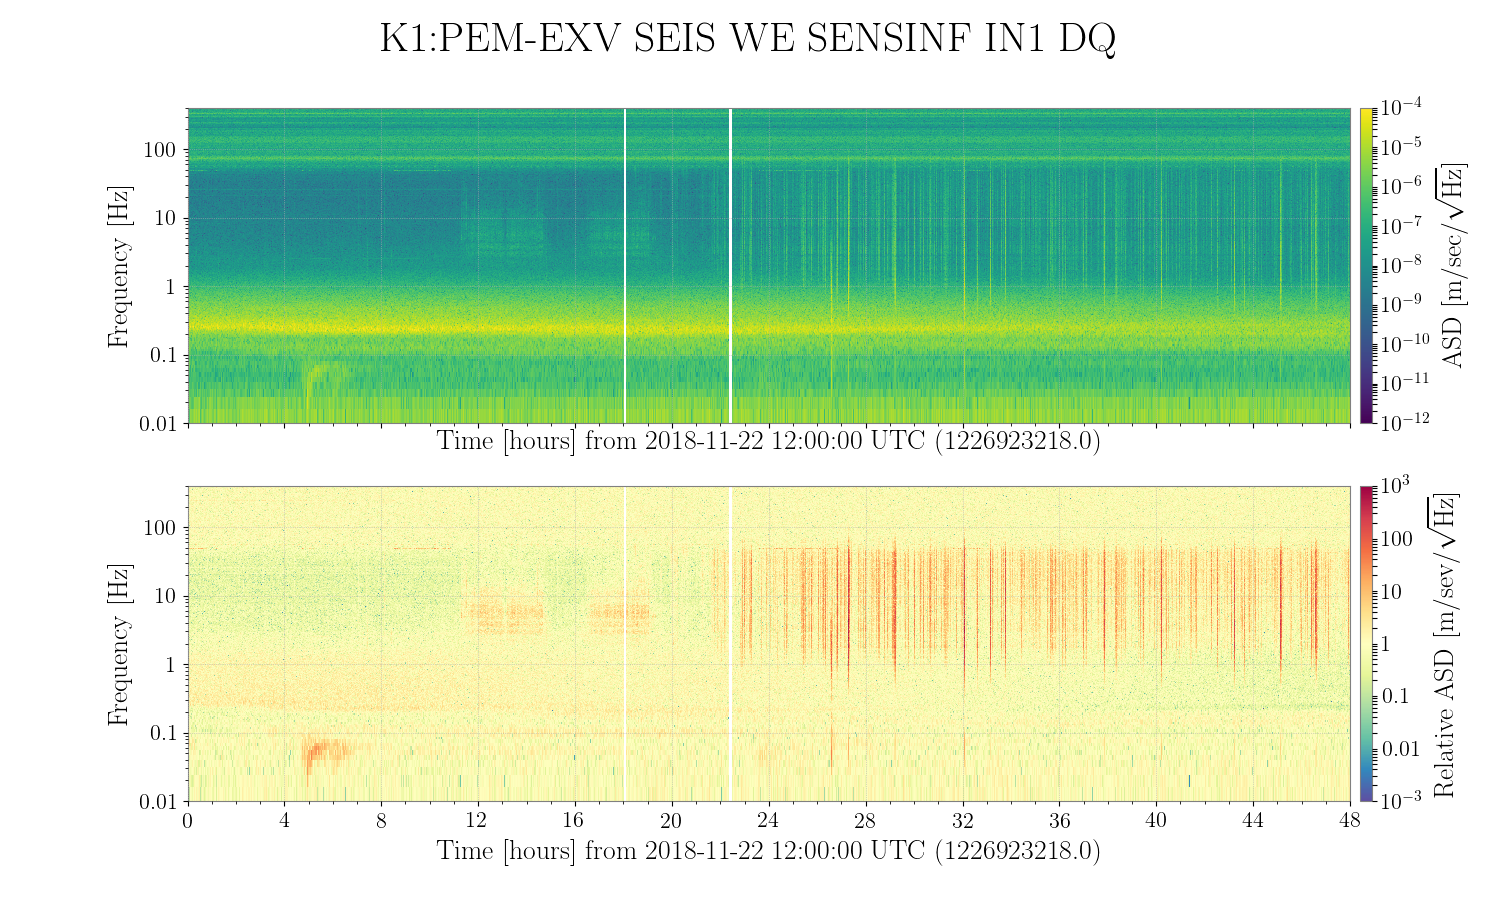
Spectrogram of K1:PEM-EXV_SEIS_WE_SENSINF_IN1_DQ, which is a signal of the IXV seismometer with the x-axis is shown in bellow.
The upper graph is normal spectrogram, the lower one shows relative amplitude to the median. see https://gwpy.github.io/docs/latest/examples/spectrogram/ratio.html for more detail.
From yesterday around 22 o'clock, quiet region 1-40Hz getting noisy.
According to yesterday's epicenter list, many earthquakes have continued since 18 o'clock JST (9 o'clock UTC).

