Akutsu, Shoda, Tanioka
Today, we measured the spectra both LVDTs and Geophones.
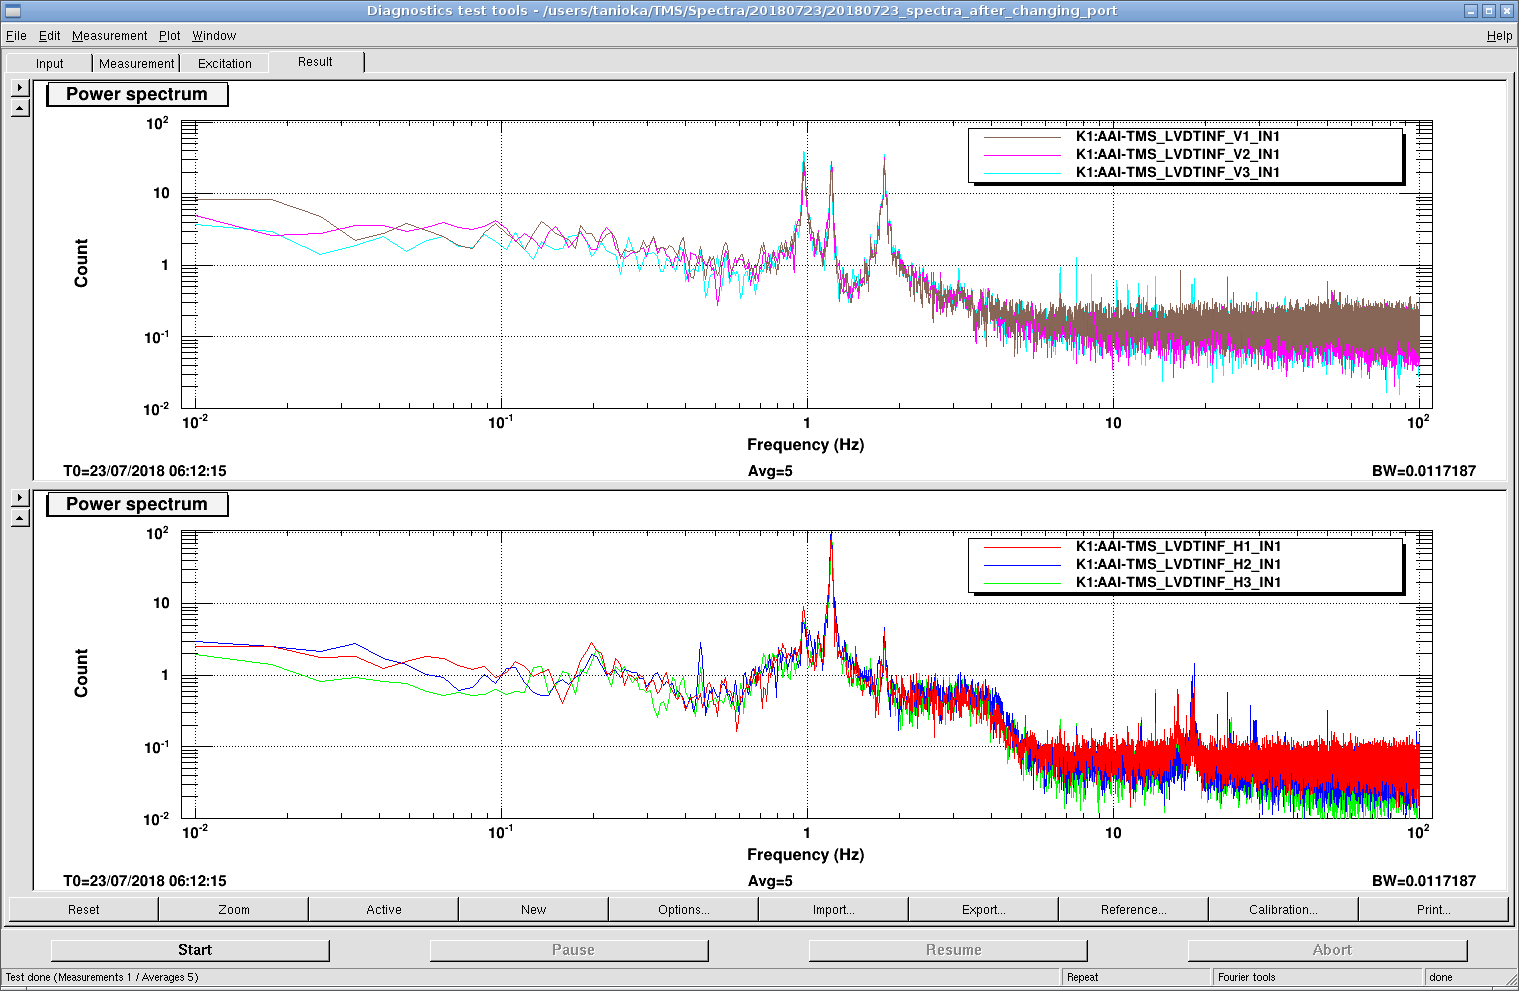
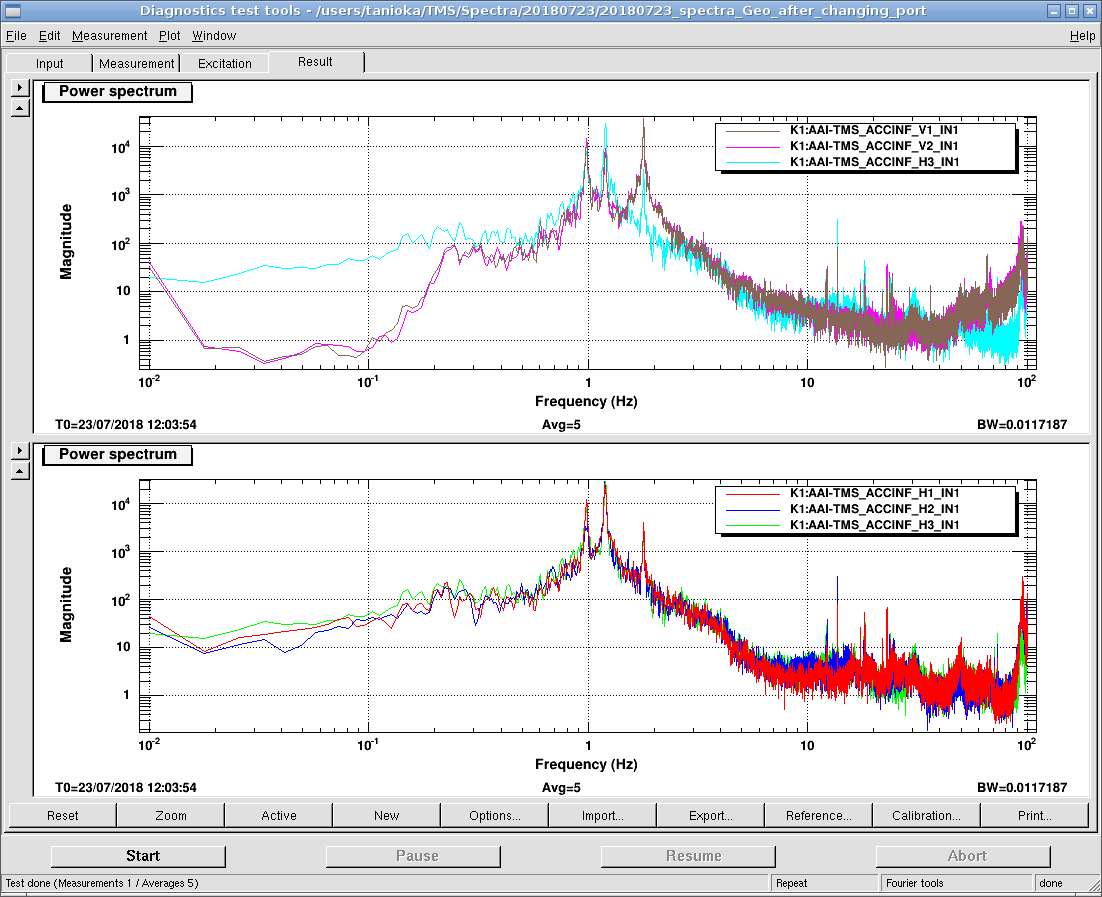
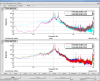
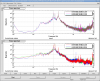
Left figure shows spectra of LVDTs and right one shows that of Geophones.
In both figure, upper graphs show the vertical and the lower one is horizontal.
We can see 3 peaks around 0.98 Hz, 1.3 Hz and 1.8 Hz.
0.98 Hz and 1.8 Hz peaks seemed coupled to horizontal spectra.
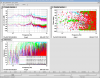
Then we measured TFs to identify the peaks.
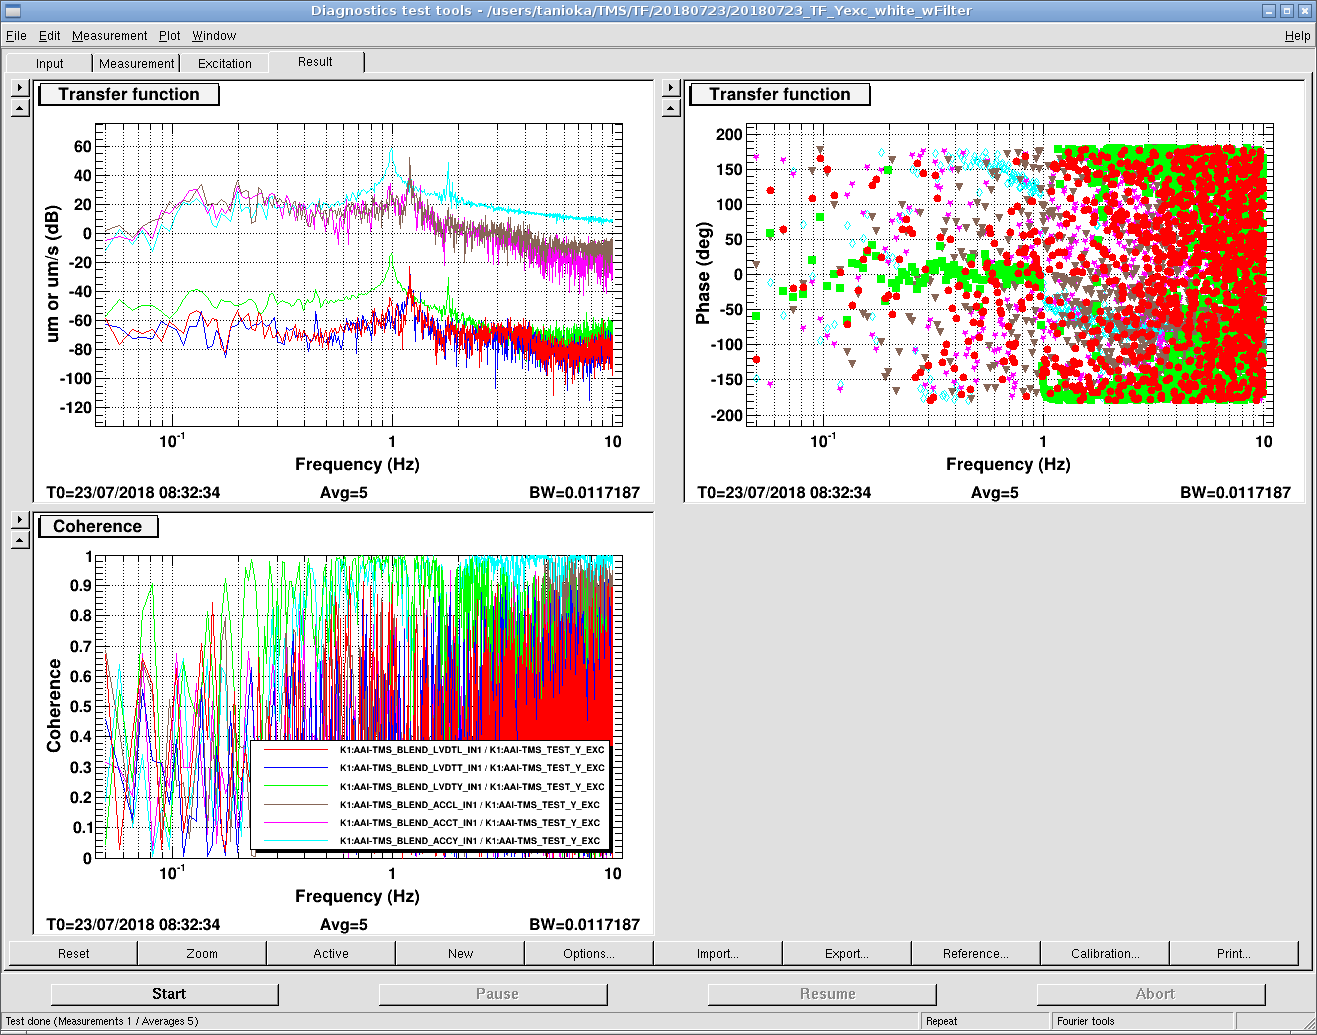
This shows the TFs when we inject Y direction.
The legends are shown in the graph of coherence (left lower figure).
Seeing green line and cyan line (LVDT Yaw and Geophone Yaw), we can see 2 peaks around 0.98 Hz and 1.8 Hz.
So these peaks come from some Y resonances (coupling from vertical mode? or couple to vertical mode?).
Also, the peak at 1.3 Hz seems come from horizontal direction resonance.
Some details are described here.
http://gwwiki.icrr.u-tokyo.ac.jp/JGWwiki/KAGRA/subgroup/AOS/TMS-VIS0/2018-07-23
