[Okutomi]
What I did:
- Local transfer function measurements from IPL excitaion with the MICH unlocked
- Transfer function measurement from IPL to TML using the MICH signal
Finally I obtained an estimation of vibration isolarion ratio (or seismic attenuation factor) from the ground to TM of the Type-A suspension
1. IP's local transfer function measurement
- First I measured the local transfer function from IPL excitation (mainly to the sensors on the IP)
-
During this measurement the MICH is unlocked on purpose
- Actually this measurement should be done before the Phase-1 operation
- I want somehow to get the transfer function in longitudinal direction to identify the peak frequencies
- Because I have to avoid from exciting these resonant peaks during the next measurement with locked interferometer signal
- Considering our time constraints, only the L-direction of the IP is excited
-
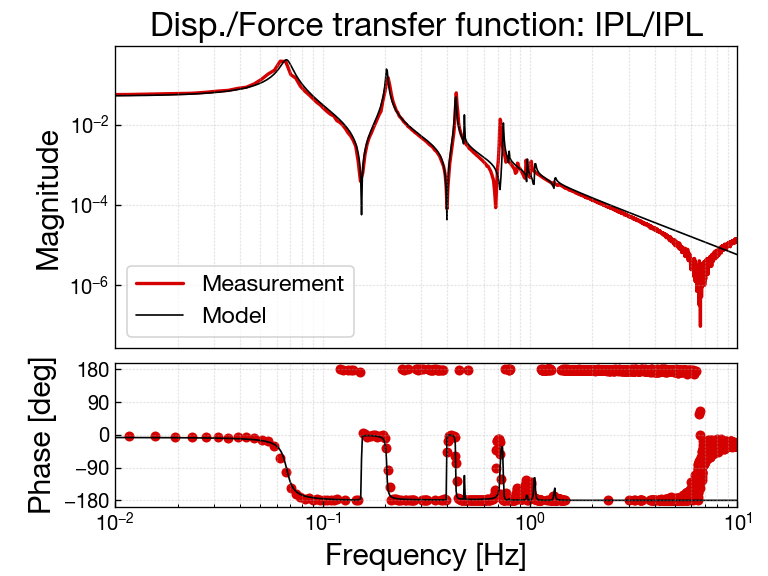
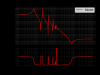
In the attached figure shown below (left), the measurement and the model (generated by SUMCON) show good consistency
- The small deviation can be tuned with the parameters in the model
- In other words, the two curves coincide with each other even without the fine tuning of the model
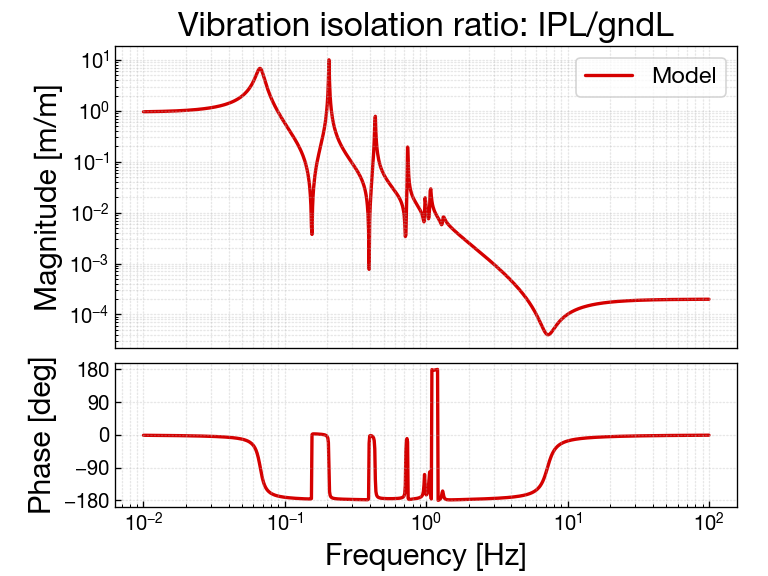
- Using the model confirmed above, the vibration isolation ratio from the ground to IPL is determined as the figure below (right)
2. Transfer function measurement with the MICH
- A displacement/displacement transfer function from IPL to TML is measured using the strain signal of the interferometer
-
The data is obtained only in the small frequency region of 0.8-1.7 Hz because of the limitation of the actuation range and the sensitivity of the interferometer
- In fact, the vibration attenuation factor steeply drops from ~10-2 to ~10-20 in 1-10 Hz in design
-
I injected the excitation signals with awggui for each sampling point one by one
- Because I had to choose the sampling points in frequency carefully not to excite the resonances
-
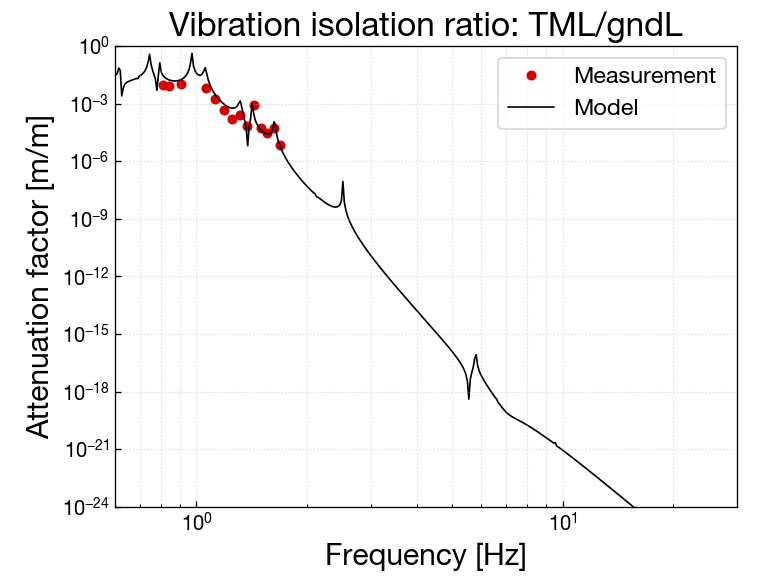
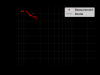
Multiplying these data by the IP's vibration isolation ratio (shown above), the measured vibration isolation can be obtained
- The measured vibration isolation ratio is roughly consistent with the one of the model
- The mismatch come from the modeling error for the peaks in higher frequencies around 1 Hz
- The extrapolation of the model curve indicates that the estimated vibration isolation ratio is ~ 10-21 at 10 Hz
- Further measurements of the vibration isolation ratio seem to require more actuation range or accumulation of vibration-isolation-raito measurements for each stage