[K. Nagano, Hasegawa]
We installed 8 PEM sensors around BS chamber.
Although this is preparation of PEM injection test scheduled on May 2nd., the sensors are online already.
Thus, they can be used for detector characterization, especially BS, in bKAGRA phase1 until they are moved to Yend for injection test for ETMY.
We plan to move some of them after PEM injection in center area on May 2nd.
NOTE: Microphone and power supply monitor reported in klog 4599 and 4837, respectively, were moved/uninstalled during this work around 1PM, today.
Sensors information
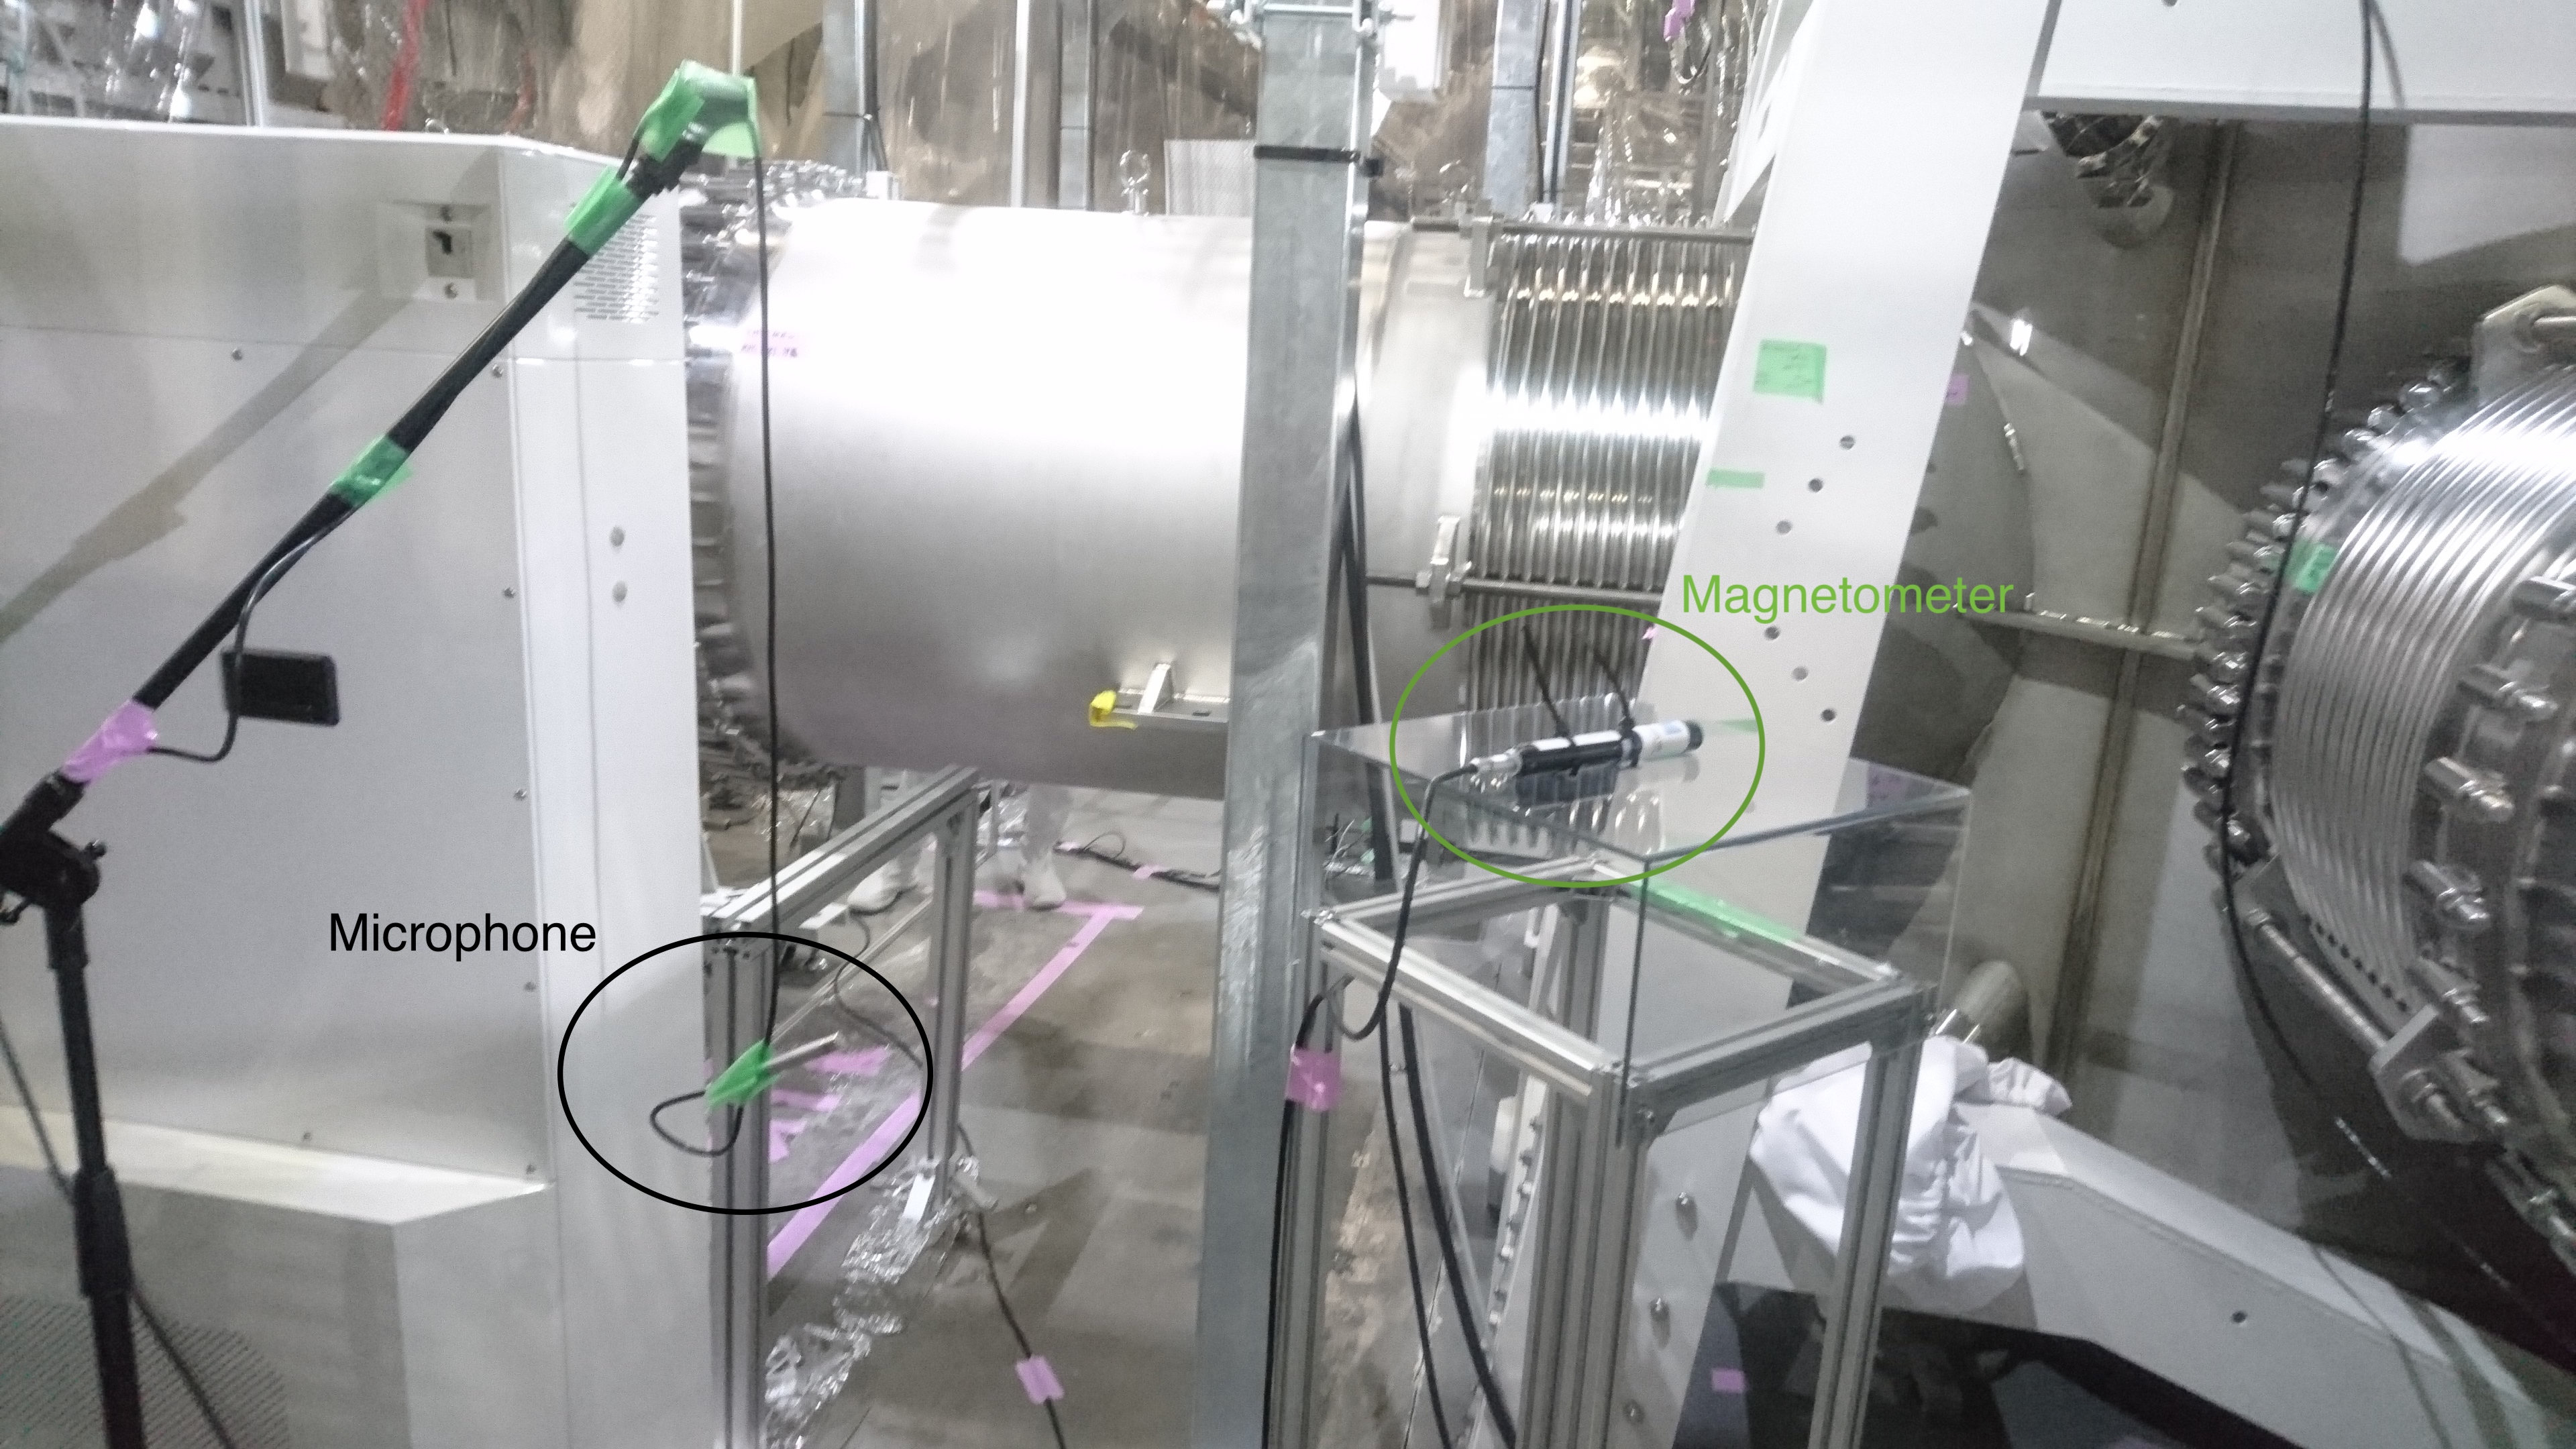
We installed a 3-axis magnetometer (Mag-13 MCL100), a microphone (B&K 4188), and four 1-axis accelerometers (Kistler 8640A5) and proper amplifiers or whitening filters for each sensor.
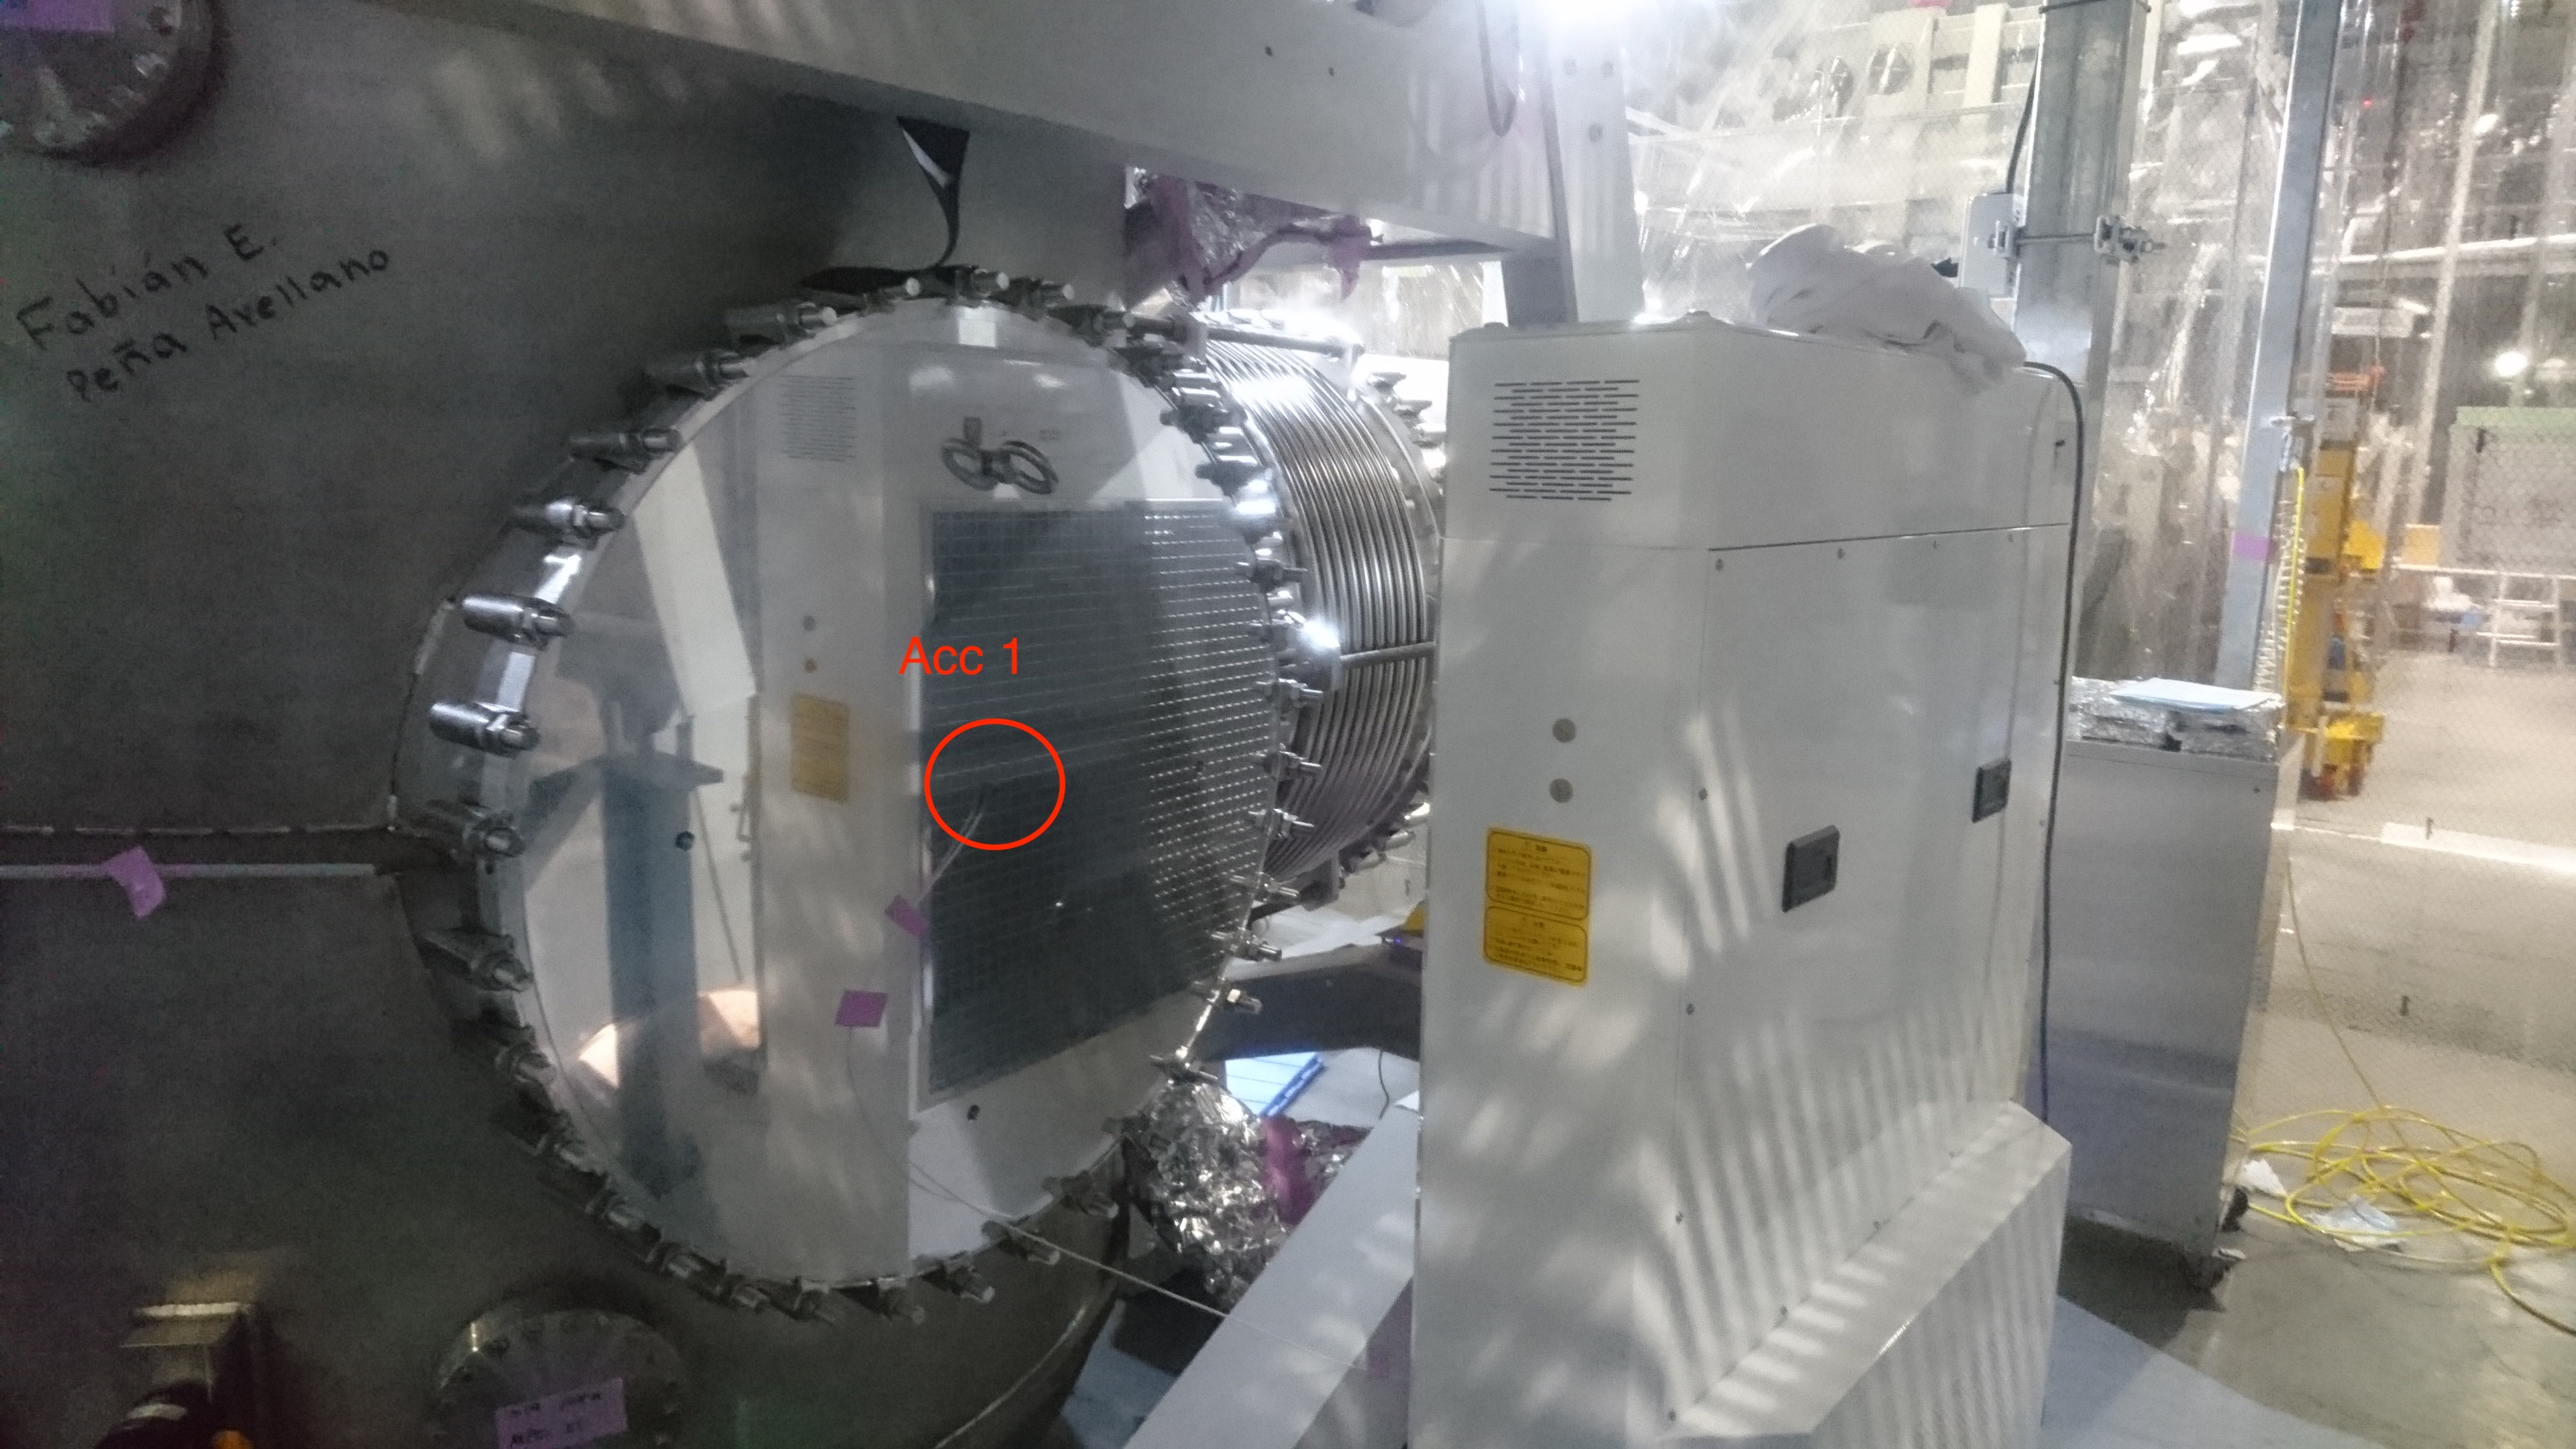
Their locations are shown in the following figure.
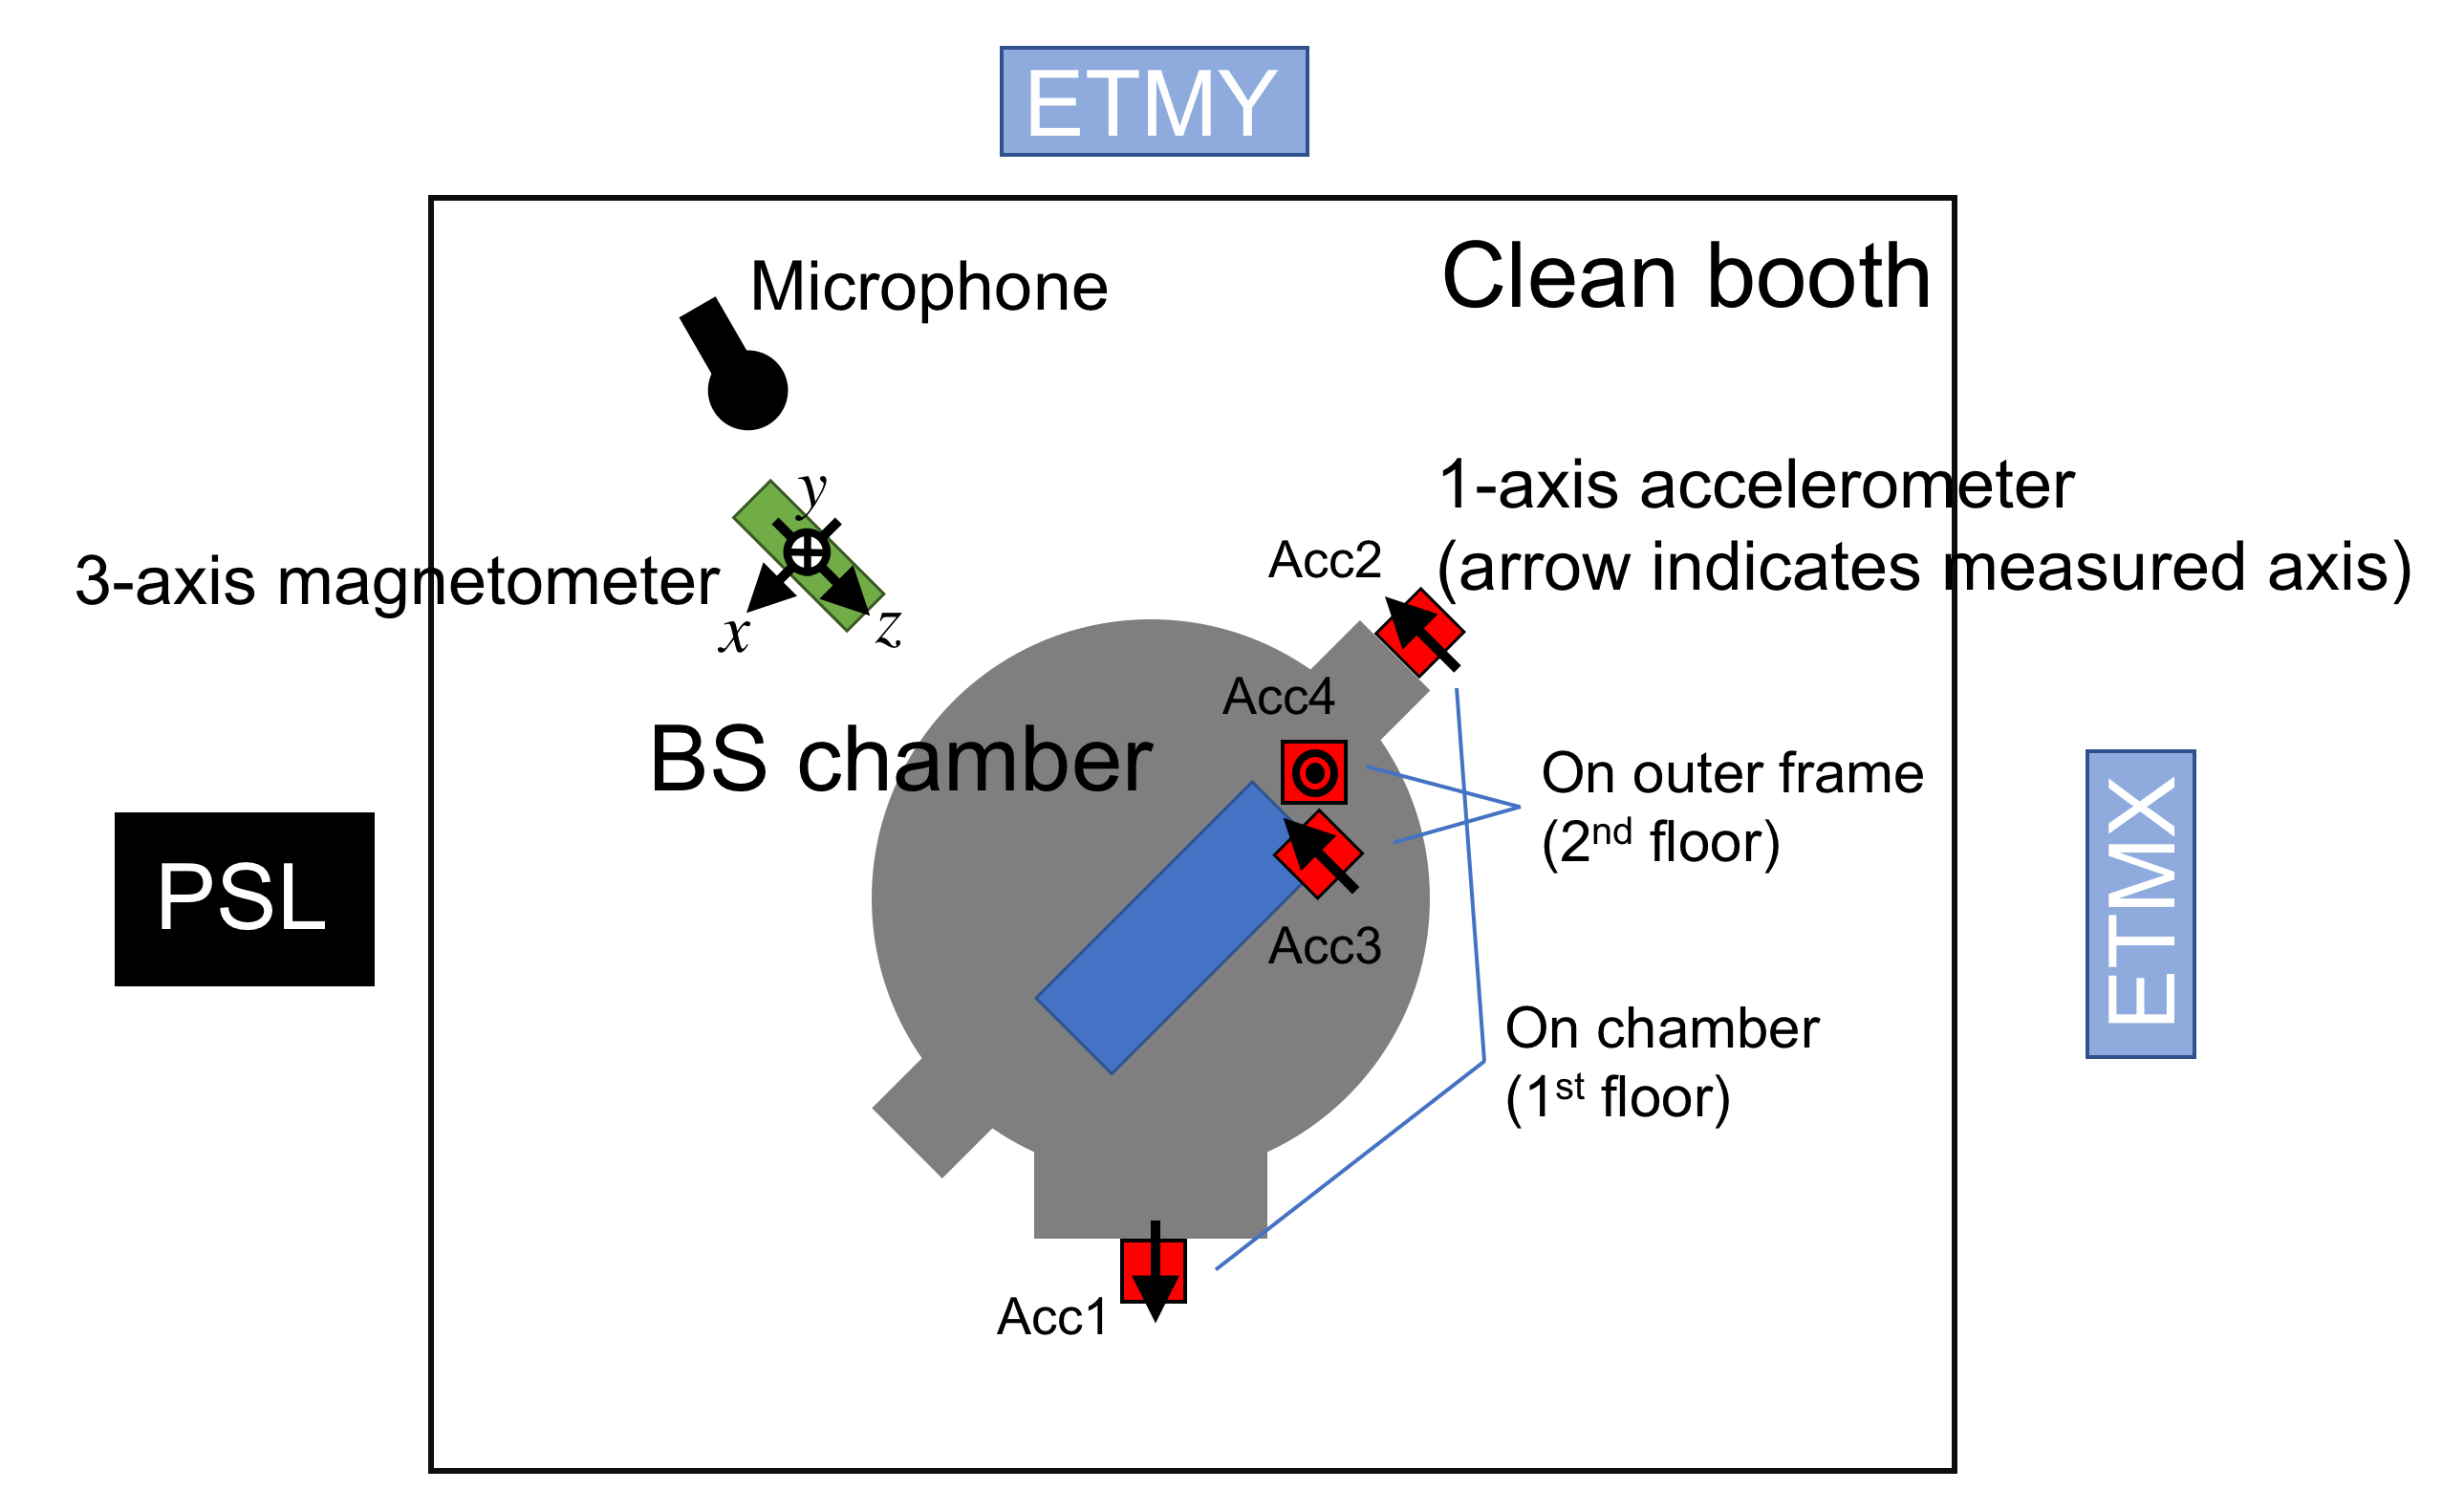
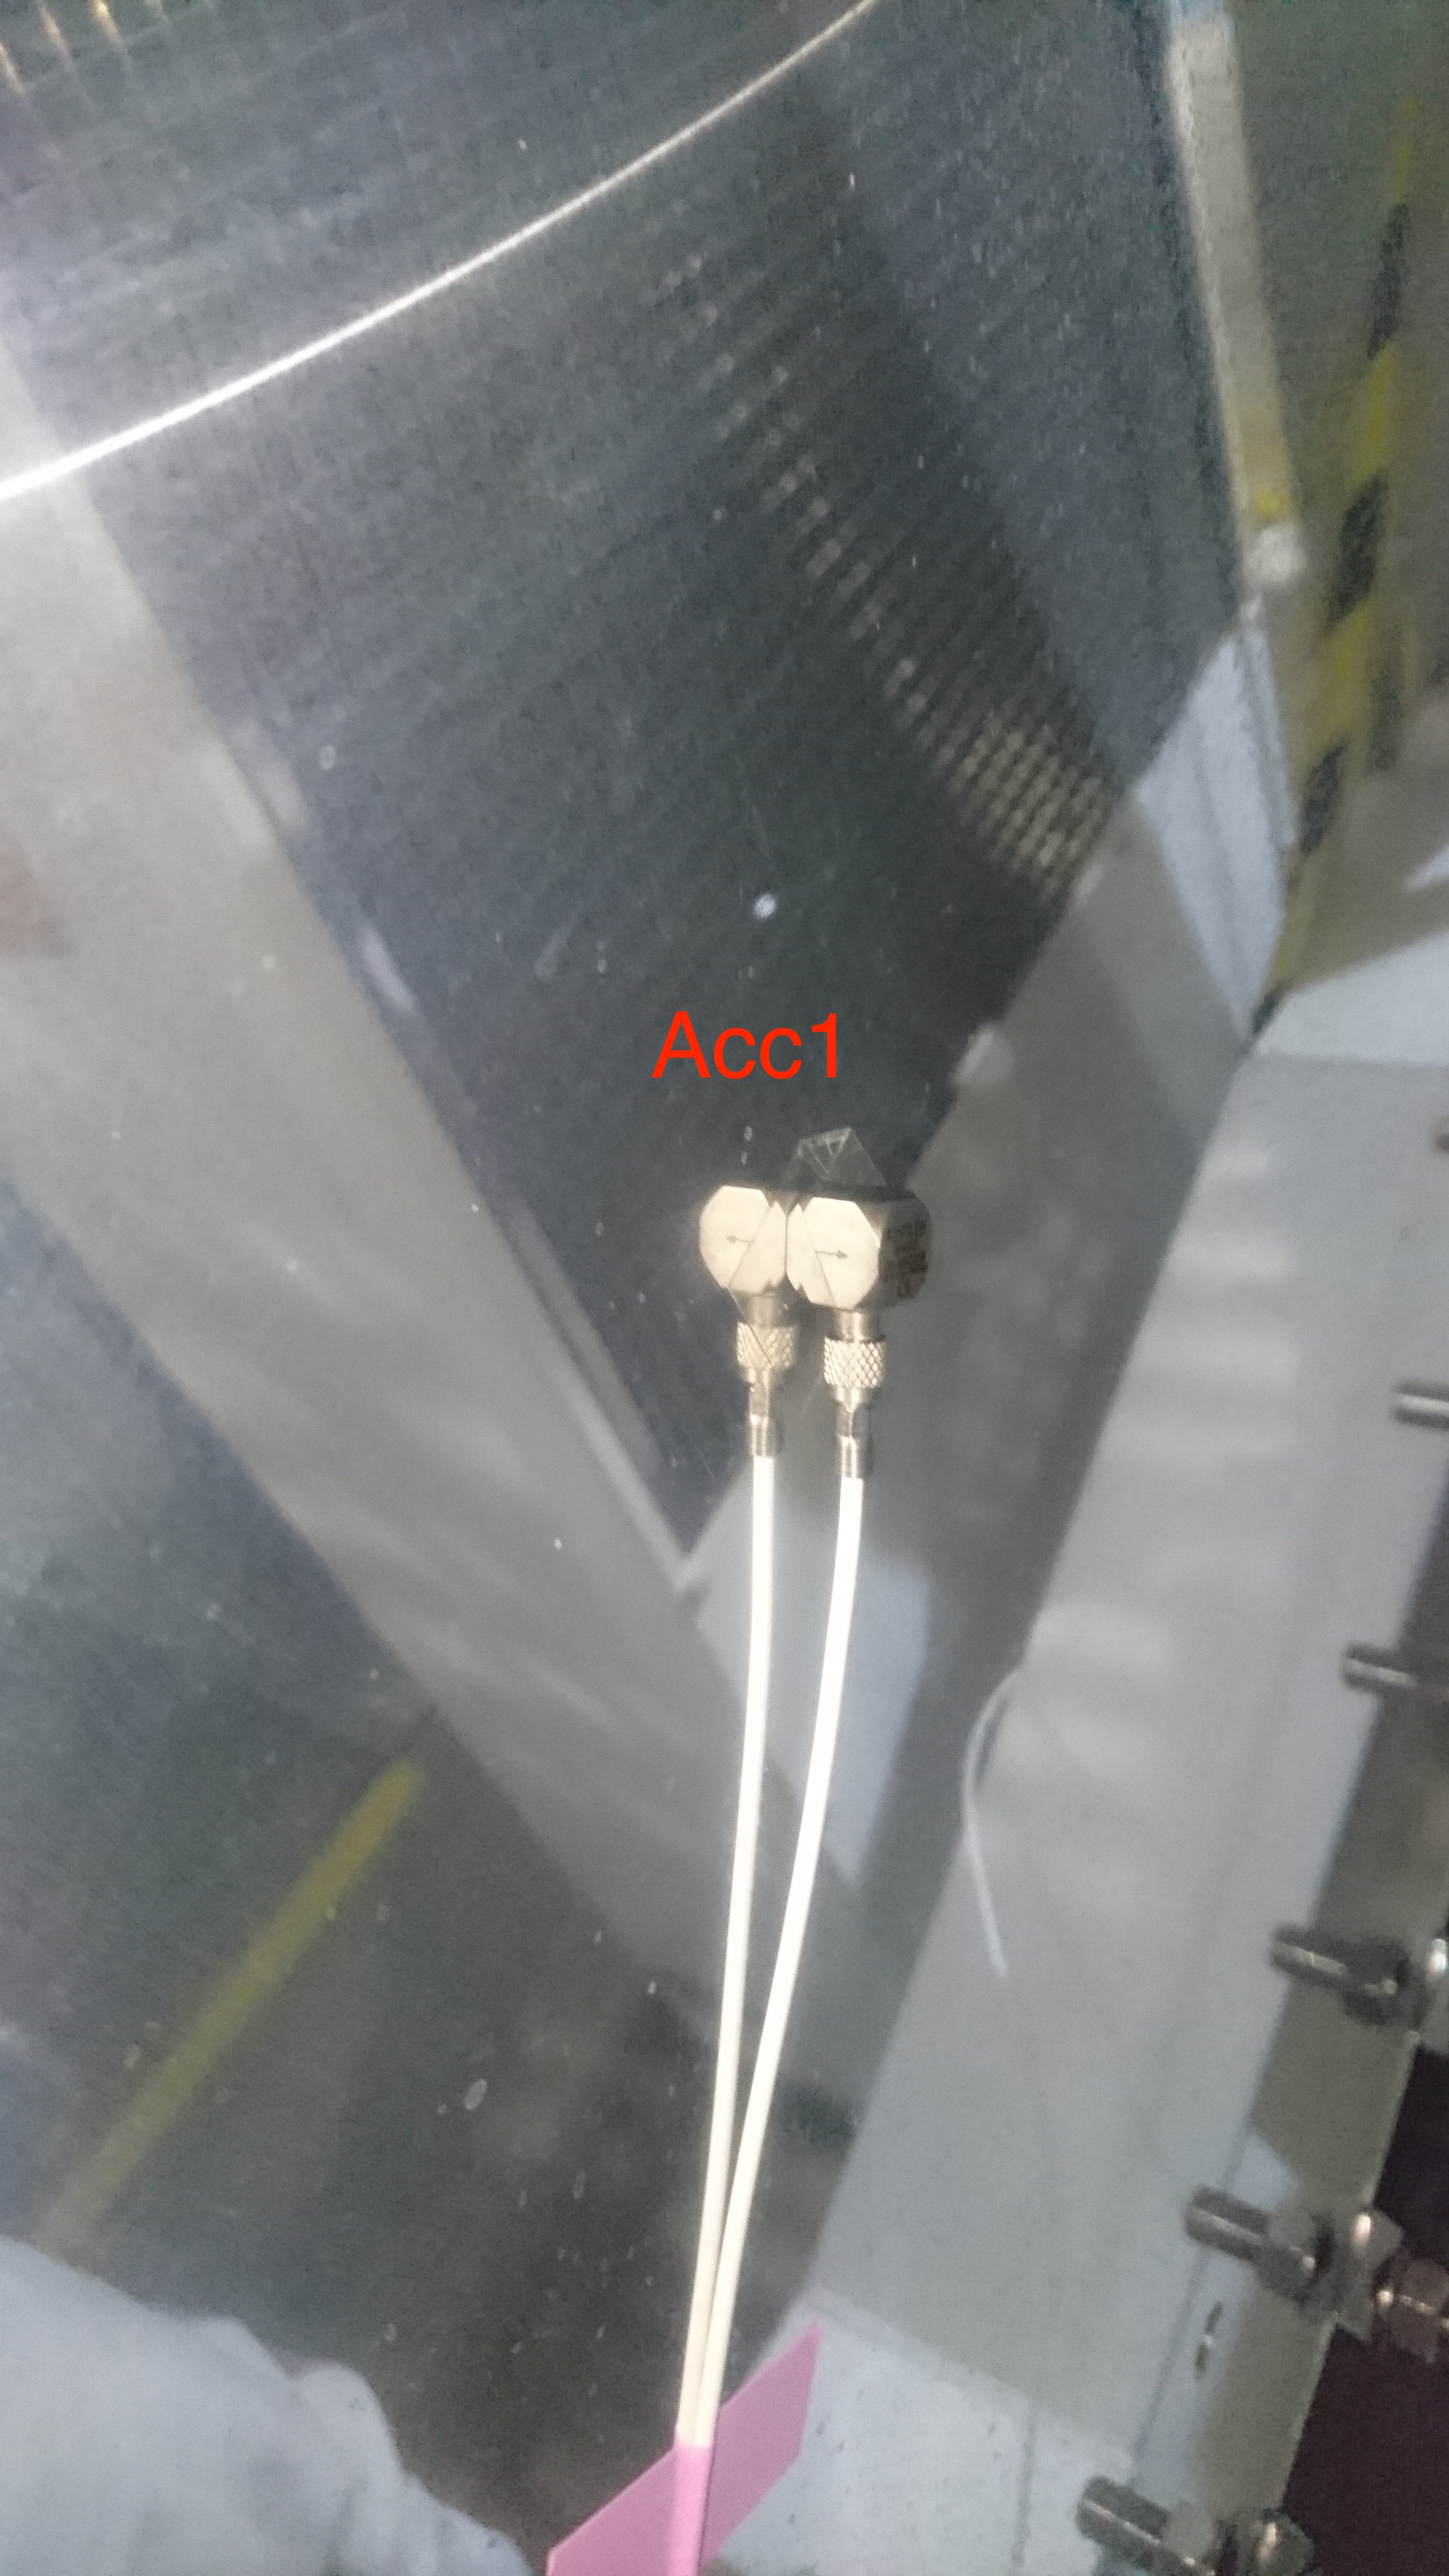
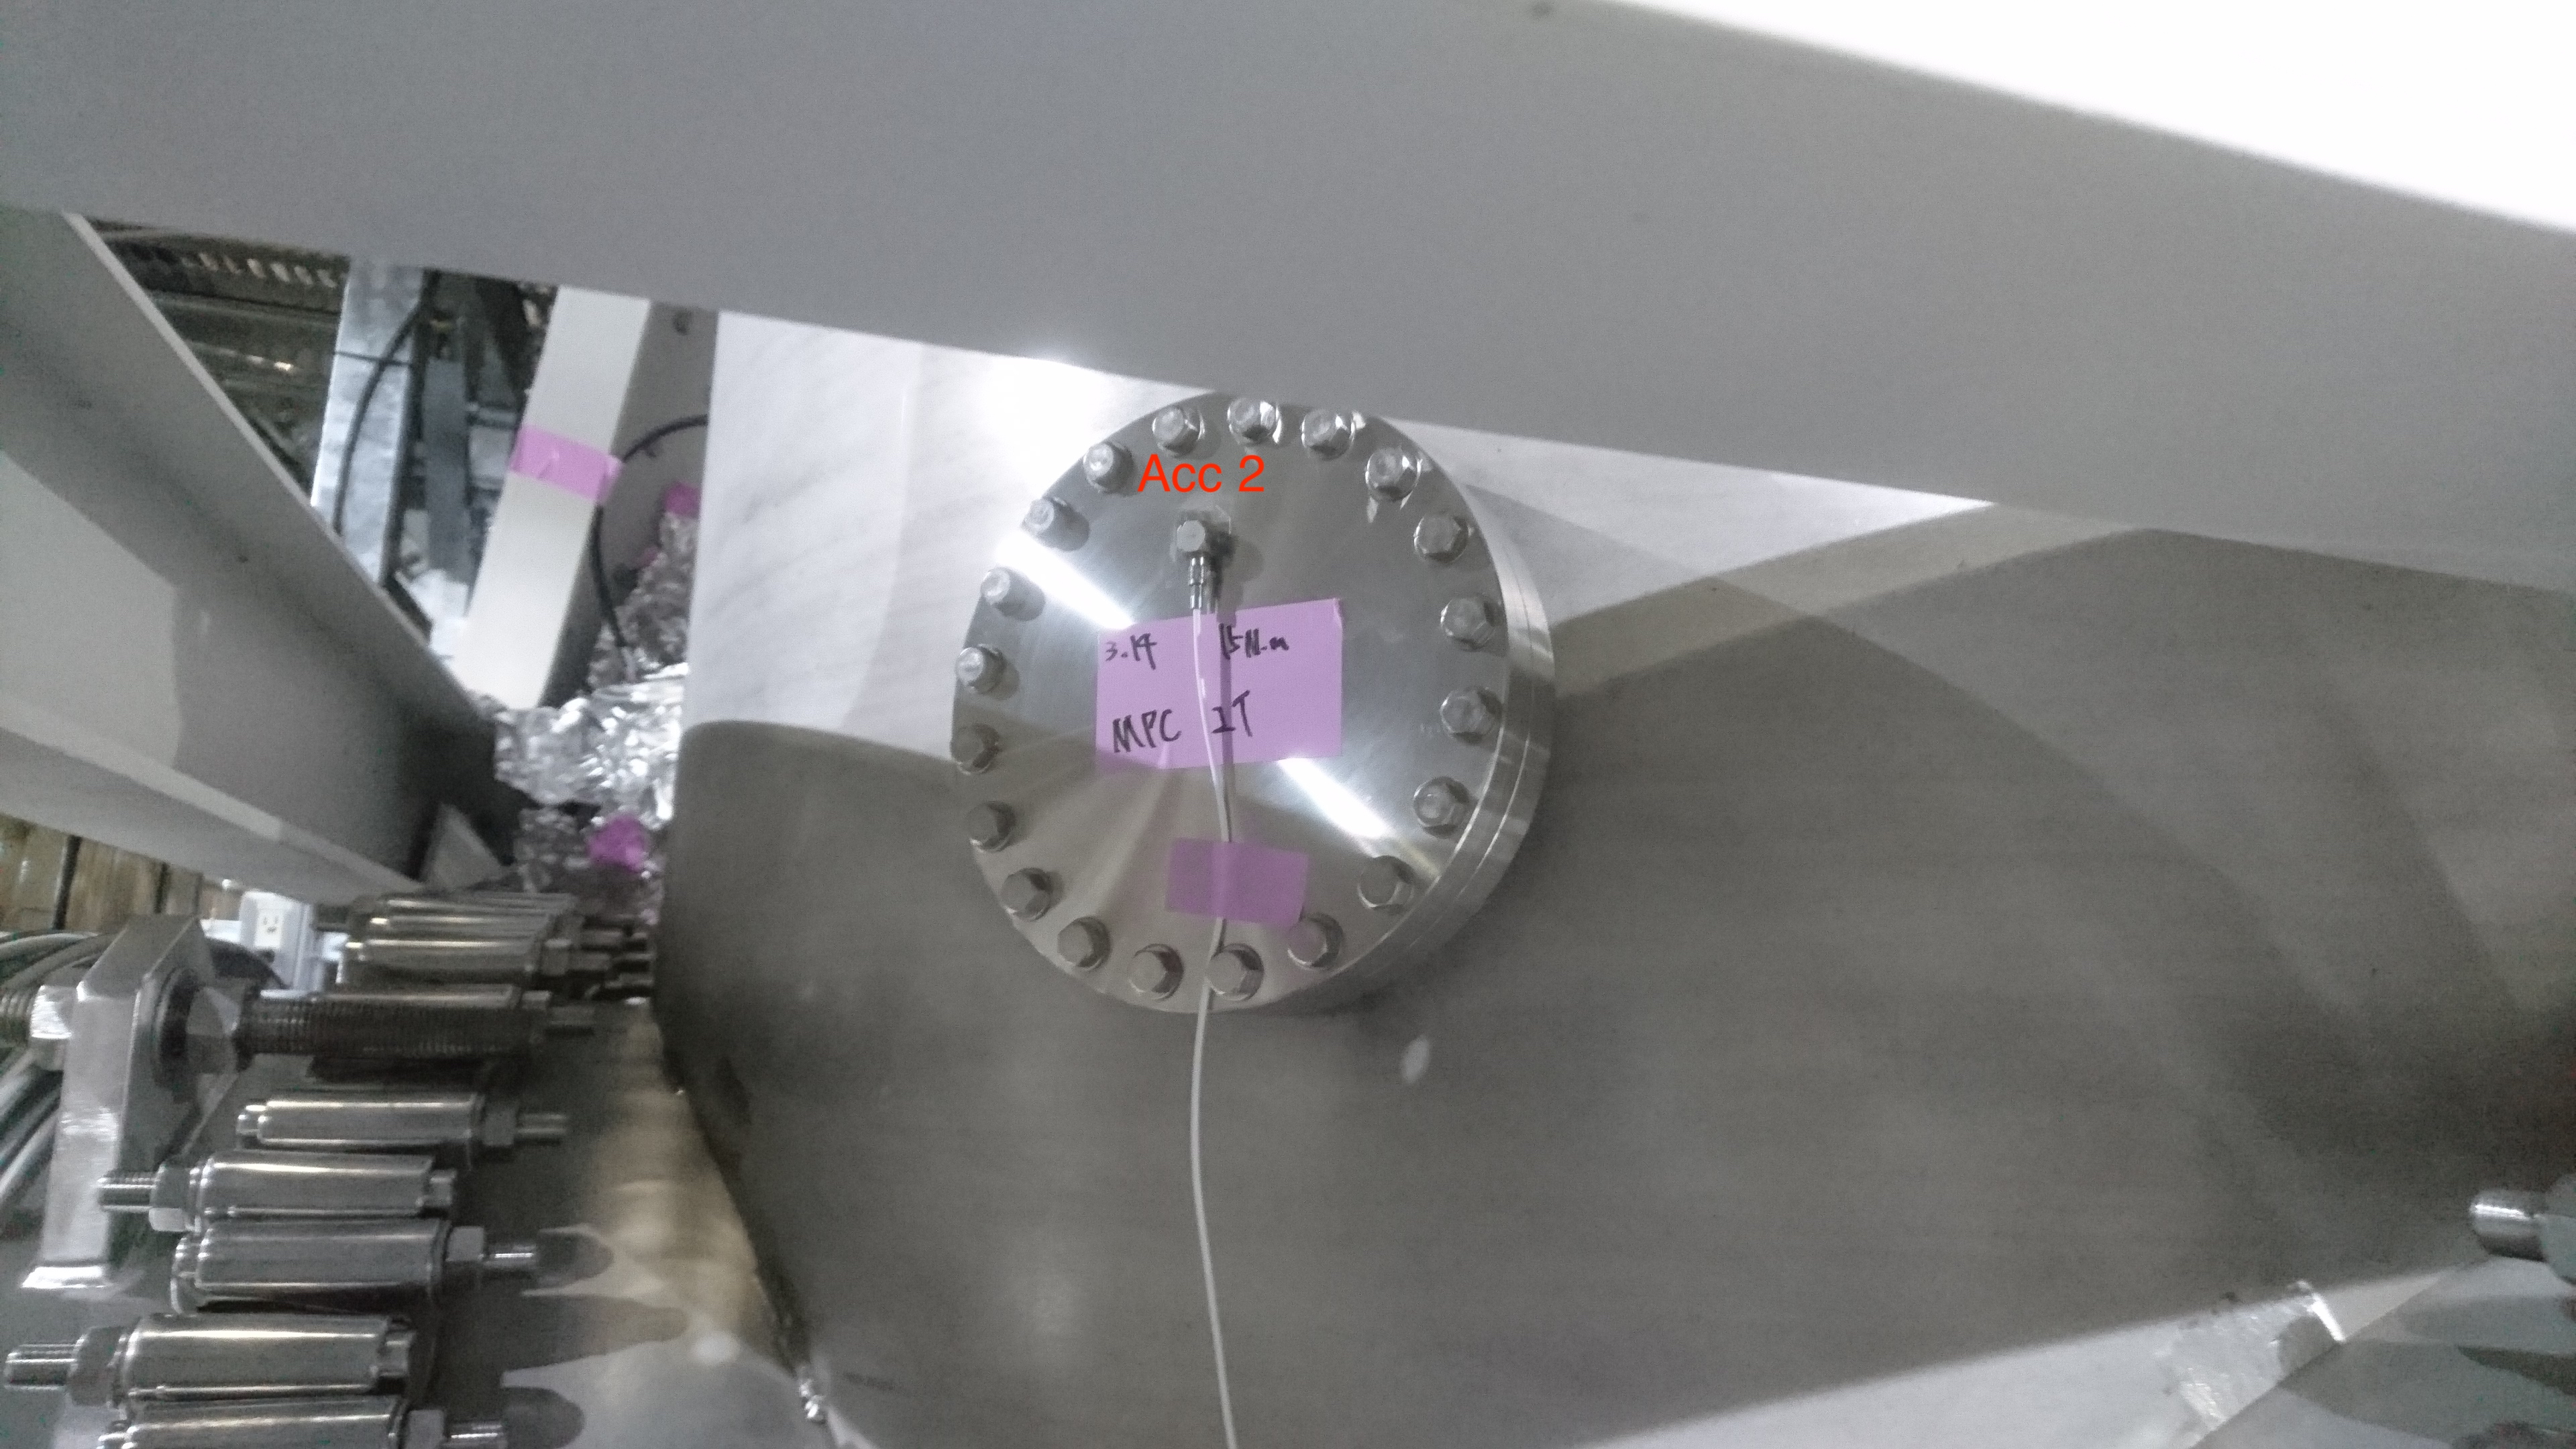
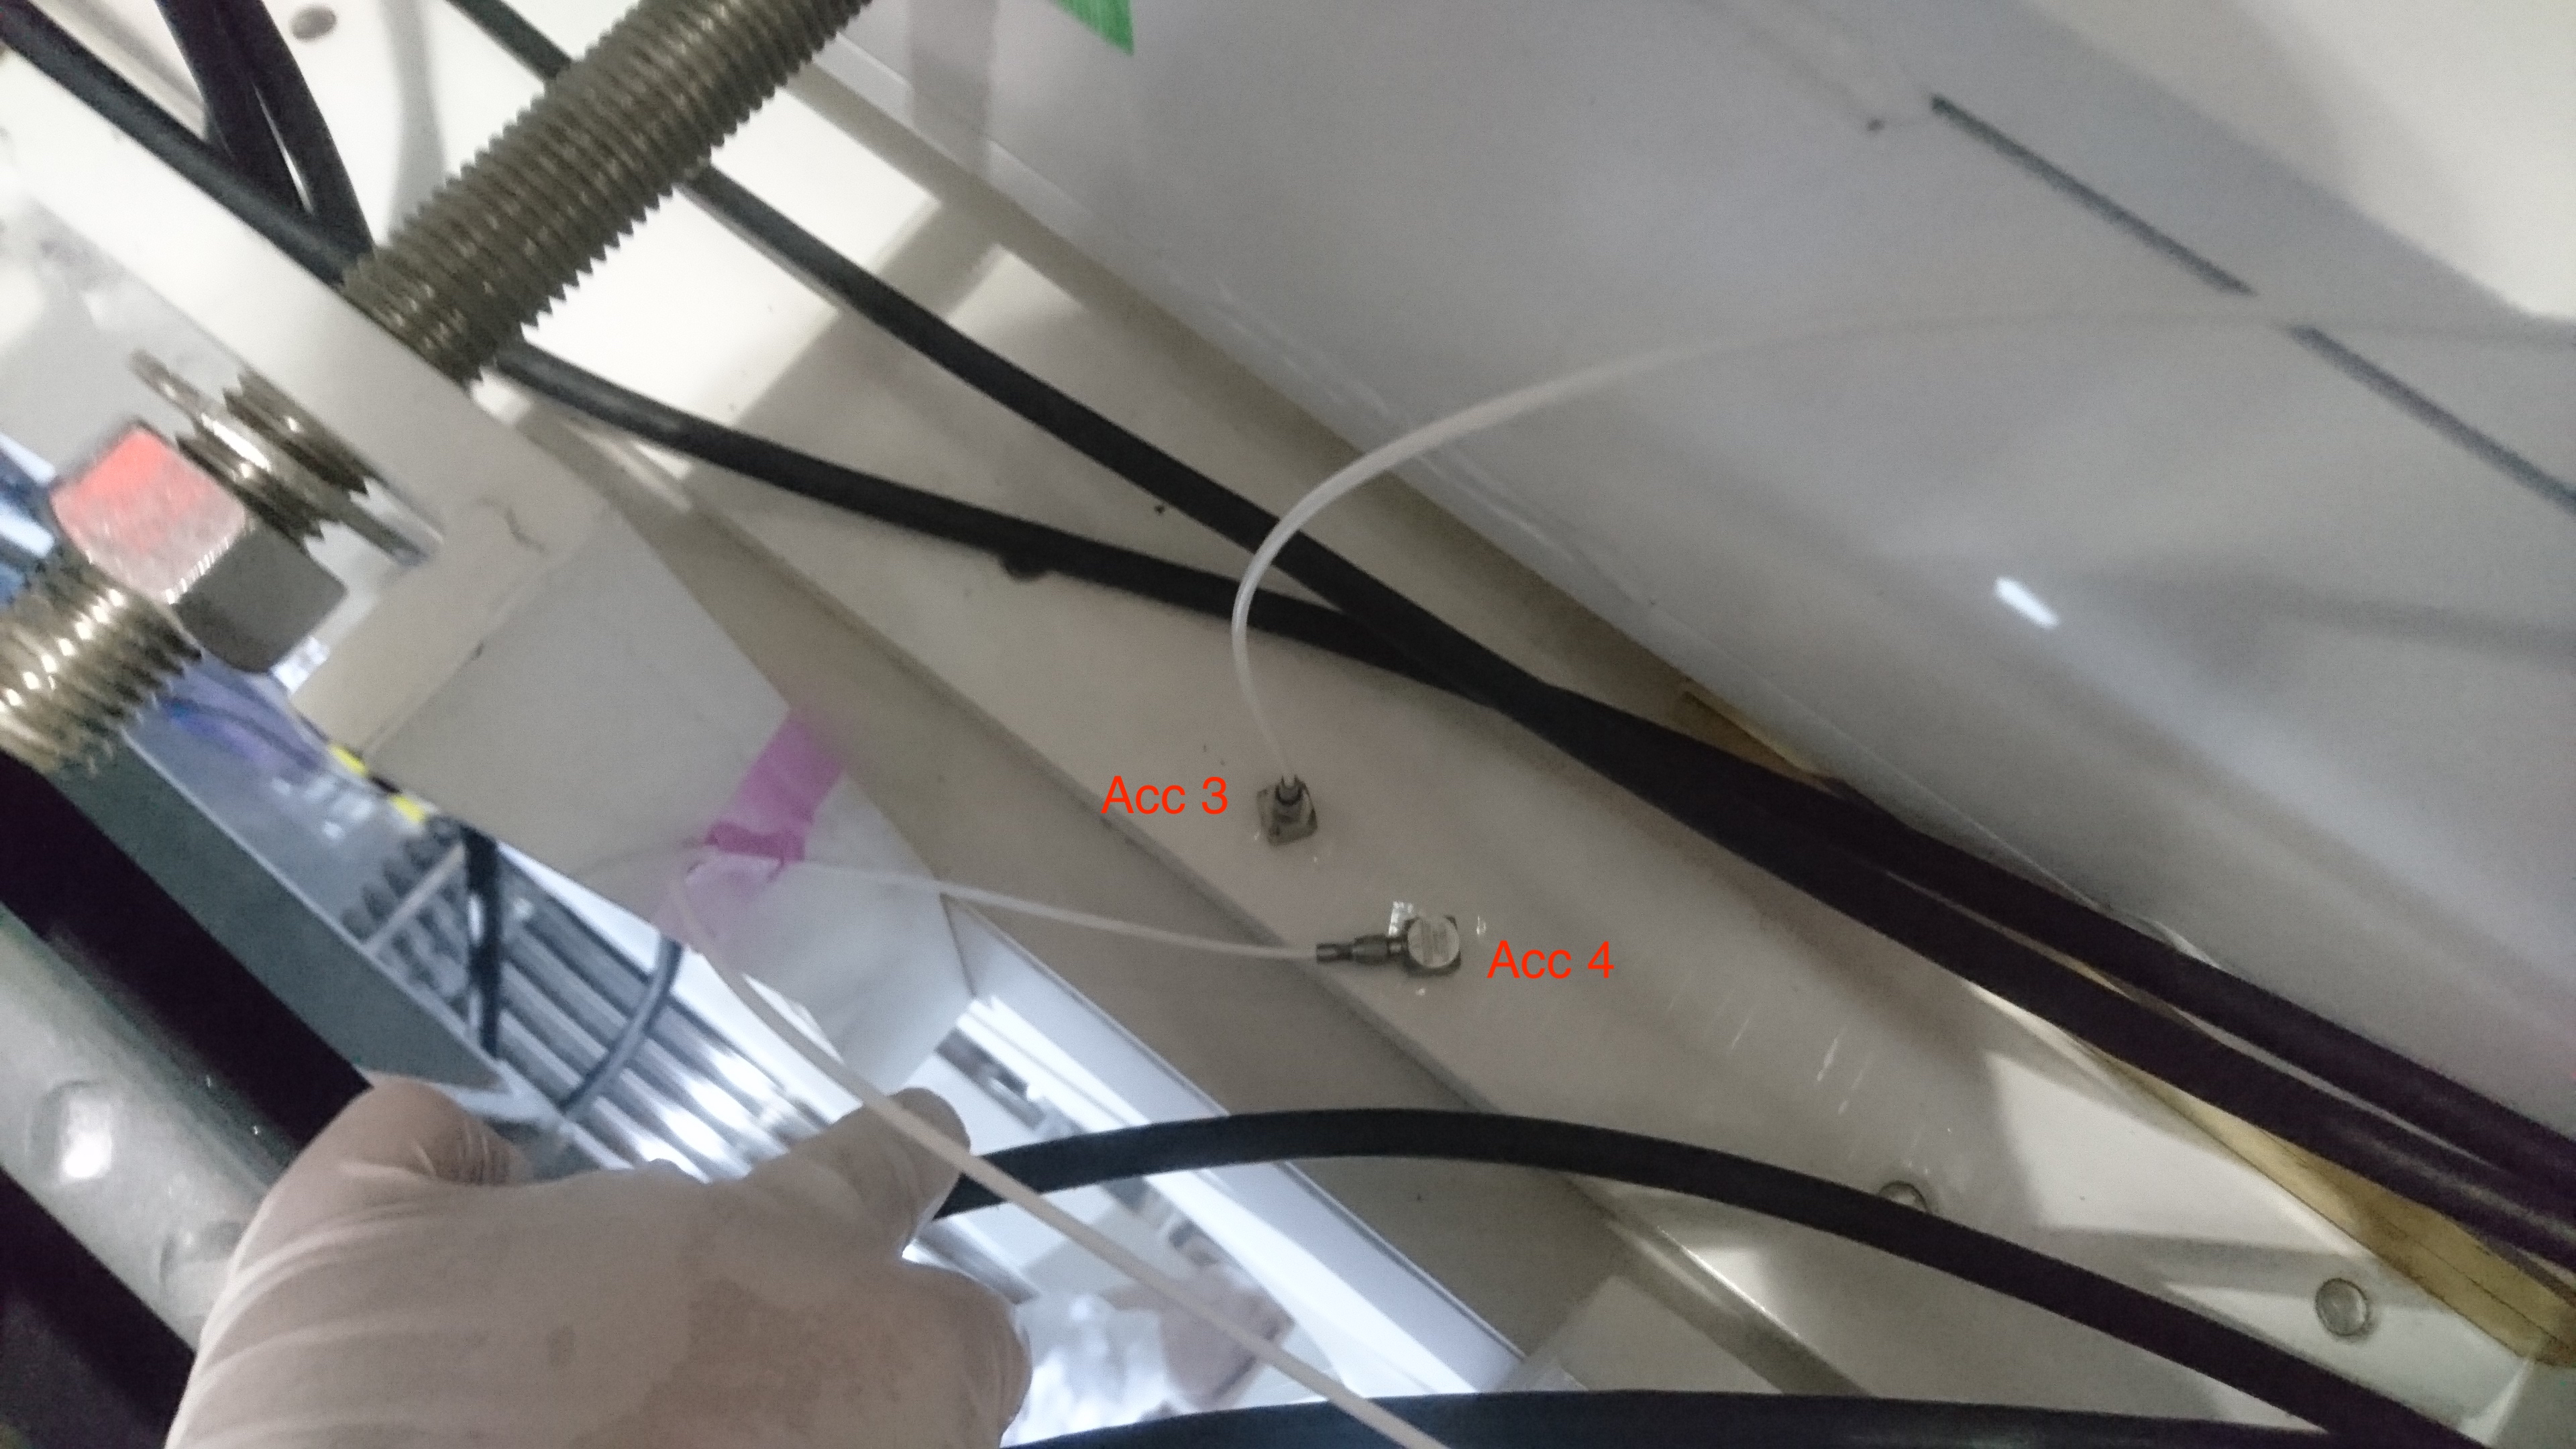
The measured axes of the magnetometers and accelerometers are represented by arrows.
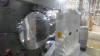
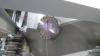
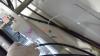
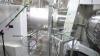
The pictures of the installed sensors are also attached.
The accelerometers were sticked on chamber/outerflame with clean compatible double-sided tape.
Channels
The sensor's signals are acquired in the channels explained in the following table.
(Sorry for the general names.)
| Sensor | channel name | Unit |
|---|---|---|
| Magnetometer (x axis) | K1:PEM-IY0_SENSOR1_OUT(_DQ) | T (tesla) |
| Magnetometer (y axis) | K1:PEM-IY0_SENSOR2_OUT(_DQ) | T (tesla) |
| Magnetometer (z axis) | K1:PEM-IY0_SENSOR3_OUT(_DQ) | T (tesla) |
| Microphone | K1:PEM-IY0_SENSOR4_OUT(_DQ) | Pa |
| Accelerometer (Acc 1) | K1:PEM-IY0_SENSOR9_OUT(_DQ) | m/s^2 |
| Accelerometer (Acc 2) | K1:PEM-IY0_SENSOR10_OUT(_DQ) | m/s^2 |
| Accelerometer (Acc 3) | K1:PEM-IY0_SENSOR11_OUT(_DQ) | m/s^2 |
| Accelerometer (Acc 4) | K1:PEM-IY0_SENSOR12_OUT(_DQ) | m/s^2 |
The signals in OUT(_DQ) has been calibrated with some filters.
They can be checked in the MEDM screen which can be accessed from sitemap -> PEM -> PEM map -> DETAIL button -> IY0 (although the installed sensors are not shown in the PEM map since we did not have time.)
Please do not change the status of any filters in the screen.
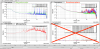
Spectra
The measured spectra for each sensors are shown in the following figure.
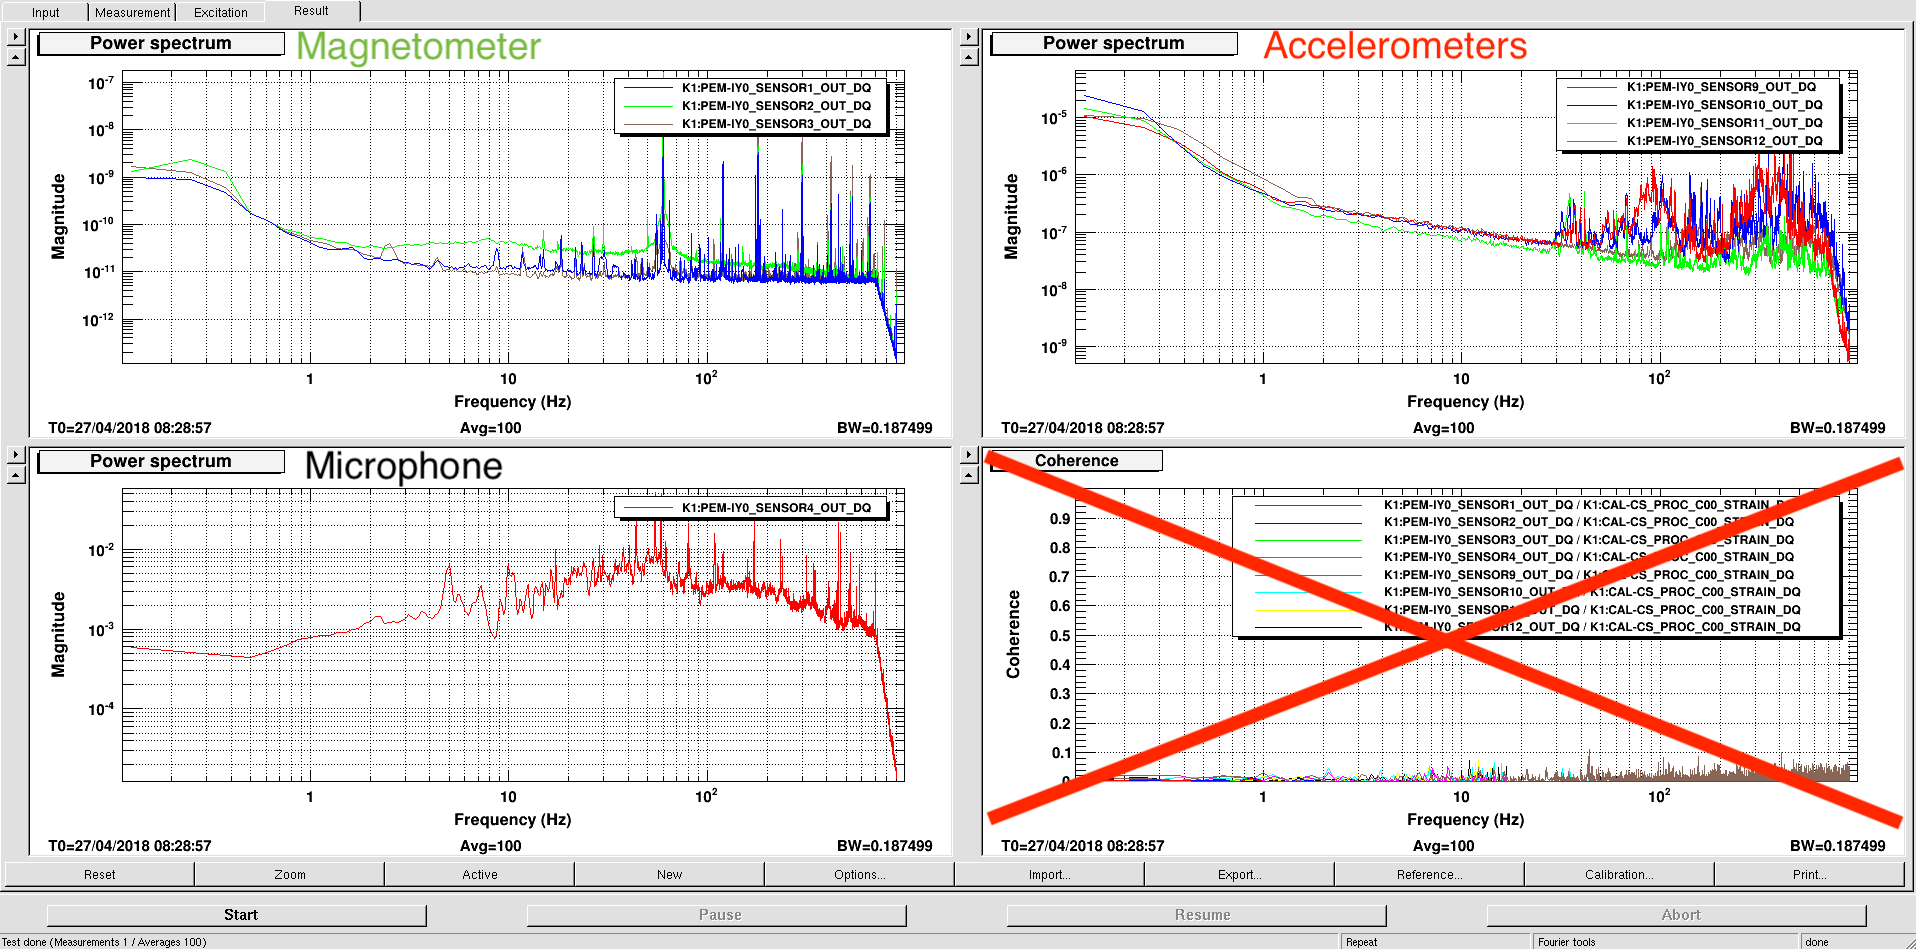
About these spectra, please note that following things.
- Magnetometer: Above around 10 Hz, the spectra are limited by sensor's noise except for peaks.
- Microphone: The microphone's lower limiting frequency is between 1 and 5 Hz.
- Accelerometers: The smooth spectra (f^-1) below 100 Hz is sensor noise floor.
Coherence
We (and maybe you also) want to see the coherence of the sensors to Michelson signals or BS signals.
However, we could not do it in diaggui.
When we measured coherences, the plots showed strange behavior (for example, the coherence was zero from the first averaging).
We discussed this problem with Miyakawa-san and Yamamoto-san and they suspect this might occurr since IY0 rack which we use to take sensors data has no timing signal via optical fiber.
(Yamamoto-san will kindly install the timing cable in a few days.)
Possibly, we can measure coherence by ourselves from time series data.
