Addendum
I calculated the calibration factors for the photosensors (PS) that we are using for the WAB movement detection.
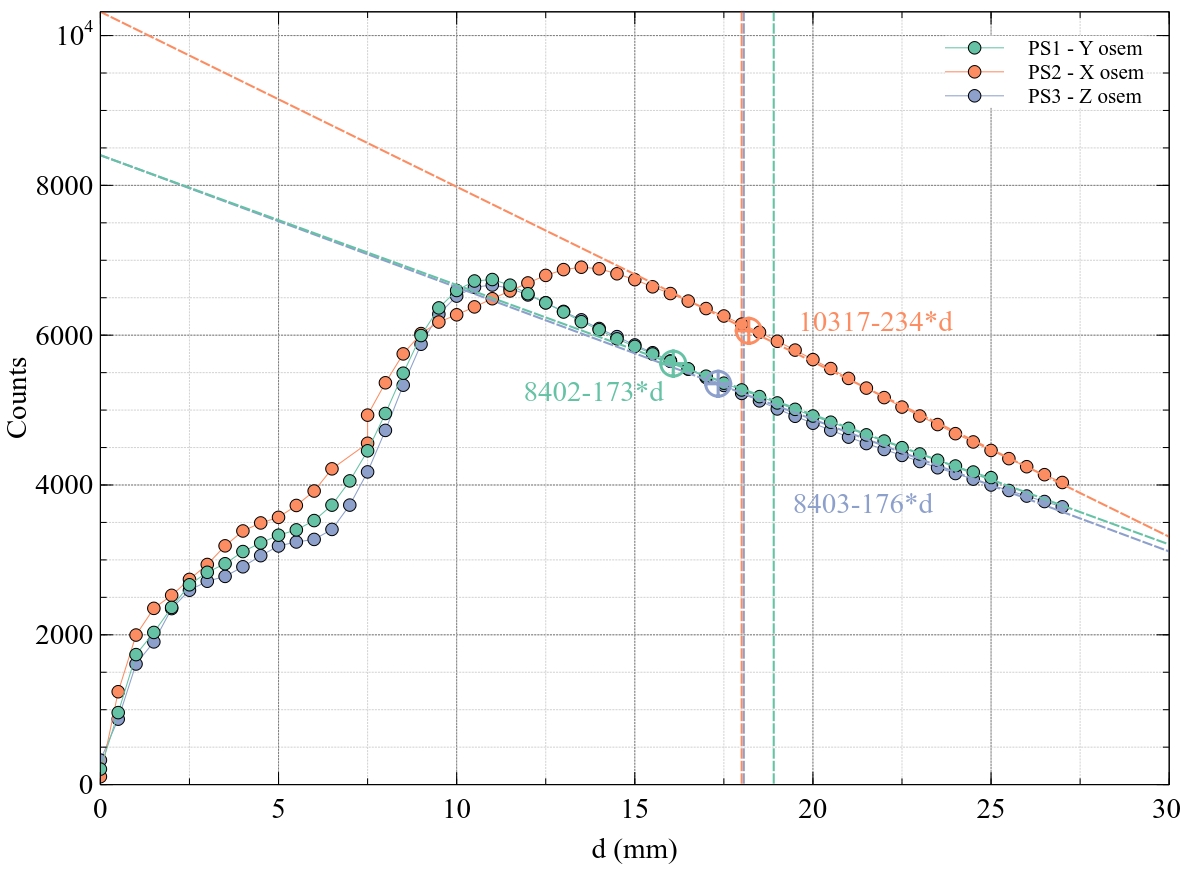
Please see the attached figure for the respective factors. The dots indicate the measured response as a function of the distance to the reflector while the striped lines are the respective fit to the measured data (indicated with the same color).
In addition to the fit, there are also striped vertical lines. These lines are indications for the measured distances of the PS to the reflector shortly before closing the chamber. The big dots in the curves, however, are the positions according to the measured counts on the fit-functions. As one can see, both big dot and vertical line are not consistent with each other for the comsY PS (OSEM driven). The reason remains unknown, but most importantly we do think that we are nevertheless in the linear range and can do actual movement measurements!