[Aritomi, Nakano, Michimura, Kokeyama]
Coherence between WFS signal and motion of MCi
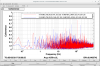
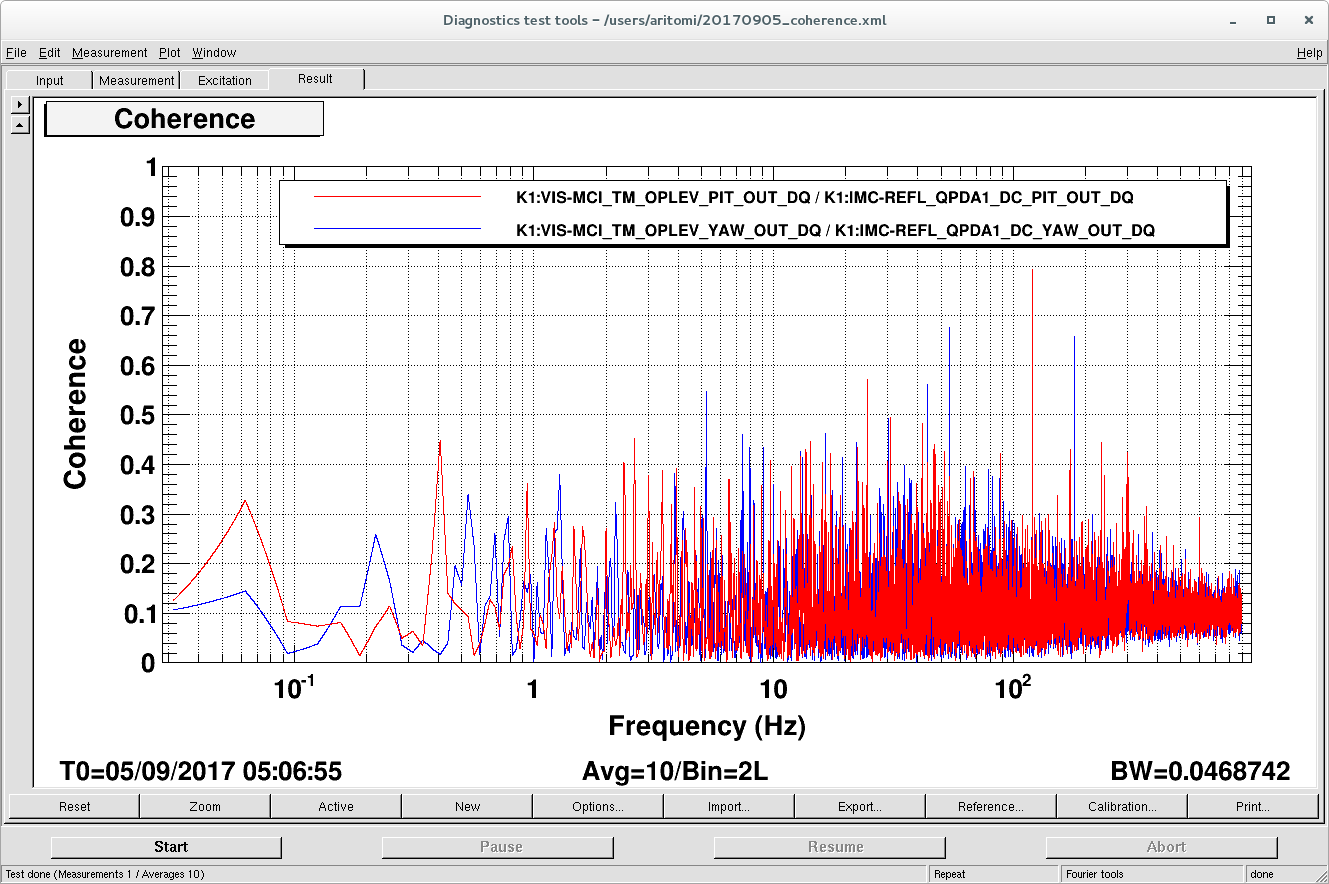
First we measured coherence between QPDA1 DC and oplev of MCi to check if motion of MCi is the noise source or not. In order not to make IMC resonate, MCo was misaligned.
The result is shown in the first attached figure. Red curve is coherence between PIT signals and blue curve is coherence between YAW signals.
As you can see, there was no coherence between them.
Noise Reduction
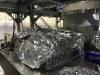
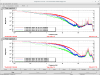
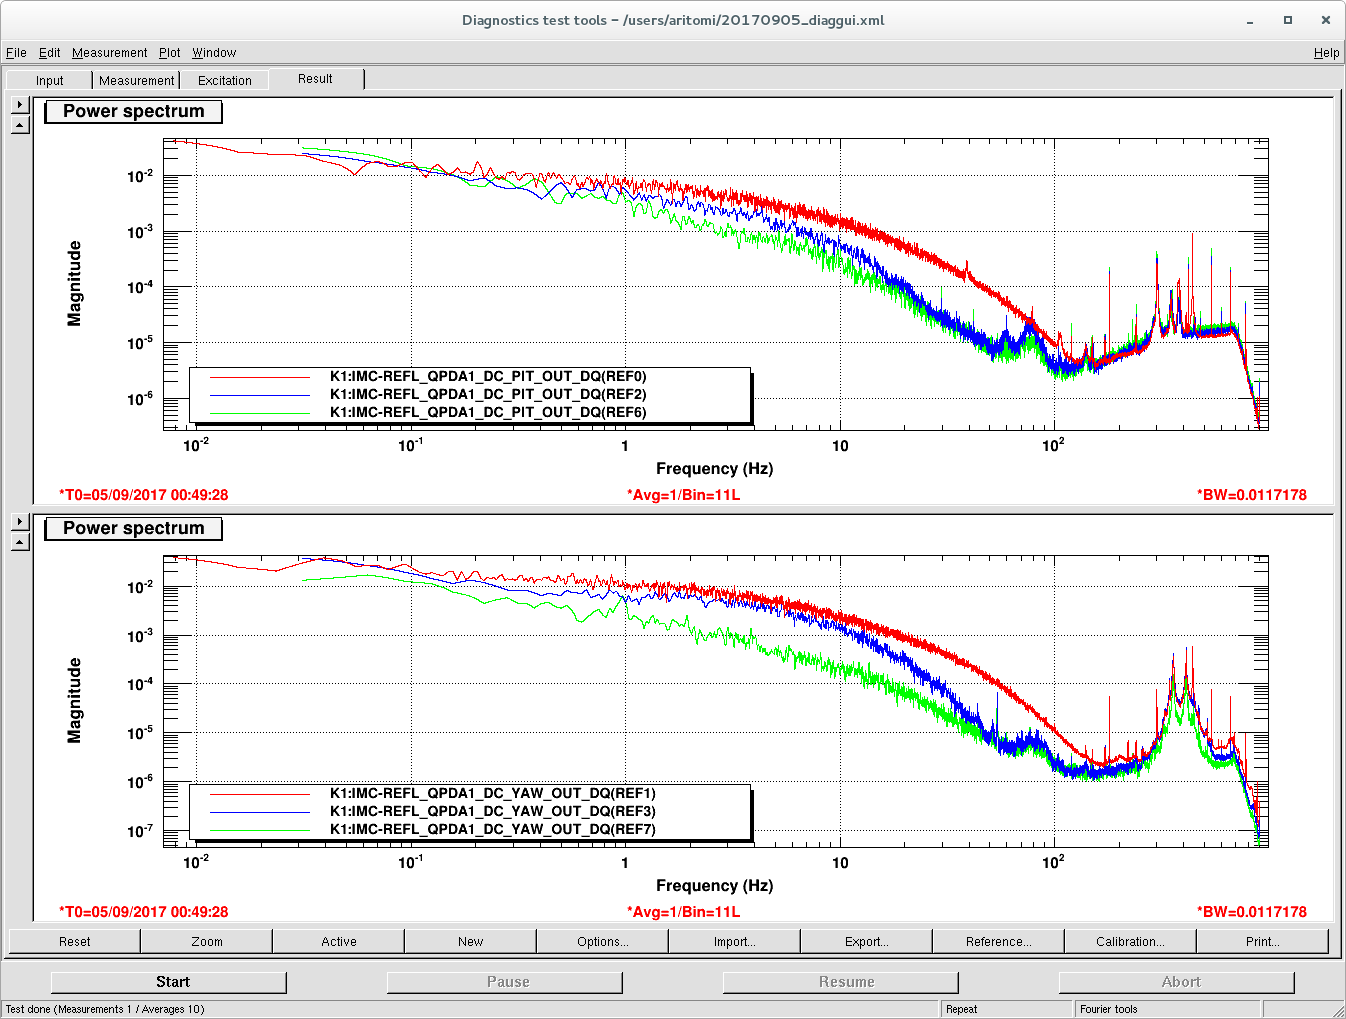
To reduce the noise, we wrapped IMC REFL table in aluminum foil as shown in the attached picture. Third attached plot shows power spectrum of PIT (upper) and YAW (lower) signal of QPDA1 DC. Red curve is COACH ON, without aluminum foil. Blue curve is COACH OFF, without aluminum foil. Green curve is COACH OFF, with aluminum foil.
This result shows that the noise is dominated by IMC REFL table (wind, light, etc.) at 1-10 Hz and COACH filter at 10-100 Hz.
Residual noise is not identified yet.
To reduce the noise of WFS signal, we wrapped IMC REFL table in aluminum foil as shown in the second attached picture.
Third attached figure shows power spectrum of PIT (upper) and YAW (lower) signals of QPDA1 DC.
Red curve is COACH ON, without aluminum foil. Blue curve is COACH OFF, without aluminum foil. Green curve is COACH OFF, with aluminum foil.
Third attached figure shows power spectrum of PIT (upper) and YAW (lower) signals of QPDA1 DC.
Red curve is COACH ON, without aluminum foil. Blue curve is COACH OFF, without aluminum foil. Green curve is COACH OFF, with aluminum foil.
This result shows that the noise is dominated by IMC REFL table (wind, light, etc.) at 1-10 Hz and COACH filter at 10-100 Hz.
Residual noise is not identified yet.
Residual noise is not identified yet.
Residual noise is not identified yet.
This result shows that the noise is dominated by IMC REFL table (wind, light, etc.) at 1-10 Hz and COACH filter at 10-100 Hz.
Residual noise is not identified yet.
As you can see, there was no coherence between them.
First we measured coherence between QPDA1 DC and oplev of MCi to check if MCi is noise source or not. In order not to make IMC resonate, MCo was misaligned. The result is shown in the first attached figure. Red curve is coherence between PIT signals and blue curve is coherence between YAW signals.
As you can see, there was no coherence between them.