Before uninstall tilt sensor, we measured the excitation of the mirror with tilt sensor, and calibrated optical lever with tilt sensor data.
Calibration process
1. Give excitation to the MCE mirror.
2. Measure the amount of excitation with tilt sensor spectrum.
3. After install Oplev, give the same excitation to the mirror and apply some calibration factor based on tilt sensor result.
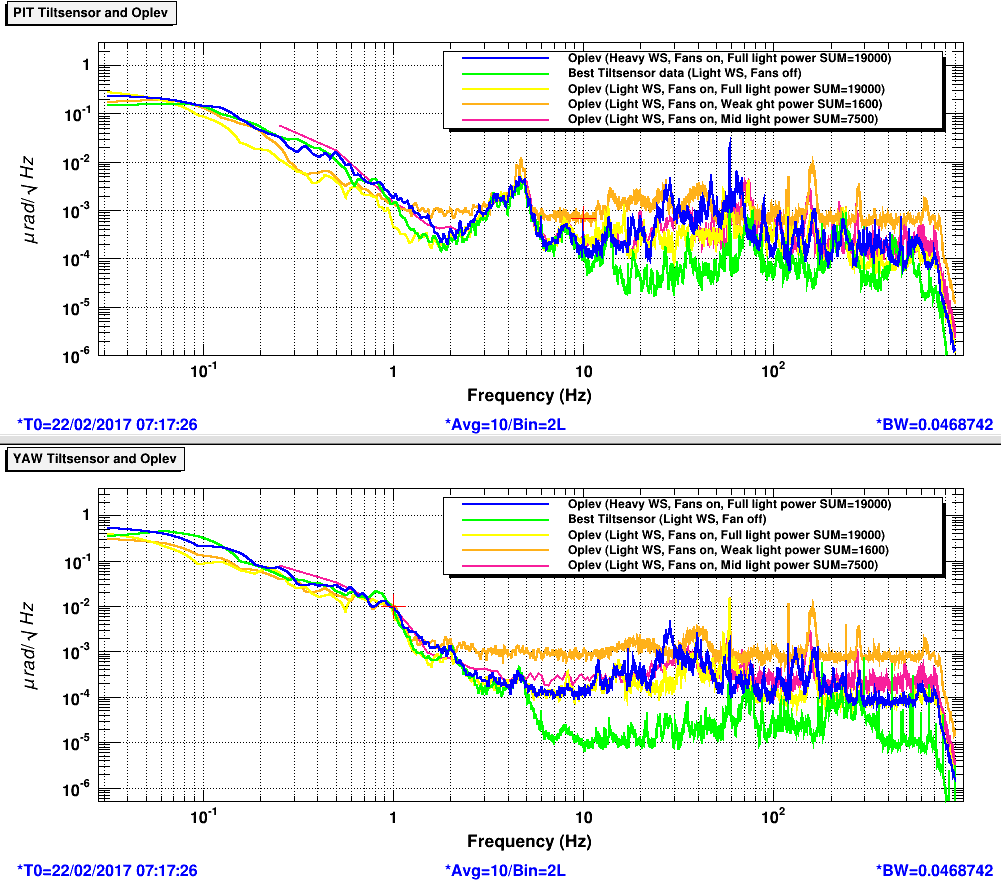
After finishing the calibration, we tested effect of wind shield. (Blue and yellow plot)
There are no difference below 10Hz but around 30Hz you can see the difference clearly.
As with tilt sensor result, it is better to use light wind shield.
- compare with tilt sensor
Green plot is tilt sensor result and other plots are optical lever.
If you compare green plot and yellow plot, it shows good agreement at low frequency, but for high frequency noise level of optical lever is little bit higher than tilt sensor result.
(especially for yaw, there is 1 order difference)
We tried figure out the reason, and we found the power dependency of the noise level. (yellow, pink, orange plot).
SUM means summation of intensity of QPD. High SUM value means laser power is high.
We don't know exact reason but noise level of Oplev was limited by optical power.
Since we adjust the optical power with ND filter, definitely it is not effect of laser source noise.
We will do more investigation tomorrow.
Here are the plots for oplev in various conditions.
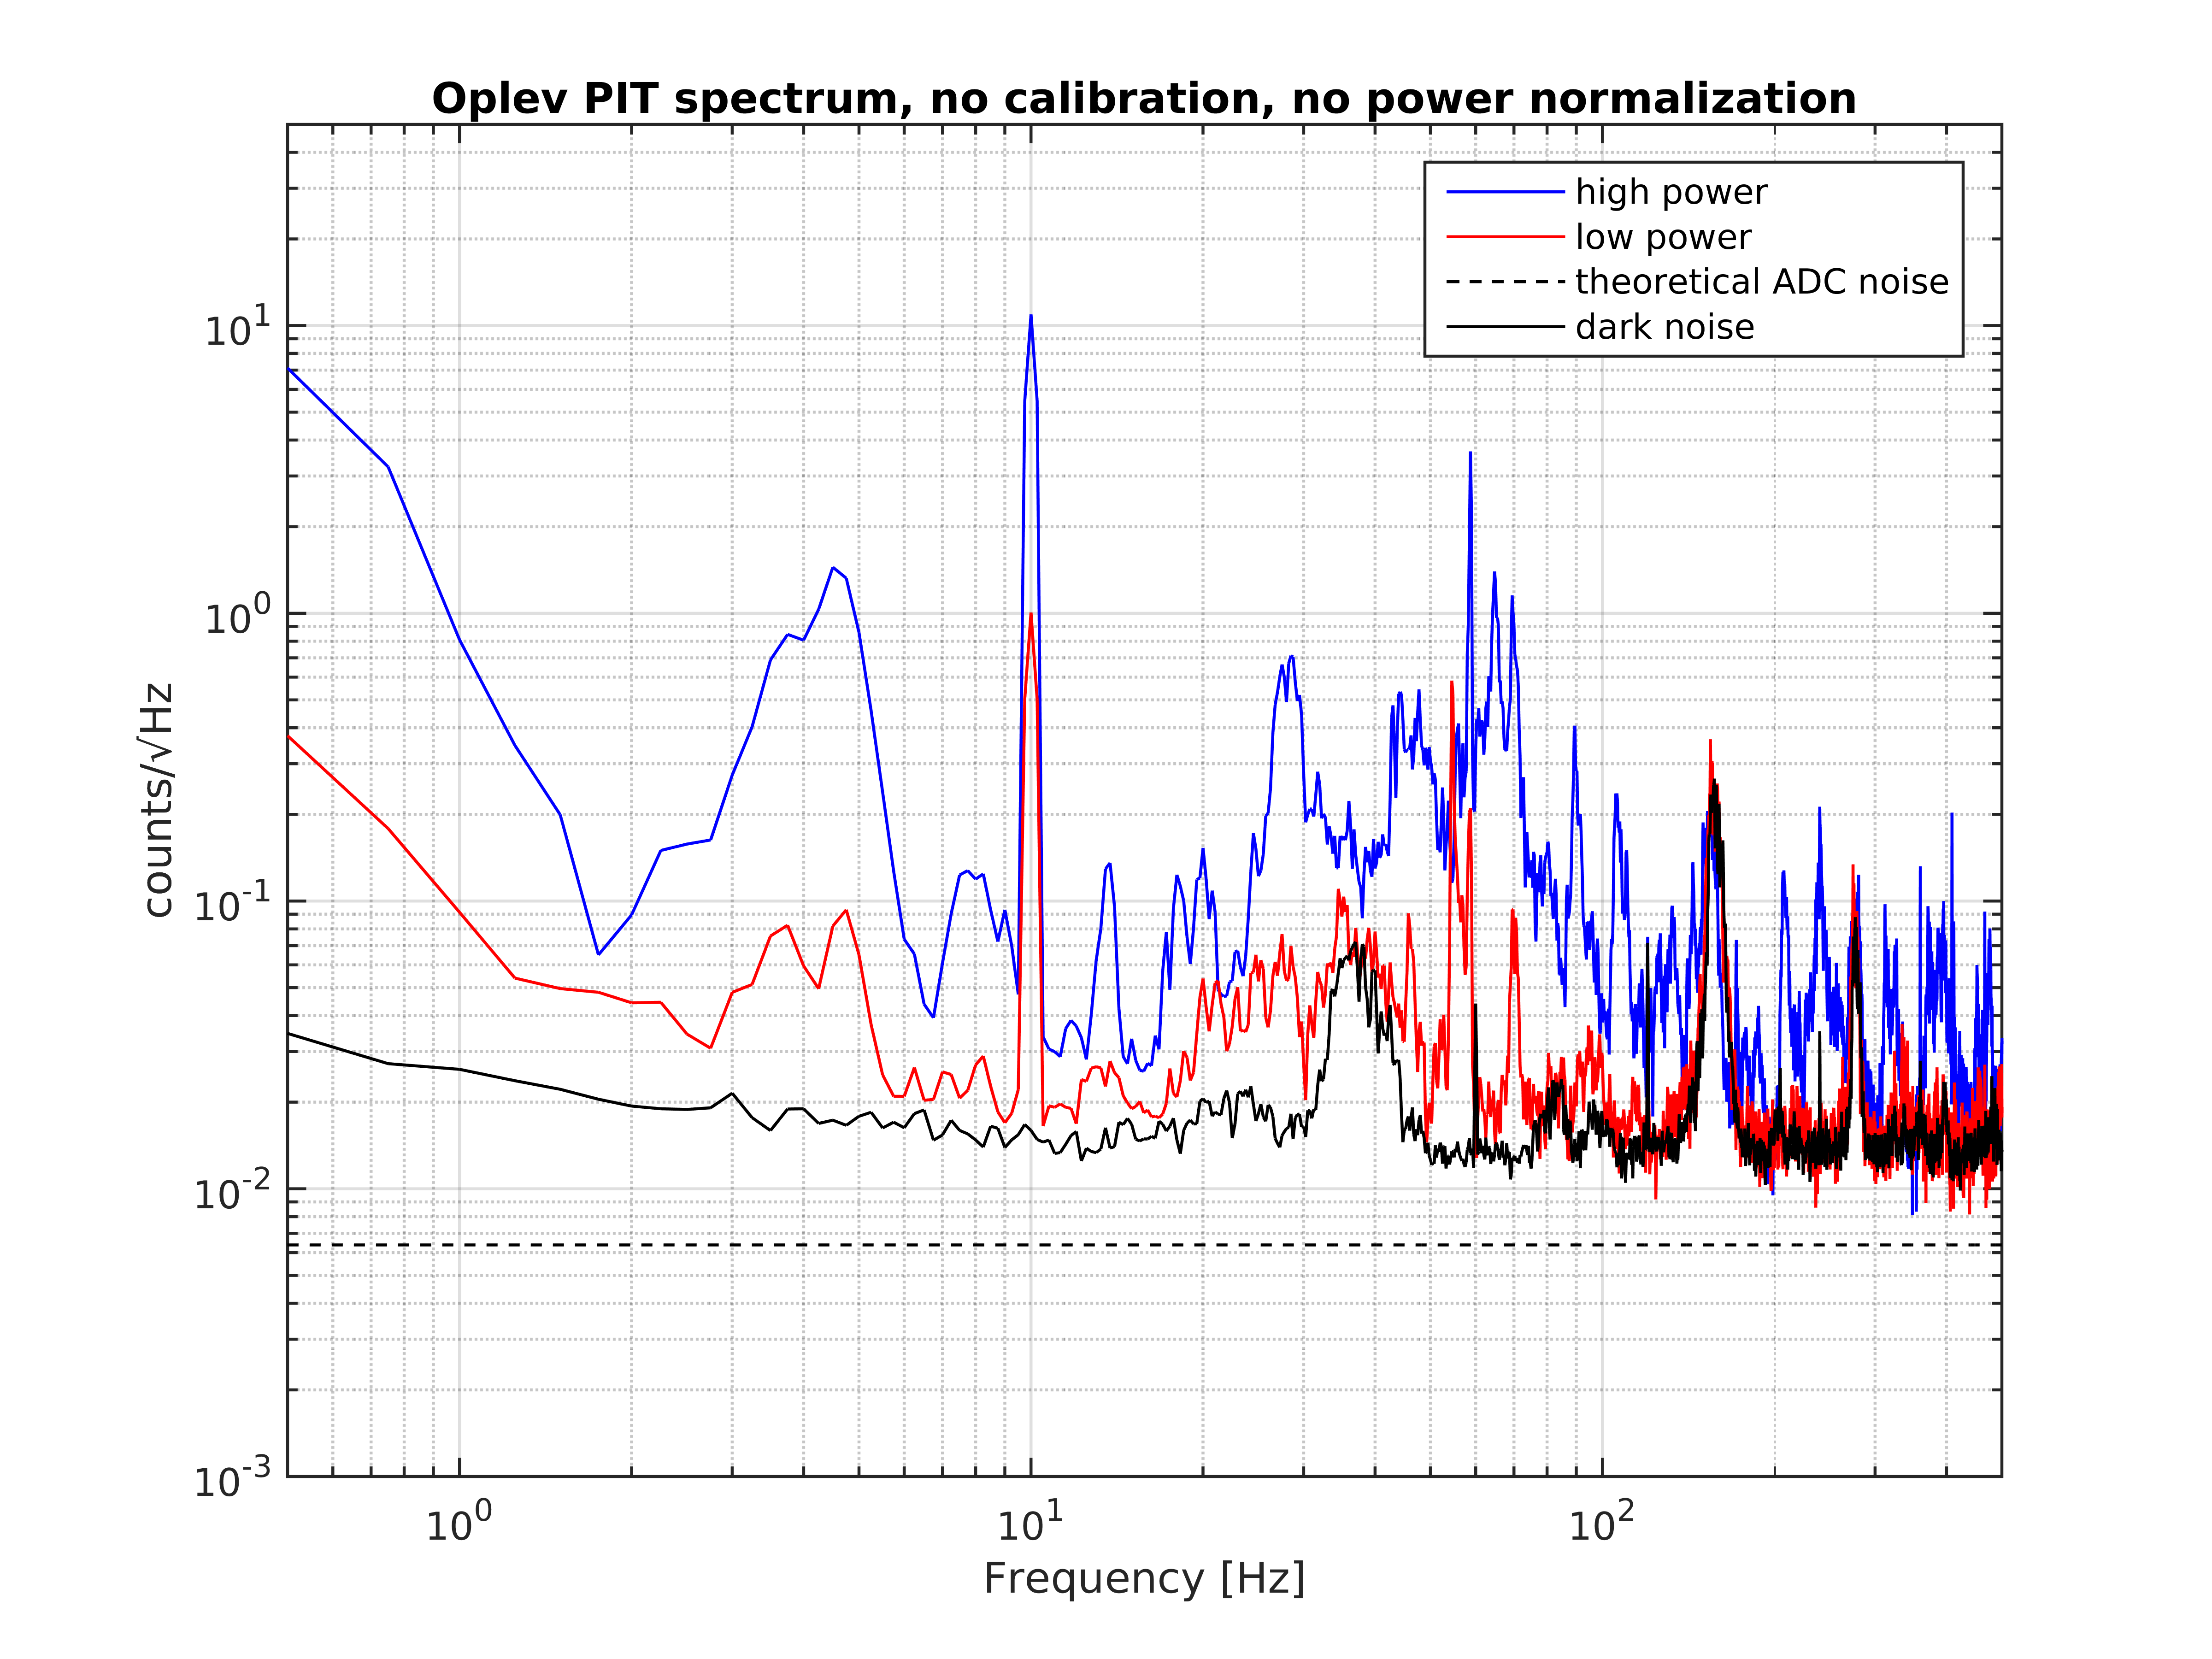
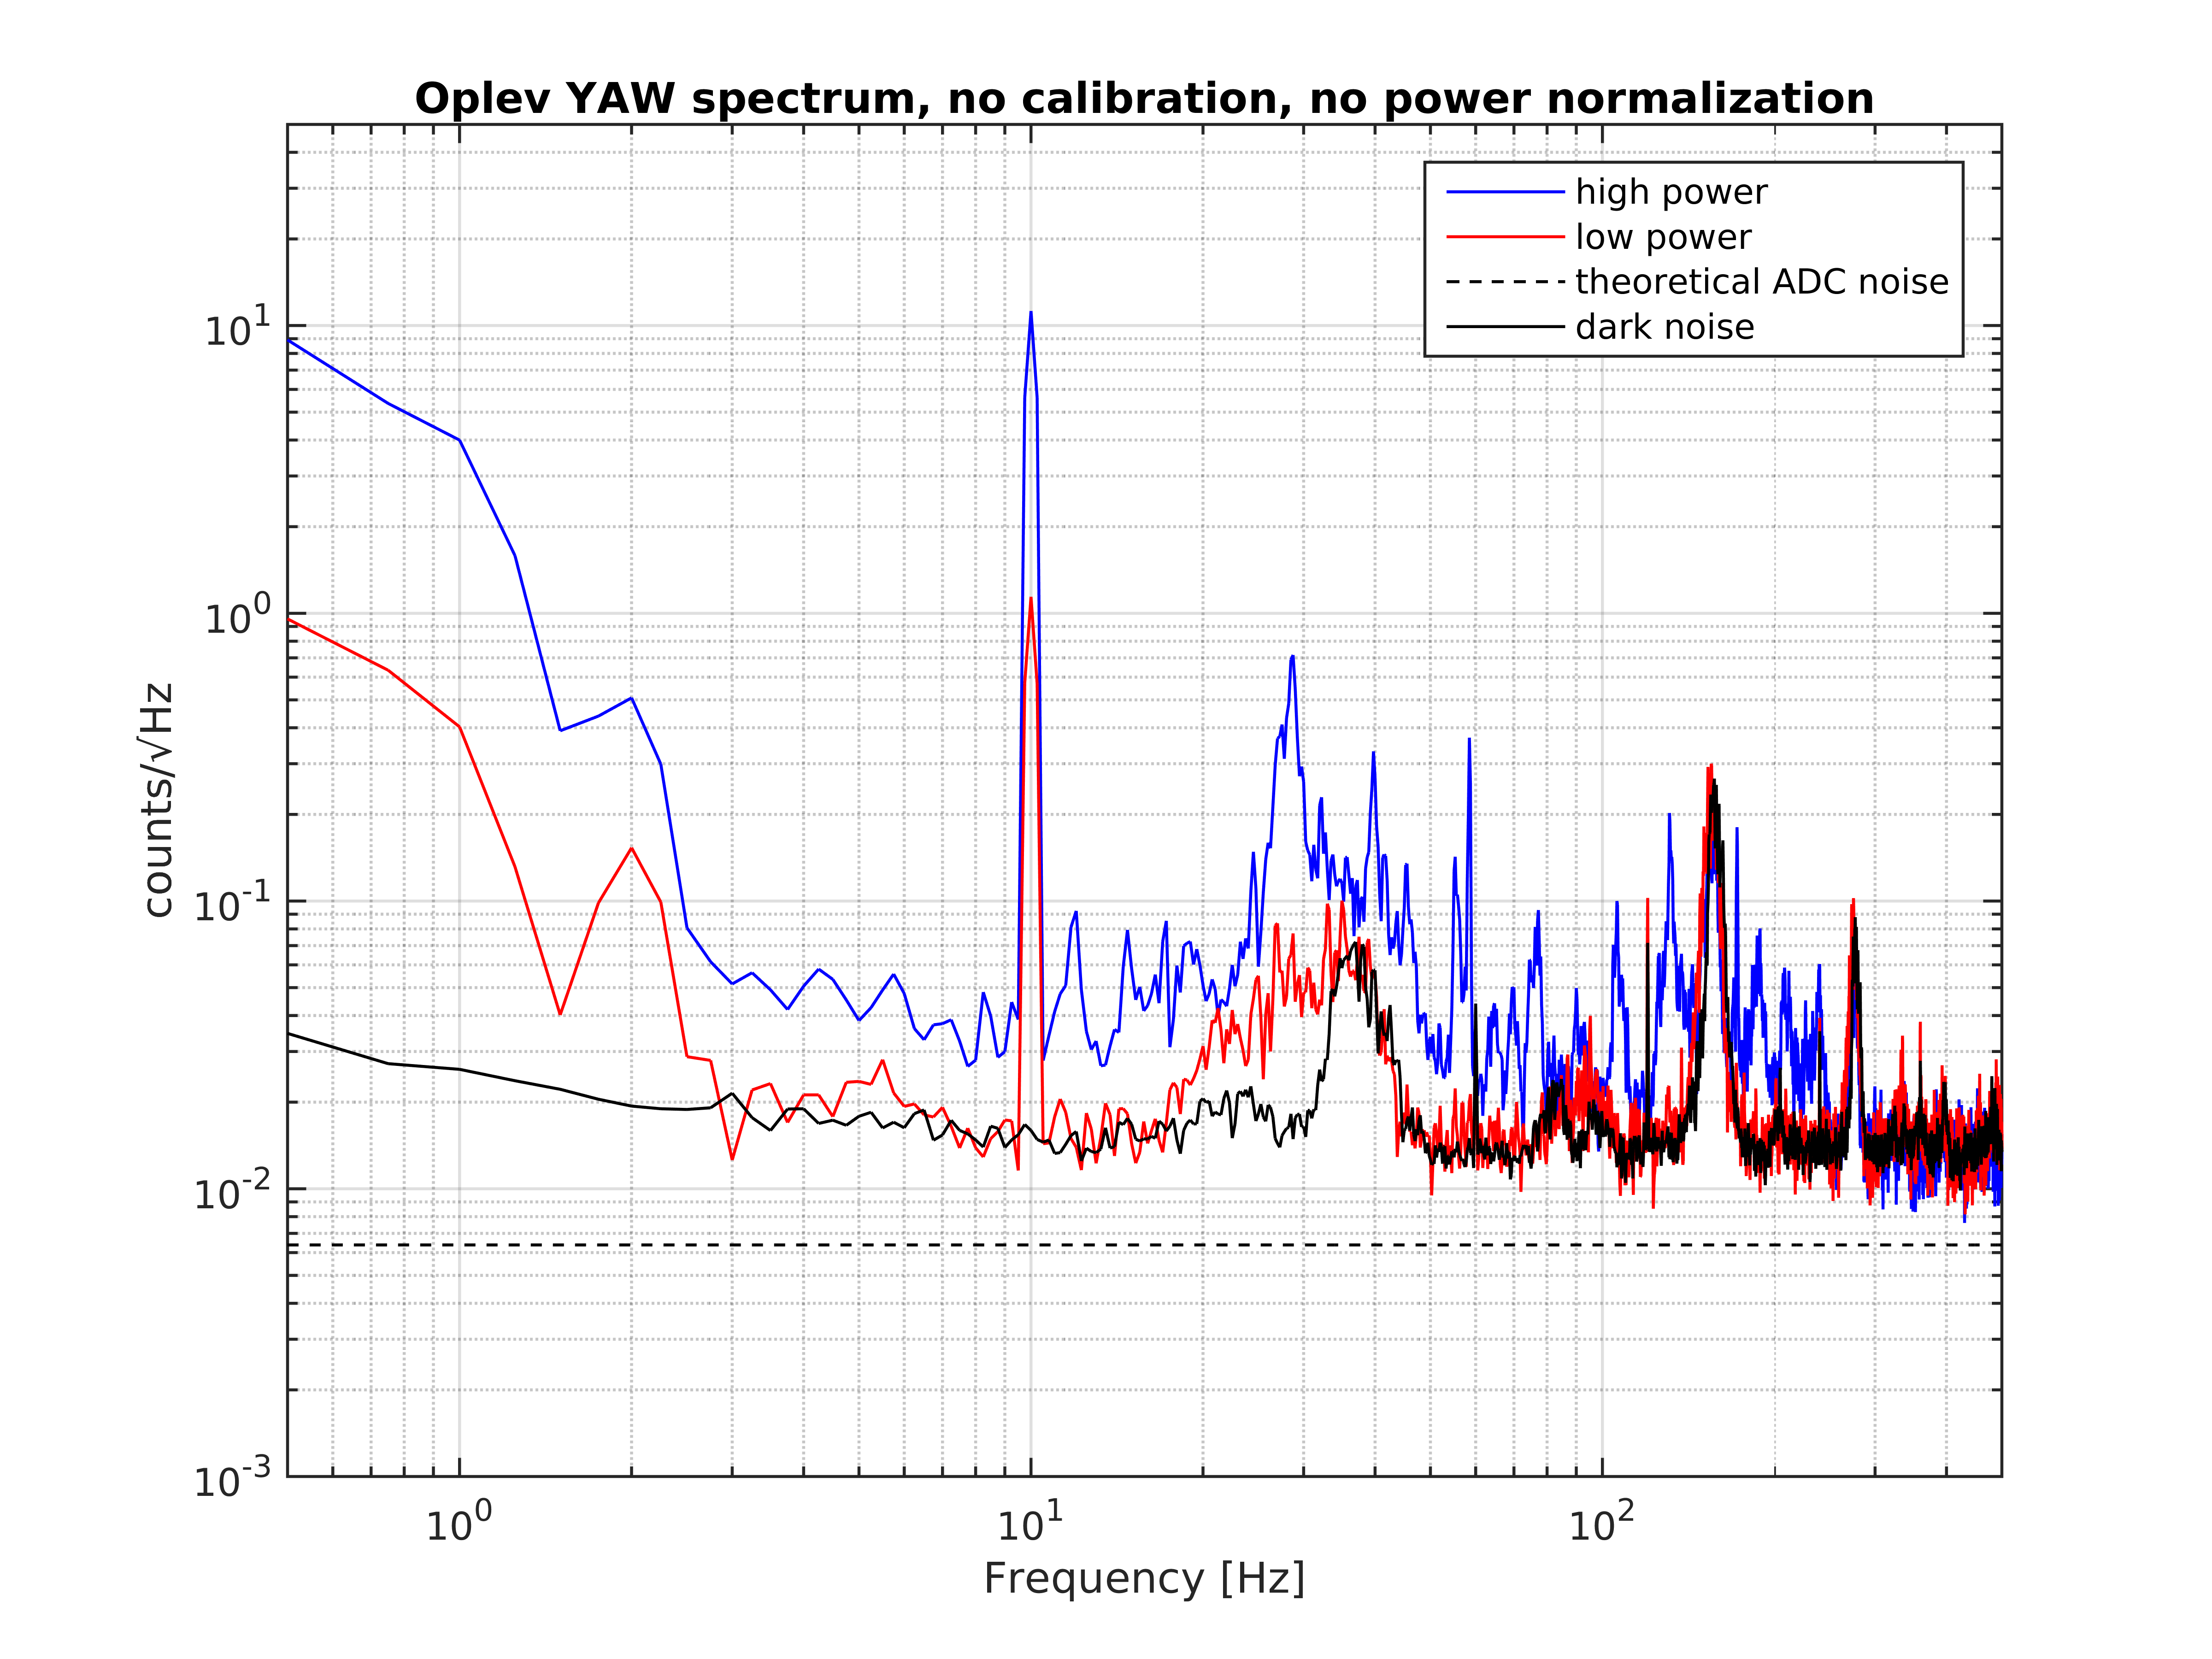
The limitation above 10 Hz in oplev spectrum was found to be the electric noise (which is the dark noise). We took the data of each QPD segments without oplev laser (dark noise), and square-sum the four segment data (=sqrt(SEG1^2+SEG2^2+SEG3^2+SEG4^2)) so to simulate the dark noise level in PIT/YAW spectra, in which the four segments are summed and subtracted. ADC noise was estimated as well and it was found not limiting the noise. See the attached plot.
In the plot, the curve labeled high power is the oplev PIT spectrum without any power normalization or calibration when the full power (SUM=19000). Same for ''low power'' when SUM=1700. 10Hz peak is a calibration peak. You can see the signal to noise ratio degrades when low power because the signal goes smaller whereas the dark noise level does't change.

