I am running out of ideas so I am just posting this and hope that the power of collective thinking can solve this mystery before I have a chance to anything else.
I wanted to measure properly the sensor noise of the sensors at the inverted pendulum stage so I asked Fabian to lock the IP. I proceeded to measure the sensor readout, together with the sensor correction signal as a reference of the current seismic activity level.
Attached future shows the measurements I obtained. It looks fine and like what I wanted to measure at first glance. However, taking a closer look, something's strange. The legend says that the yellow line is the sensor correction signal while the cyan is the LVDT H3 signal. However, from the plot itself, the yellow looks like the LVDT noise while the cyan looks like a sensor correction signal. Judging from the MEDM screen, I don't think there's internal wrong connections either in the hardware as well as the real-time model. My hypothesis is that there's a bug in the new software that we are using as this is the only variable. I could well be wrong. I don't know what's causing the swap and I am afraid to use the measurements because I don't know if any other measurements are occasionally swapped as well.
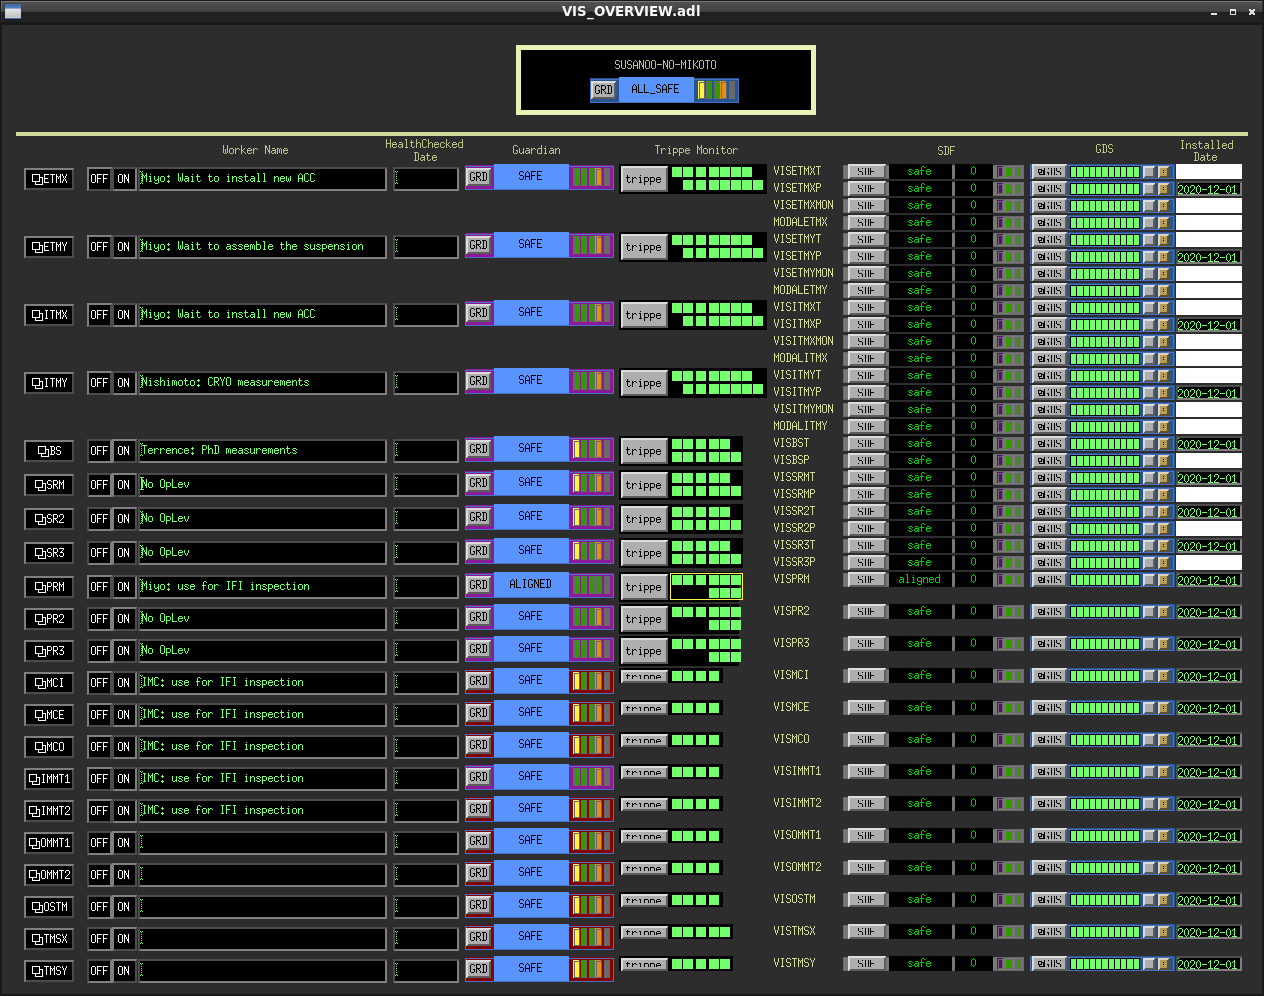
I couldn't test it now because some DGS error is preventing me from taking measurements from the BS. This is a separate issue. It seems that I cannot measure the SRM as well. I attached another figure which shows the error I encountered in the diaggui as well as the red indicators in the CDS screen.
Please tell me if I have done anything stupid to put myself into this situation, or if you know what's wrong. Thanks.


