Summary of OMC scans
Mode Matching to OMC, Measured finesse and FSR
| Mode match (a) | Ratio CR2nd/CR0th (b) | Finesse | FSR | klog# | |
| X arm locked data | 87% | 4.0% | 562 | 209 MHz | 14602 |
| Y arm locked data | 87% | 4.1% | 610 | 209 MHz | 14691 |
| IX single bounce | 79% | 11% | 613 | 208 MHz | 14694 |
| IY single bounce | 75% | 18% | 675 | 209 MHz | 14656 |
(a). Mode matching factor is a ratio between the carrier 0th order power to all the carrier modes (Pcarrir00 / Pall CR modes)
(b). Ratio between the Carrier 0th mode and carrier 2nd mode (product from mode mismatch)
Overall Finesse and FSR
Overall finesse is 208.9903 MHz (mean) with a standard deviation of 0.65054 MHz.
which correspind to 0.71725 m (mean) with a standard deviation of 0.0022389 m.
>>
Using all the carrier 0th peaks in one set of data (not posted), from all 4 kinds of the measurements,
- Overall finesse is 616.6675 (mean) with a std of 62.614.
- Overall FSR is 208.9903 MHz (mean) with a std of 0.65054 MHz. which correspind to the round trip length of 0.71725 m (mean) with a std of 0.0022389 m.
(std: standard deviation)
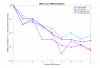
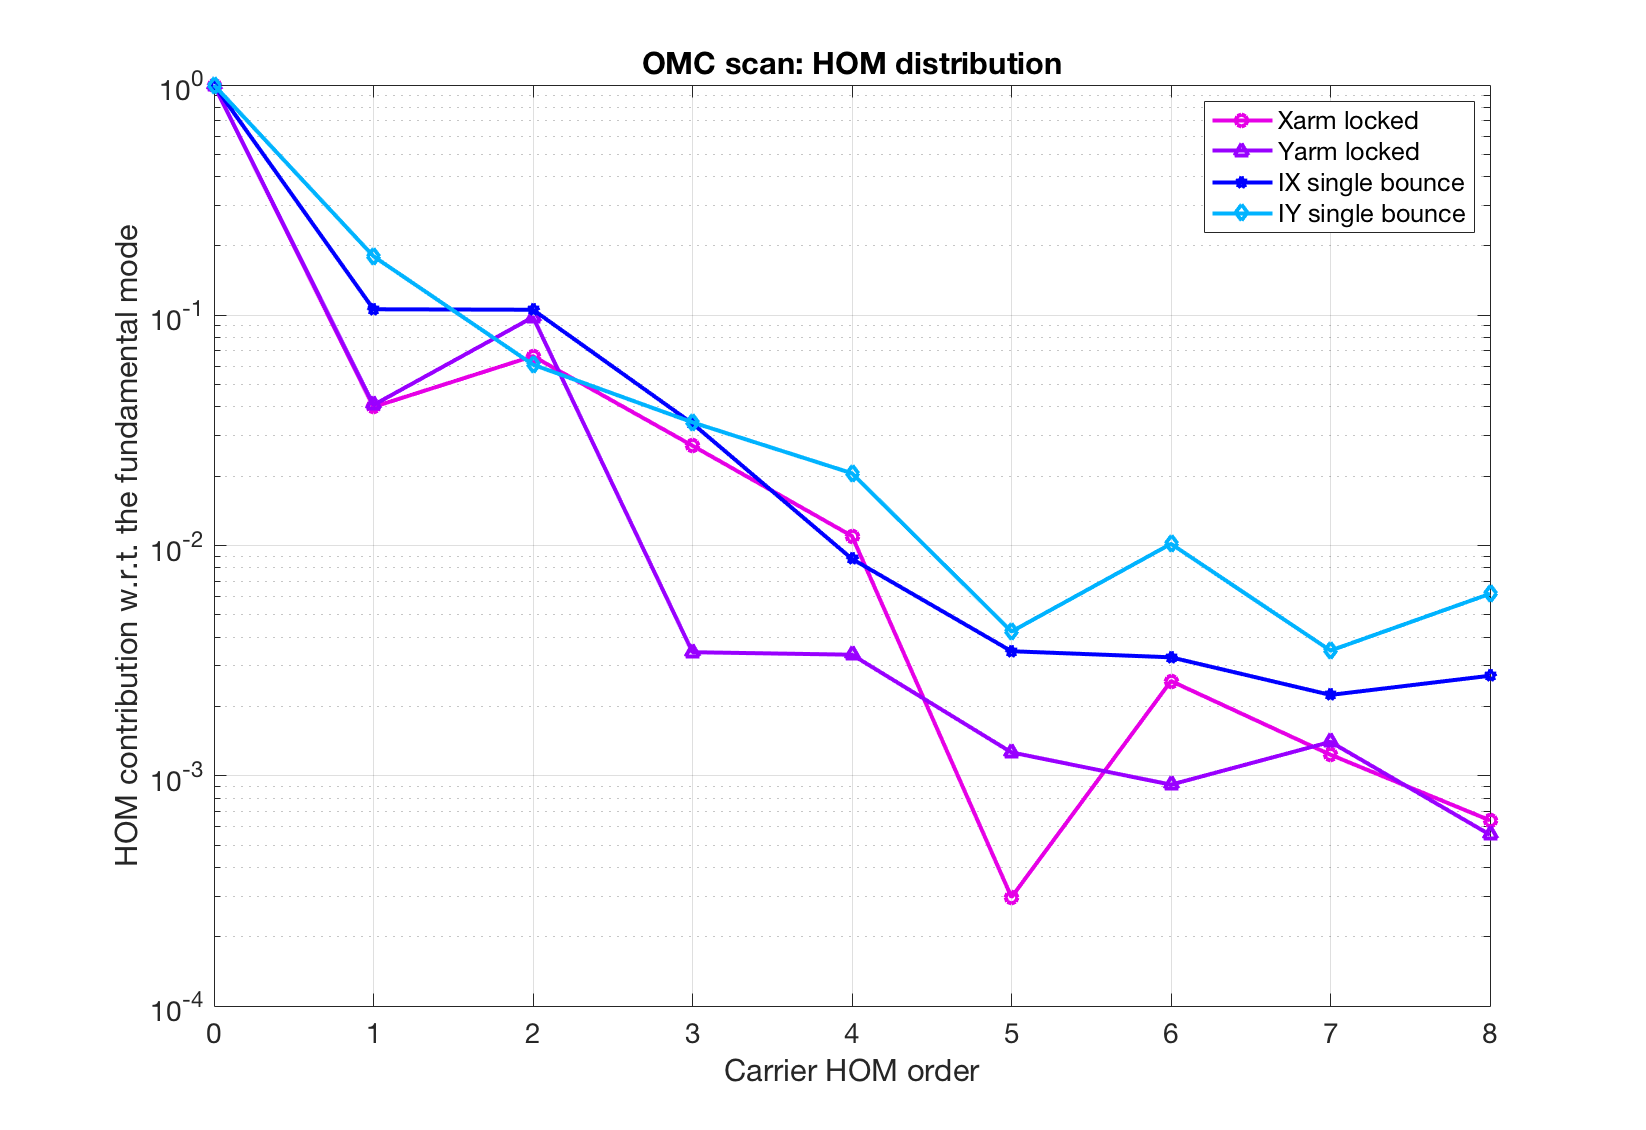
Contributions from HOMs
Please see the attachment. As expected, IX(Y) single bounce beams show more higher order mdoes espeically higher than 4th order. This may be due to the birefringences.