Reports 1-1 of 1 Clear search Modify search
VIS (SR2)
fabian.arellano - 18:14 Thursday 21 May 2020 (14413) Print this report
Decay time measurements.

I began measuring the decay times of the supension.

The files are in the following directory:

/kagra/Dropbox/Subsystems/VIS/TypeBData/SR2/quality_factors/

Comments to this report:
fabian.arellano - 15:37 Friday 22 May 2020 (14415) Print this report

Today I continued with the measurements.

Pending review of the quality of the data which may suggest repeating a measurement, I have finished the measurements with the control system on.

I still need to do the measurements with the control system off.

fabian.arellano - 18:06 Tuesday 26 May 2020 (14427) Print this report

Today I continued with the measurements of the decay times. I turned the control system off today.

fabian.arellano - 16:38 Wednesday 27 May 2020 (14430) Print this report

Today I continued the day time measurements.

fabian.arellano - 17:30 Thursday 28 May 2020 (14435) Print this report

Today I continued the decay time measurements.

fabian.arellano - 13:17 Friday 12 June 2020 (14510) Print this report

In case you do't see the plots press here: 14510.

Highlights

  • I measured the decay times of 25 resonant modes with the control system on and off. The resonant frequencies were selected from measured force transfer functions and free swing displacement amplitude spectral densities (ASD).
  • With the control system on the decay times of 24 modes are below 60 seconds. See first picture.
  • The exception was the IP-L mode at 406 mHz: with the control system on the decay time is 35 seconds longer than with the control off. The corresponding data point is indicated by the arrow in the picture. This is likely due to injected noise because it was found that in the ASD the peak at such a frequency is 7% higher with the control on. See second picture.
  • The first measurement for the IP-L mode at 406 mHz was done in a day with a relatively high microseismc condition but it was repeated when the micriseismic was low, yielding a similar result. Therefore, the seismic condition can be ruled out as the cause.

Highlights which are a byproduct of the measurements

  • The resonant frequency in IP-L is not what was expected from previous measurments. It used to be 55 mHz, now it's 70 mHz. This was confirmed with transfer function measurments and the free swing spectra. This may be due to temperature change but more investigation is needed.
  • Asymmetry was found in the IP: the resonant frequency in IP-T is different to the one in IP-L, namely, it's not at 70 mHz but at about 86 mHz according to free swing spectra with 5 mHz resolution. See third picture.
    • Maybe this would be a good chance to look for the craddle effect in the IP.
    • Depending on the plans for temperature control we might want to add more weight to the IP in order to reduce the resonant frequency.

Method

(Code referred to below is commented and the details can be found there.)

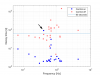
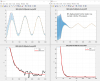
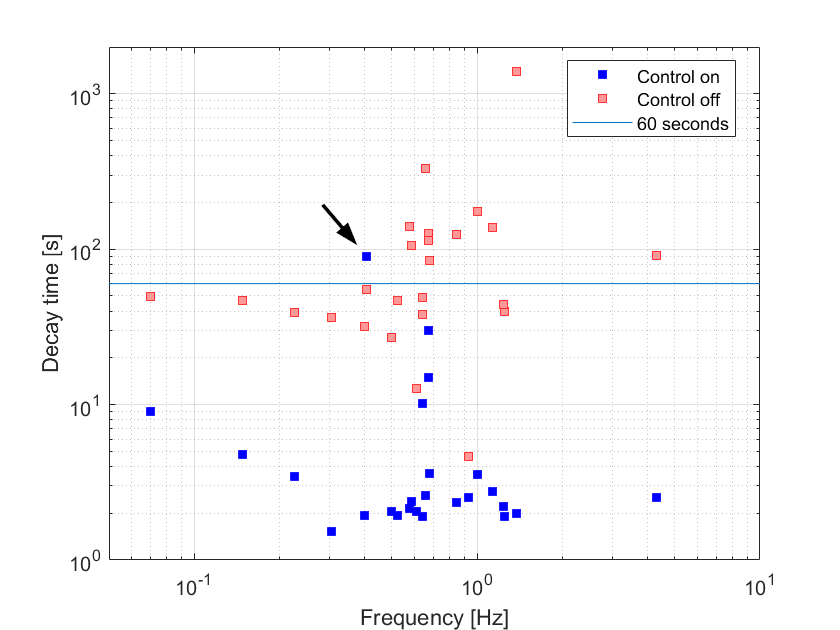
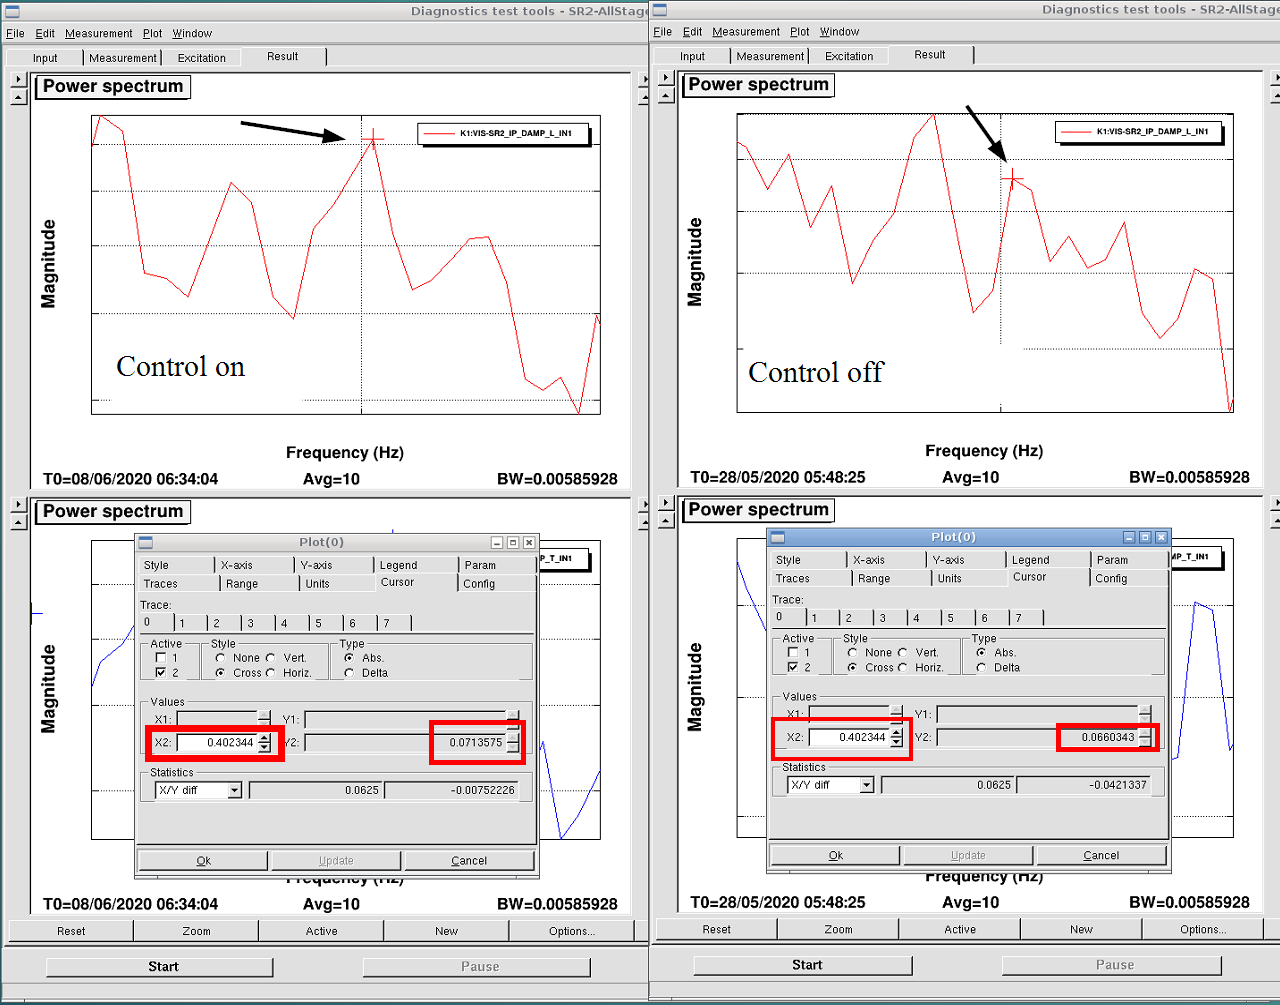
The envelope of the decaying oscilation was calculated using the Hilbert Transform in Matlab and then a decaying exponential was fitted to the envelope. In general, this method worked becuase in most of the cases the amplitude of other resonant modes present were not large enough to create a problem. The plots for each case can be seen by running the script indicated below. In some cases there were oscllations at lower frequencies whose amplitudes precent me frok using the same method. In those cases I used two approcches. One approach was to fit a sinusoidal fuction to the data and then substract the fitted curve to the data. This worked in two cases in which the sinusoidal fit was very good (BF at 226 mHz and 609 mHz with control on), but it failed when the fit wasn't good due to the presence of more modes (same modes with control off). In these more challenging cases I changed the method to calculate the envelope. The envelope was made to follow the higher frequency peaks and troughs only and the decaying amplitude was then characterized by the difference between the high and low envelopes. See fourth picture.


Directories and files

/kagra/Dropbox/Subsystems/VIS/TypeBData/SR2/quality_factors/

Experimental data

/kagra/Dropbox/Subsystems/VIS/TypeBData/SR2/quality_factors/decay_times/

Data files and scripts. The main script is decay_times_main.m

(Files haven't been moved to this location yet.)

Images attached to this comment
fabian.arellano - 15:38 Tuesday 16 June 2020 (14550) Print this report

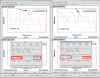
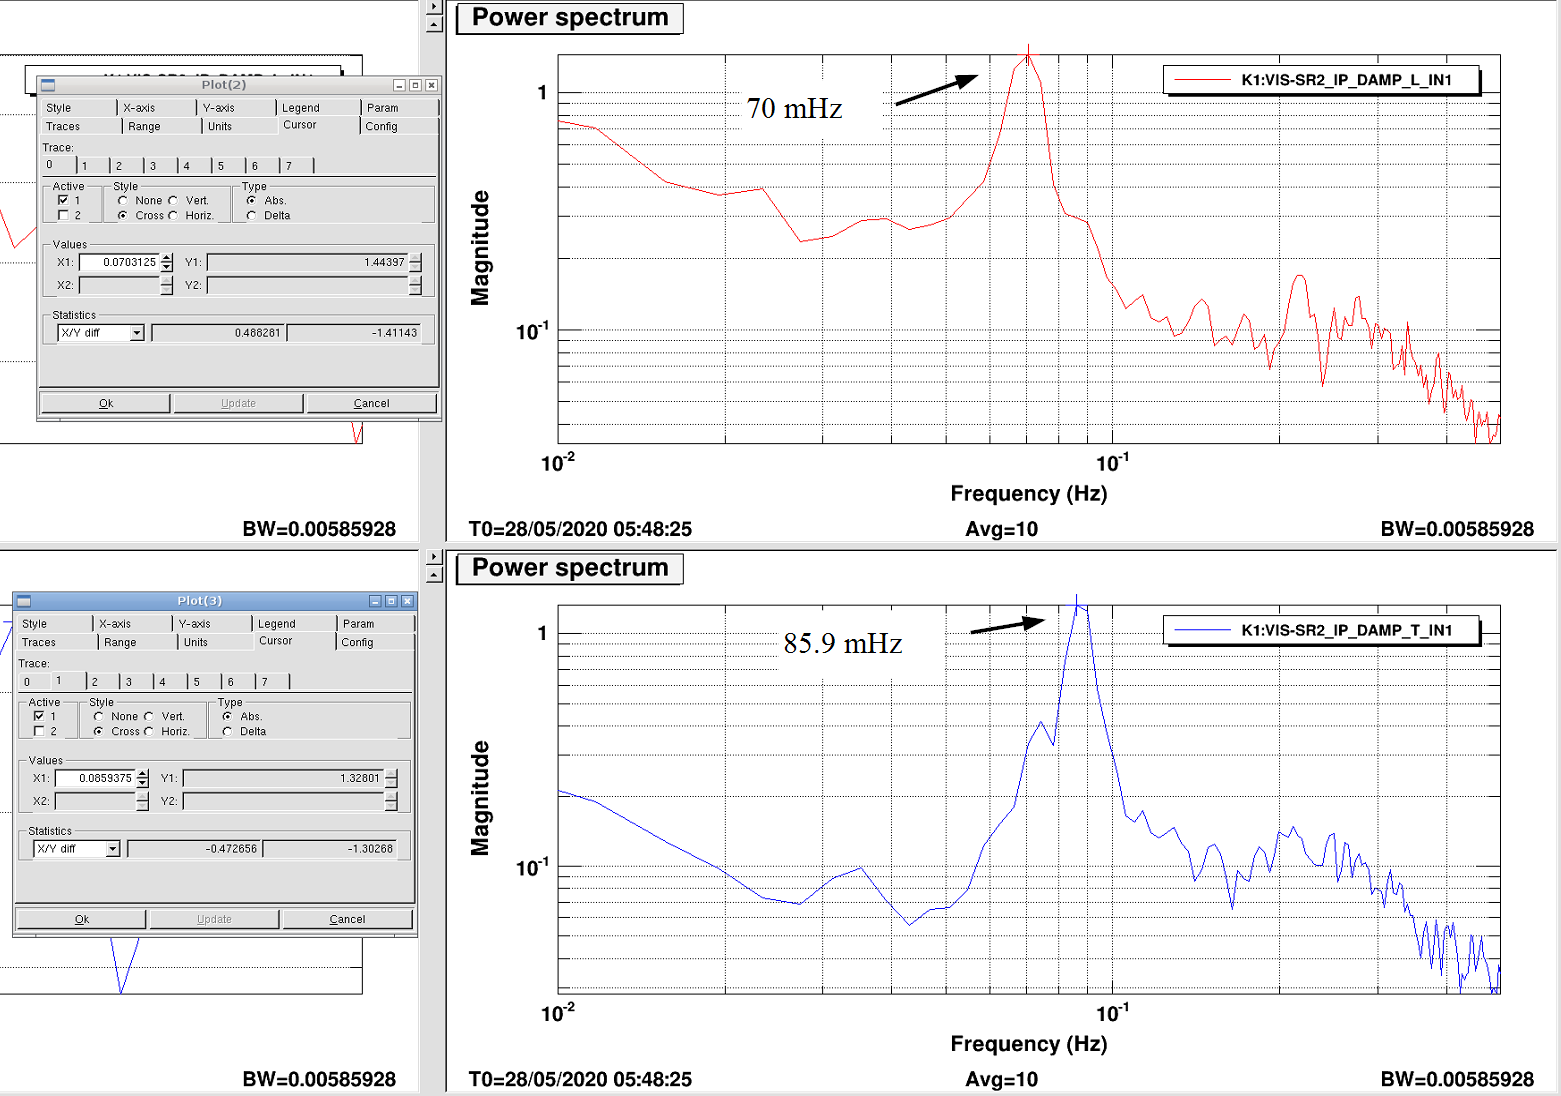
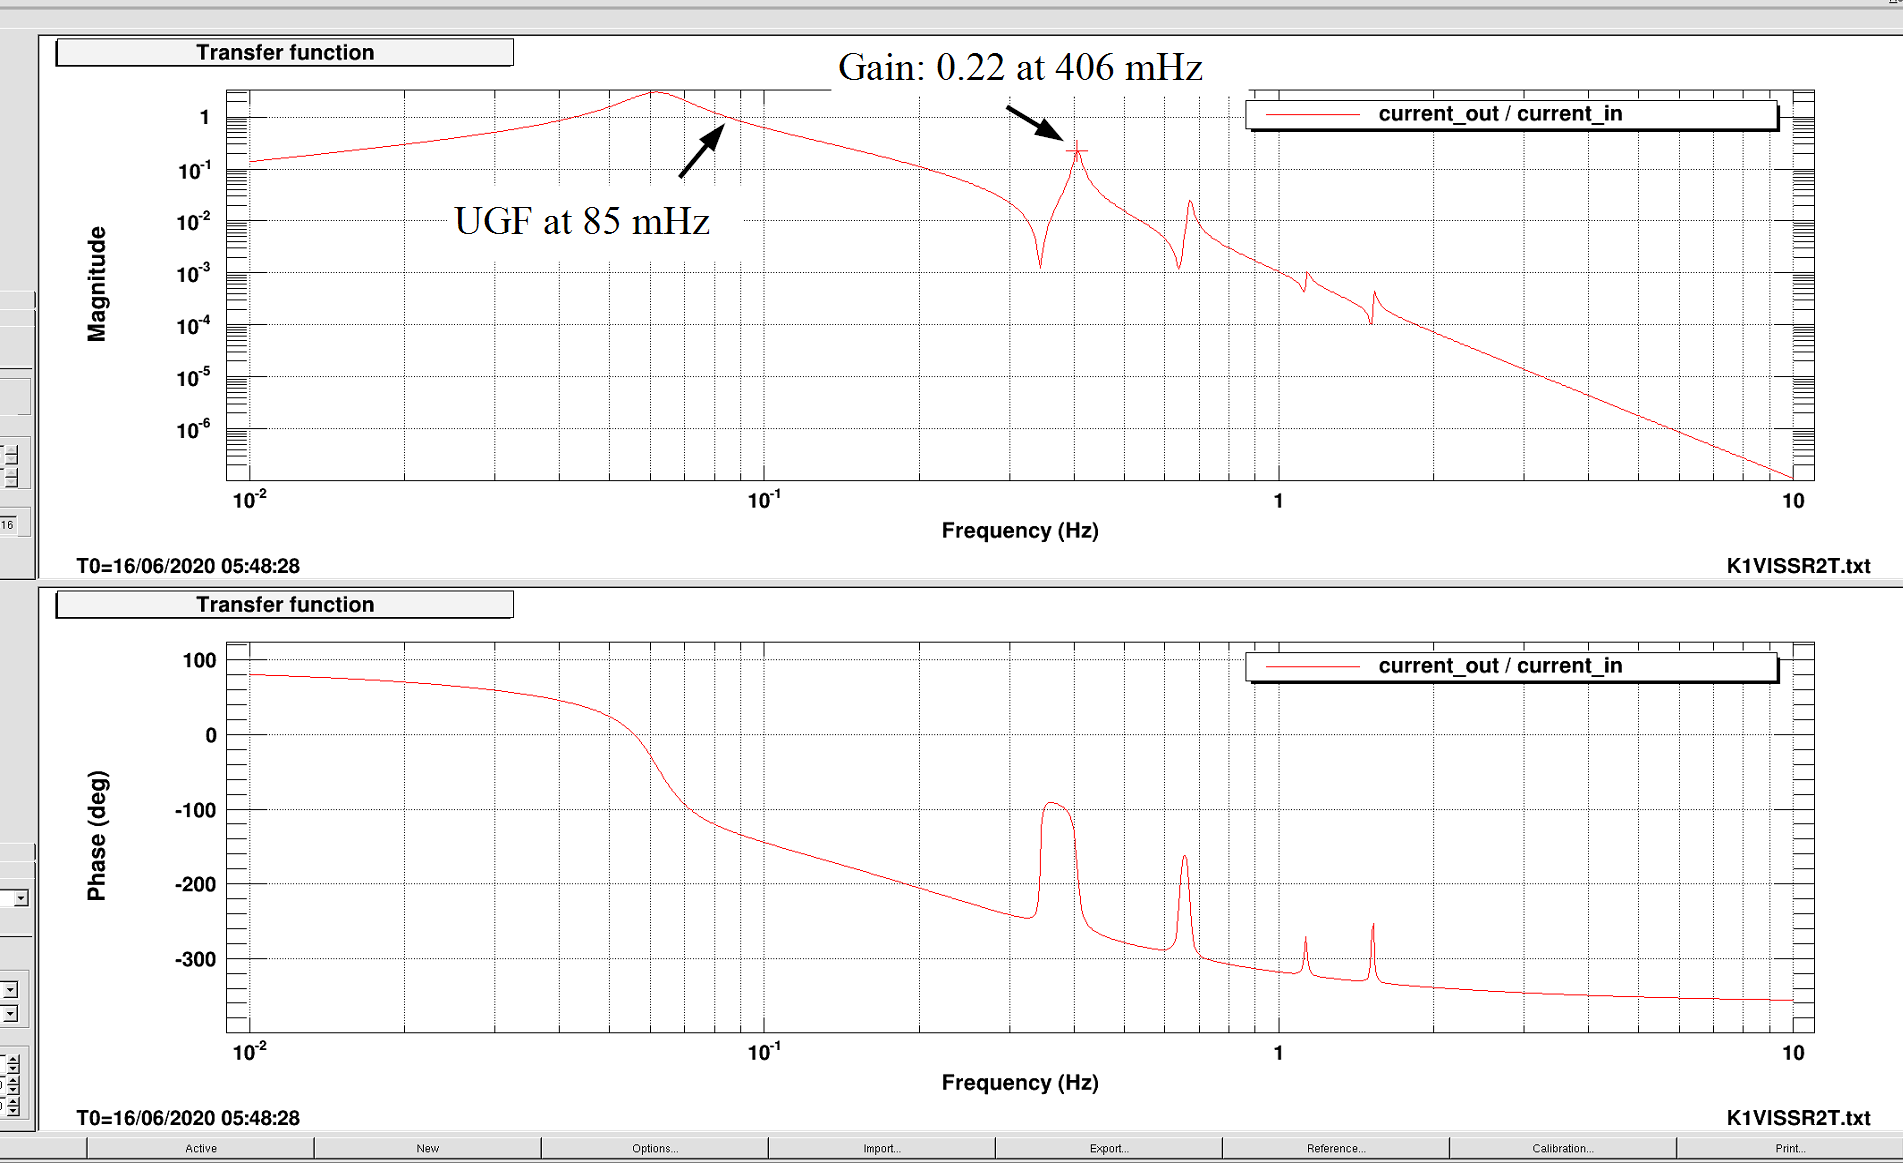
Concerning the IP mode at 406 mHz (measured in IP-L) in which the decay time was longer with the control system on, I checked the value of the unity gain frequency. It's 85 mHz as shown in the figure.

If the anomaly comes from the control system I should try to prove it by putting a notch at 406 mHz in the control filter and then repeating the measurement.

Images attached to this comment
fabian.arellano - 11:22 Friday 19 June 2020 (14574) Print this report

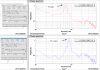
Accordingly to the commented entry, yesterday I added a notch in the IP-L damping filter at 406 mHz. The notch has a quality factor of 10 and a depth of 40 dB.

  • I repeated the measurement and the decay time reduced 40 seconds! Now the decay time with the control system on is 5 seconds shorter than with the control system off.
  • The new mystery is the mode in IP-L at 671 mHz. The UGF is 85 mHz and, therefore, the control system should not be damping this mode. However, it seems it does: the decay time difference between having the control system on and off is 81 seconds.

I shoud add a notch at 671 mHz to check the behaviour.

Search Help
×

Warning

×