Summary for the day
- Good observing duty cycle
* 85621 seconds on observing mode
* Duty cycle for the day is 99.1%
* Average lok time is 389.50 seconds
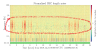
* There were only two lockloss at 2019-12-21 16:30(UST) for 331 seconds(1260981230-1261001711)
and 2019-12-21 22:30(UST) for 448 seconds (1261002159-1261008018)
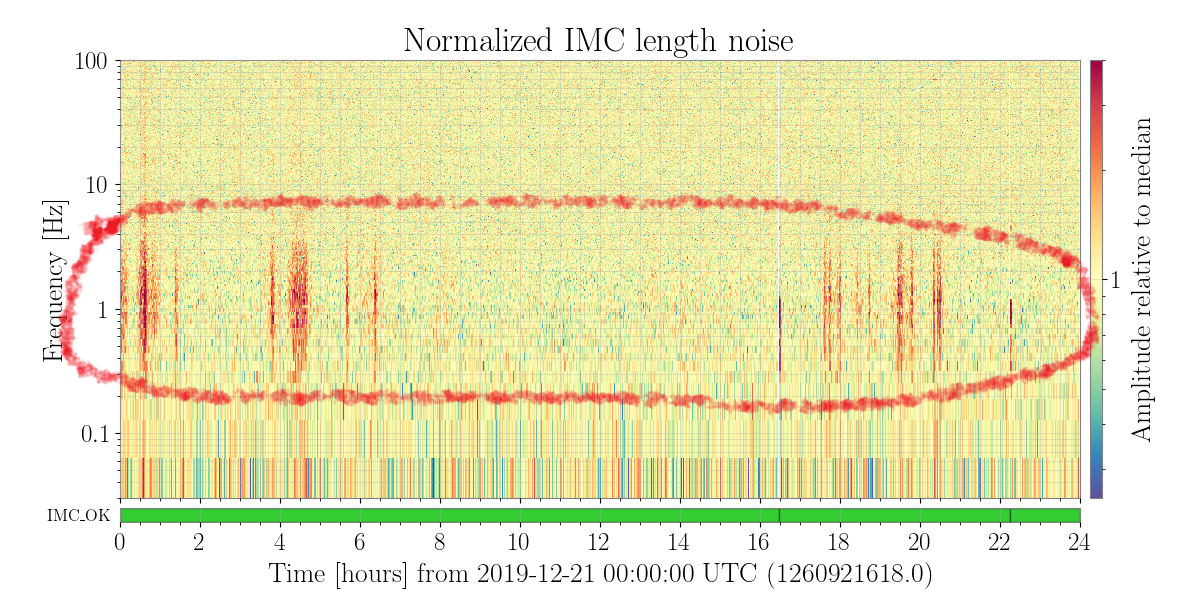
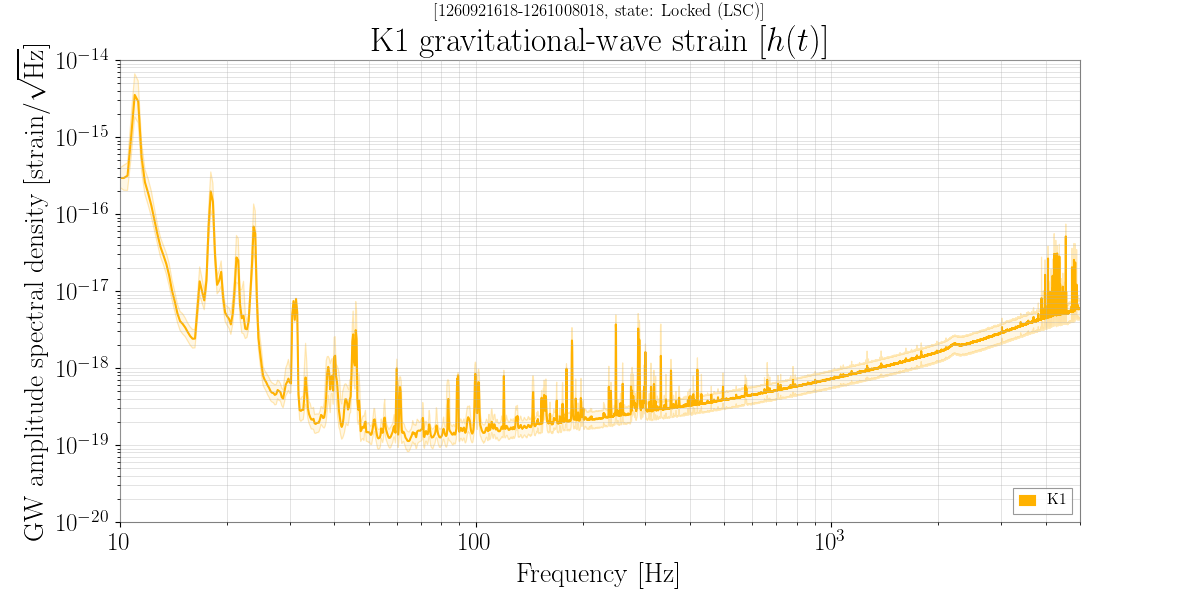
- Mean BNS range changes between observing blocks(by eye)
* First block : 7kpc
* second block : 8kpc (actually h(t) shows lower amplitude, see attached graph)
* third block : 7.5 kpc
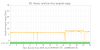
[LSC_LOCK state]
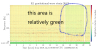
- almost all period is green light except two lockloss
[K1 online DQ]
- almost all period is green except two lockloss
- SDF flag was always red
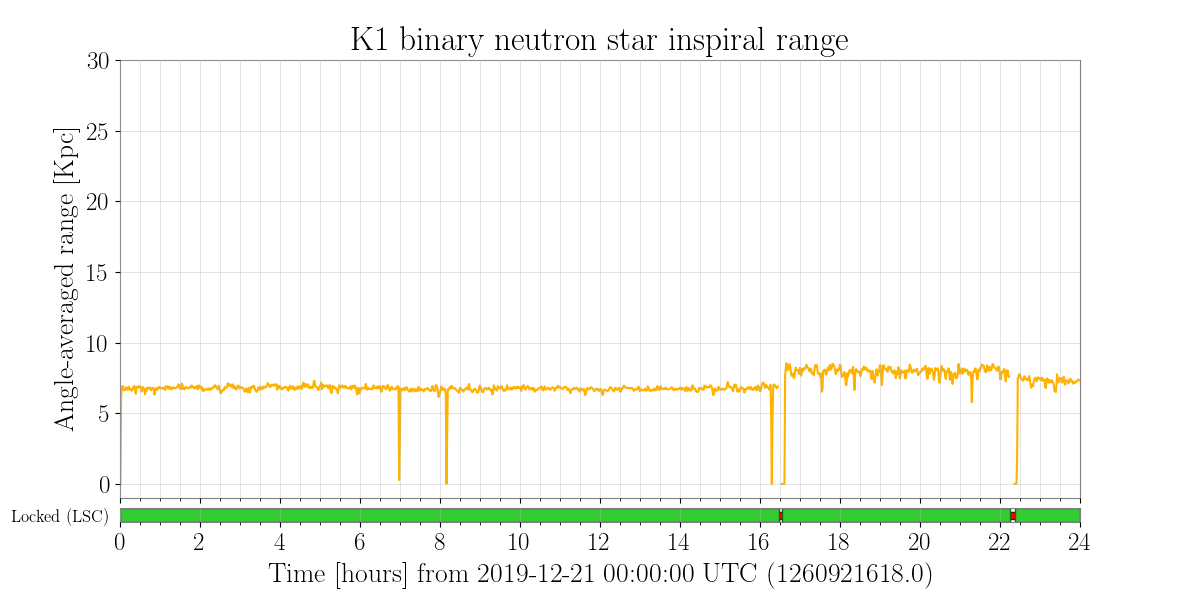
[K1 GW starin]
- no significant change is amplitude spectral density between observing blocks
- the cecond block shows lower relative amplitude -> higher BNS range
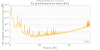
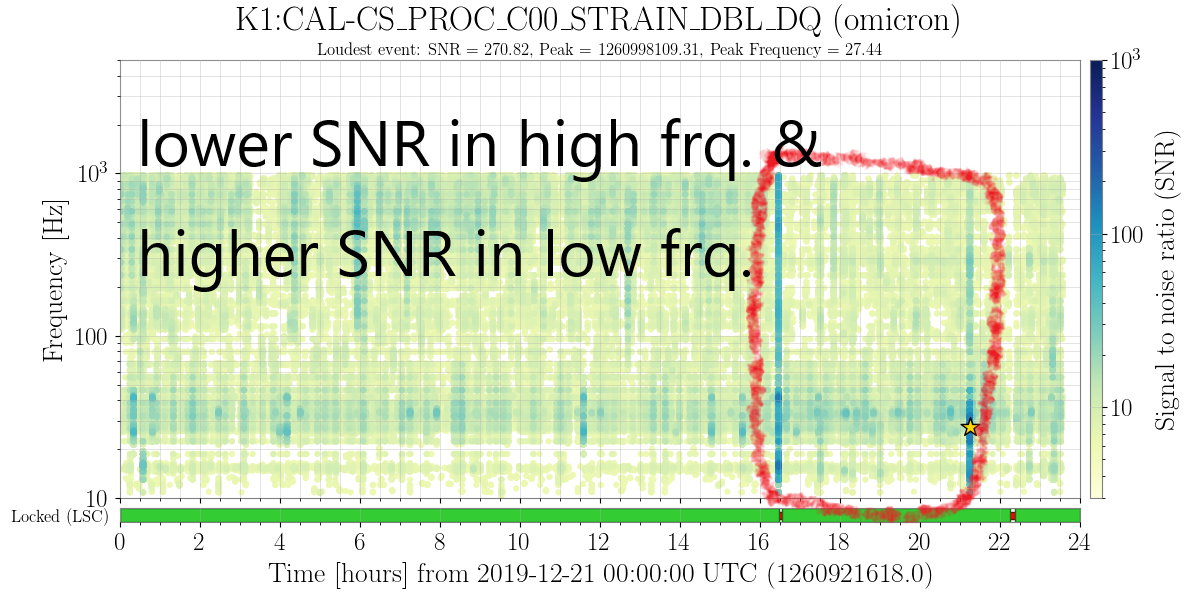
[K1:STRAIN_DBL_DQ(omicron)]
- SNR for > 50Hz in the second/third block is lower than the first block
and SNR for 20Hz~50Hz in the second block is higher than the first block(see attched graph)
[glitches]
- does not show any significant clusters for all the time
[Lock-glitches]
- the first lockloss is occured after large SNR cluster at 2019-12-21 16:28
- but the second lockloss at 2019-12-21 22:15 DOES NOT show any high SNR glitches
- no record from 2019-12-21 23:34 to 24:00 (missing or no data?)
[CAL-summary]
- does not show any big difference
[CRY-status]
- all status is green
- EX temperature is increased lineary(now 293.5K MNR).
- EY temperature is kept almost constant.
- IX, IY temperature is very stable. IY, EX, EY are not cryogenic temperature
[DetChar-Fscan]
- CAL-DARM there are unit count differences between observing blocks
- CAL-DARM shows very clean line at 3587Hz, 3018Hz,1789Hz.
- CAL-IMC does not show significant unit count differences between observing blocks
- CAL-IMC graph shows many vertical lines
- CAL_MICH still shows repeated peaks around 1900~2400Hz
- CAL-STRAIN there are unit count differences between observing blocks
[DGS-ADC STAT]
- LSC-ADC-1 : two overflows at lockloss at 2019-12-21 16:30 and 22:15(UST)
- ALS0-ADC-0 : two overflows at lockloss at 2019-12-21 16:30 and 22:15(UST)
- IOO-ADC-1 : two overflows at lockloss at 2019-12-21 16:30 and 22:15(UST)
- IOO-ADC-3 : two overflows at lockloss at 2019-12-21 16:30 and 22:15(UST)
- IOO1-ADC-0 : two double overflows at lockloss at 2019-12-21 16:30 and 22:15(UST)
- EY0-ADC-0 : There are many overflows
[DGS-CPU]
- actually I do not know what does it means, but Other(PX1) graph shows larger values with respect to others
[DGS-DAC STAT]
- everything is fine no problem
[GIF]
- there is no significant peaks
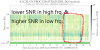
[IMC]
- do not show ant strange behaviour
- TRANS and REFL power shows abrupt change at two lockloss times
- there is not record for PMC error signal
- there are some length noise cluster around 0.2Hz ~ 3Hz
- there are three spectral lines in FFT signal at 15Hz, 30Hz, 45Hz
[ISC]
- yaw control signal shows big peak at lockloss times
- AS_QPDA1 also shows two peaks at lockloss
[QPD]
- these signals show abrupt change at lockloss times