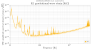
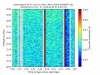
[sensitivity curve]
There is not special features. It is almost same as previous one.
The minimum sensitivity is around 1.5X10^{-19}.
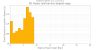
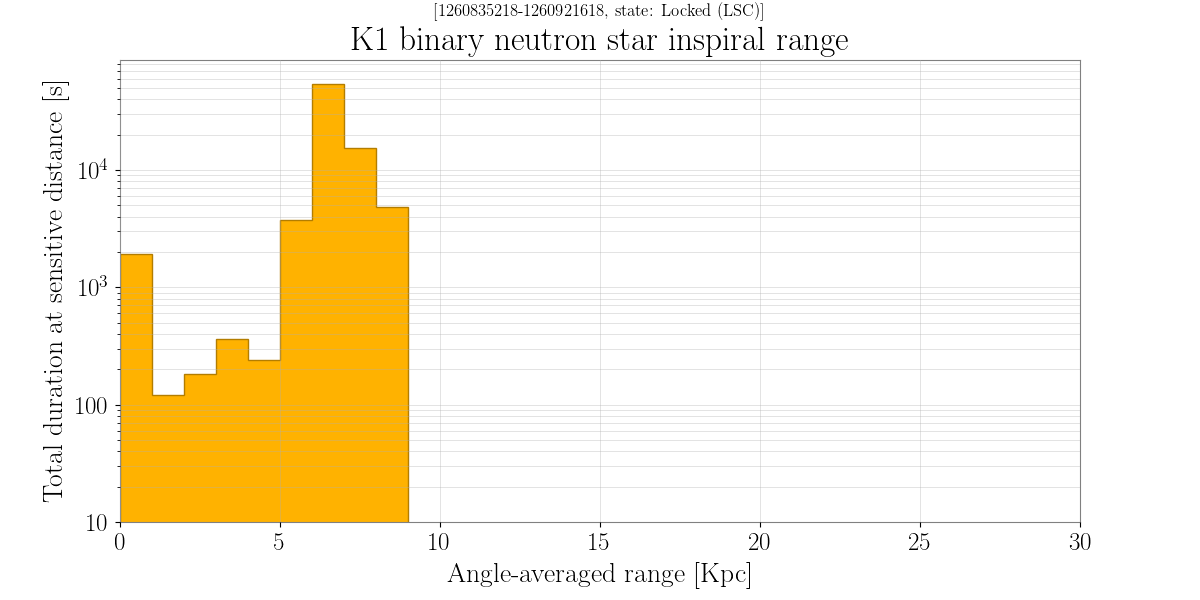
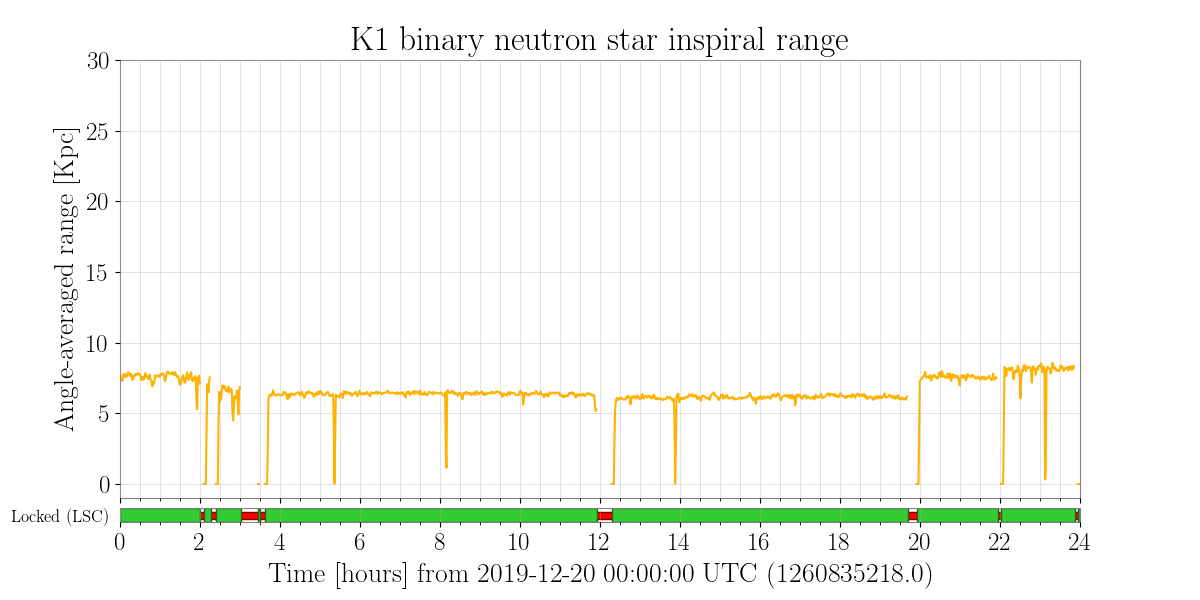
[BNS inspiral range]
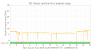
during period of 2019-12-20 00:00 and 2019-12-21 00:00(UST) BNS inspiral range was stable.
inspiral range start(00:00 UST) around 7.5kPc and going down to 6.0kPc.
It seems to give one day period oscillation between 6.0 ~ 7.5kPc.
range distribution is attached.
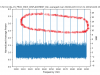
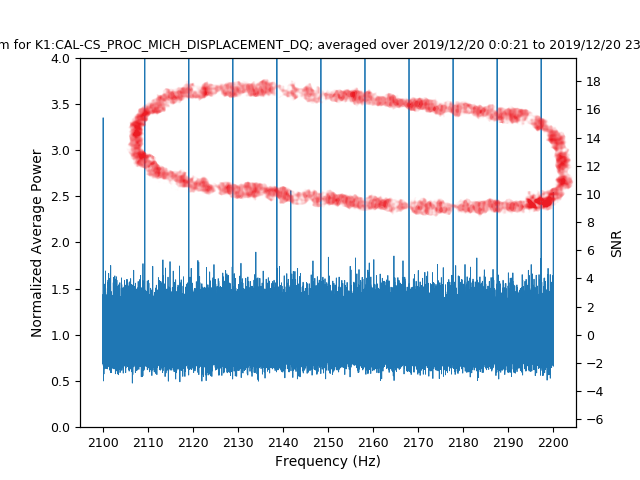
[Fscan]
There are many spectral lines as follows.
40, 45, 100, 120(very clean, seems to be artificial), 130, 145Hz
and many more. see more details at https://gwdet.icrr.u-tokyo.ac.jp/~controls/fscan/summ/fscans_2019_12_20_09_00_00_JST/K1_CAL-CS_PROC_C00_STRAIN_DBL_DQ/fscanK1_CAL-CS_PROC_C00_STRAIN_DBL_DQ_K1_1260835218_1260921618.html
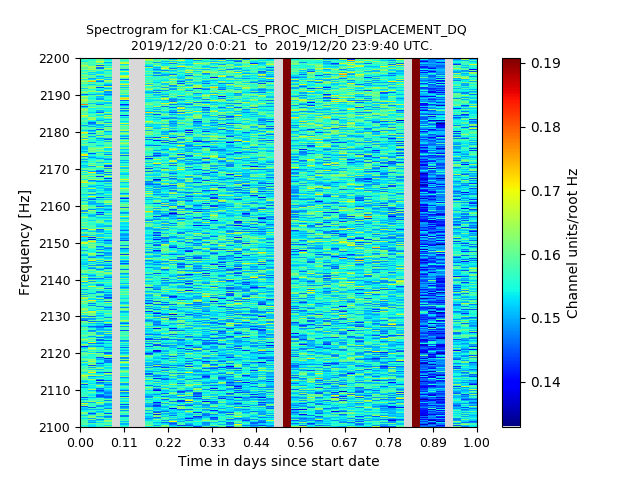
-CAL_MICH shows very regular peaks around 1900~2400Hz.
-CAL-IMC does not show any particular peaks.
-CAL-DARM and CAL-STRAIN shows many irregular peaks at lows frequency
[Lockloss status]
It was observation state for 80917 secs out of 86400, 93.7% duty.
There were total 8 locklosses at 2019-12-20,
Longest one is 1548 seconds between 1260847641 and 1260847838.
Second one is 1298 seconds between 1260879482 and 1260906175.
Minimum one is 316 seconds between 1260921482 and 1260921618.
Average lockloss time is 685.48 seconds.
[Glitches]
Loudest glitche is at 1260841971.965 UST, duration=0.008, SNR=256.930, Frequency = 32.153
[PCAL]
PCAL X and Y gives peaks at different frequencies.-> Is this assymetry between X and Y arm?
[CRY]
EX temperature is increased lineary.
EY temperature is kept almost constant.
IX, IY temperature is very stable. IY, EX, EY are not cryogenic temperature
[DGS]
ADC STAT gives almost all normal but
LSC-ADC-1, ALS0-ADC-0, IOO-ADC-1, IOO-ADC-3, IOO1-ADC-0, EY0-ADC-0 give some lines in Overflow.
[GIF]
There are two peak around 2019-12-20 12:00(UST) and 2019-12-20 19:30(UST).
It also gives bigger movement initially and slowly decreased with time.
This behaviour is different from the yesterday GIF feature (it was mostly stable with some clean peaks).
[IMC]
Amplitude spectral density is almost same as before, it shows similar peaks.
TRANS intensity(?) fluctuation not frequenct, it is mostly stable.
It shows sudden drop around 2019-12-20 12:00(UST) and 2019-12-20 19:30(UST),
these times corresponds to GIF peaks and STRAIN-DQ lockloss times.
There is unstable period during 2019-12-20 02:00 and 04:00(UST).